Automotive Display Market Report Scope & Overview:
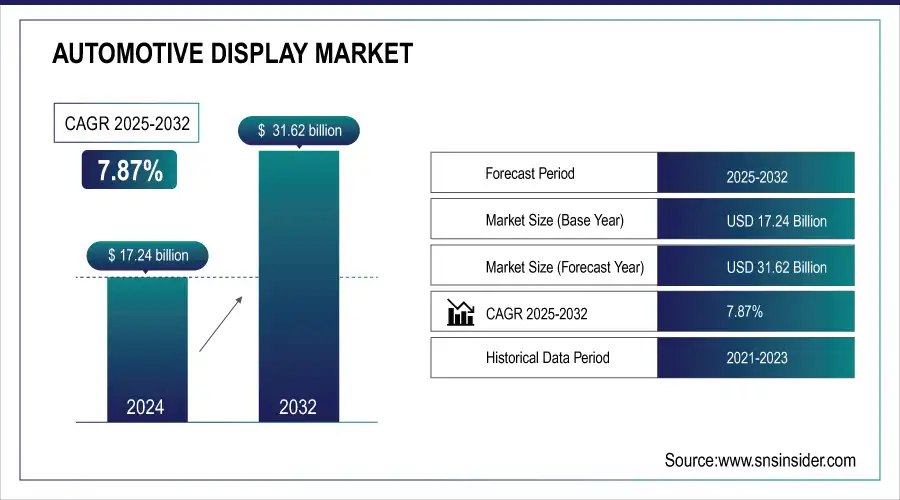
The Automotive Display Market size was valued at USD 17.24 billion in 2024 and is expected to reach USD 31.62 billion by 2032 and grow at a CAGR of 7.87% over the forecast period 2025-2032.
Get Sample Copy of Automotive Display Market - Request Sample Report
The Automotive Display Market is poised for rapid expansion, driven by several converging trends. First, there is a clear uptick in consumer demand for advanced in-vehicle technologies, with features like advanced driver-assistance systems (ADAS) and panoramic displays becoming increasingly sought after. Additionally, government initiatives supporting the growth of electric and autonomous vehicles are indirectly fueling the need for sophisticated display systems. These next-generation displays will be essential for enabling capabilities such as real-time traffic updates, vehicle diagnostics, and augmented reality-based navigation components of the evolving automotive landscape.
Moreover, advancements in display technology are further propelling market growth, particularly the shift toward OLED displays. Known for their exceptional contrast ratios and energy efficiency compared to traditional LCDs, OLEDs present a highly attractive option for both automakers and consumers. Leading industry players like LG are heavily investing in this space, including a substantial USD 2.8 billion commitment to expand OLED production specifically for automotive use. As a result, the market is expected to witness a significant transition toward this cutting-edge technology in the coming years.
Automotive Display Market Size and Forecast
-
Market Size in 2024: USD 17.24 Billion
-
Market Size by 2032: USD 31.62 Billion
-
CAGR: 7.87% from 2025 to 2032
-
Base Year: 2024
-
Forecast Period: 2025–2032
-
Historical Data: 2021–2023
Automotive Display Market Trends
-
Rising demand for advanced infotainment, safety, and driver assistance systems is driving automotive display market growth.
-
Adoption of OLED, LCD, and touchscreen technologies is enhancing visual quality and user interaction.
-
Increasing integration of digital instrument clusters, head-up displays, and ADAS interfaces is boosting applications.
-
Growth of electric and connected vehicles is expanding display requirements and functionality.
-
Focus on customizable, flexible, and curved displays is shaping design trends.
-
Expansion of premium and luxury vehicle segments is accelerating adoption.
-
Collaborations between automakers, display manufacturers, and technology providers are fostering innovation and next-gen solutions.
Automotive Display Market Growth Drivers:
- Rising ADAS and autonomous driving adoption boosts demand for high-resolution interactive automotive displays, enhancing driver safety.
The growing adoption of Advanced Driver Assistance Systems (ADAS) and autonomous driving technologies is significantly driving the demand for automotive displays. These systems rely on high-resolution, interactive screens to provide real-time information, such as lane departure warnings, collision alerts, adaptive cruise control status, and navigation guidance. By integrating digital instrument clusters, head-up displays, and infotainment panels, vehicles can enhance driver awareness, safety, and decision-making capabilities. As automakers focus on improving road safety and offering sophisticated driving experiences, the deployment of advanced displays becomes essential, positioning ADAS as a major growth driver for the automotive display market in the coming years.
Automotive Display Market Restraints:
-
High Cost of Head-Up Displays Limits Widespread Integration and Slows Automotive Display Market Growth.
The high cost associated with head-up displays (HUDs) significantly restrains the automotive display market. These systems require advanced optics and integration, making them expensive to manufacture and install. As a result, HUDs are primarily found in high-end or luxury vehicles, limiting accessibility for mass-market adoption. This price barrier discourages automakers from including HUDs in lower-tier models, thereby restricting market penetration and slowing the overall growth of display technologies in the automotive sector.
-
Limited Adoption Across Global Markets Restricts Automotive Display Technology Penetration and Slows Overall Market Growth
Despite the technological advancements, the adoption of automotive displays remains limited, especially in emerging and cost-sensitive markets. Many consumers are unaware of the benefits, and automakers are hesitant to invest in integrating costly display technologies in regions with low return potential. This lack of widespread adoption delays economies of scale, slows innovation cycles, and ultimately hampers the market’s progress toward broader acceptance and technological standardization across various vehicle segments.
Automotive Display Market Segment Analysis
By Display Type, Instrument Cluster Displays dominate the Automotive Display Market, while Head-Up Displays are growing at the fastest CAGR.
Instrument Cluster Displays lead the market with an estimated share of 40.13% in 2024. These displays provide essential driving data like speed, fuel, and navigation. Industry players such as Bosch and Continental are continuously innovating digital clusters with enhanced resolution and smart alerts, reinforcing this segment’s market dominance.
Head-Up Displays are growing at the fastest pace, registering a CAGR of 12.04% :: These systems enhance driving safety by projecting information onto the windshield. AR-based HUDs by companies like Panasonic and Denso are gaining momentum, particularly in EVs and high-end vehicles.
By Technology, TFT-LCD displays lead the market, and AMOLED displays are expanding at the fastest rate.
TFT-LCD technology dominates the market, accounting for a 55.26% share in 2024. Its widespread use is driven by affordability and proven reliability. Manufacturers such as LG Display and Panasonic are enhancing the technology with better visuals and responsive touch layers.
AMOLED displays are the fastest-growing, with a CAGR of 14.27%. Renowned for vivid contrast and flexibility, these displays are increasingly being adopted in premium and electric vehicles. LG and Samsung are expanding production capacity to meet this rising demand in the automotive space.
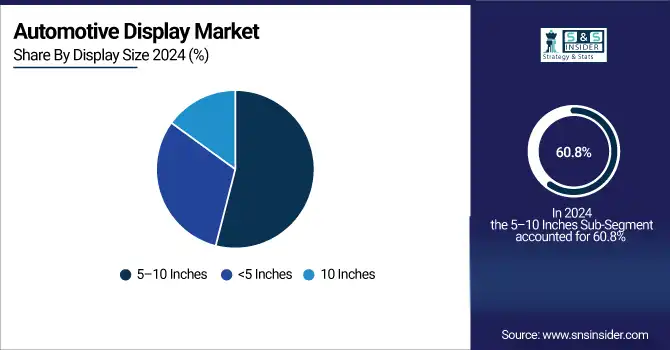
By Display Size, Displays sized 5–10 inches hold the largest market share, whereas displays above 10 inches are growing fastest.
Displays sized 5–10 inches hold the majority market share at 60.08% :: in 2024. These are commonly used in infotainment units and instrument clusters due to their practicality and balance between usability and cost. OEMs are enhancing these displays with high resolution and smart features.
Displays above 10 inches are expanding rapidly, with a CAGR of 13.36%. High-end vehicles and EVs are increasingly incorporating wide-screen dashboards for a futuristic cockpit experience. Tesla and Mercedes-Benz are driving this segment with panoramic and curved screen installations.
By Vehicle Type, Passenger cars account for the largest share, and Electric Vehicles are the fastest-growing segment.
Passenger cars account for the largest market share of 50.67% in 2024. The growing integration of digital displays in sedans, SUVs, and hatchbacks fuels this dominance. Automakers like Hyundai, Toyota, and BMW are consistently upgrading their in-car display offerings.
Electric vehicles are the fastest-growing category, with a projected CAGR of 14.86%. EVs often feature sophisticated digital interiors, making them ideal candidates for innovative display applications. Companies such as BYD, Rivian, and Lucid Motors are emphasizing this as part of their brand value.
By Sales Channel, OEM-installed displays dominate the market, while the aftermarket segment is witnessing the fastest growth.
OEM-installed displays dominate with a substantial market share of 80.31% in 2024. These factory-fitted systems ensure tighter integration and better-quality assurance. Major OEM partners like Continental, Visteon, and Magna are providing scalable and customizable display solutions for carmakers globally.
The aftermarket segment is witnessing notable growth, posting a CAGR of 11.07%. Increasing consumer interest in upgrading legacy vehicles with modern infotainment systems is driving this trend. Brands like Kenwood, Sony, and Alpine offer competitive touchscreen units with smart functionality.
Automotive Display Market Regional Analysis
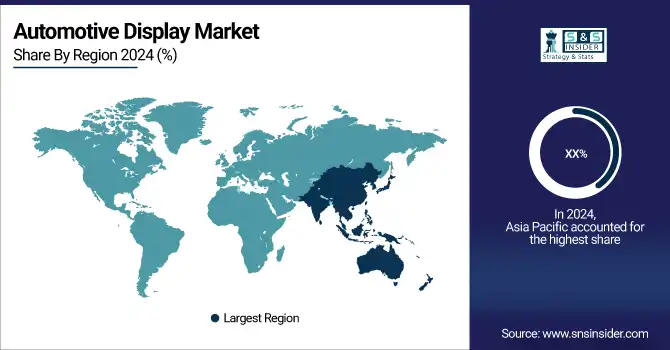
Asia Pacific Automotive Display Market Insights
Asia Pacific dominates the Automotive Display Market due to its robust automotive manufacturing ecosystem and the presence of key economies like China, Japan, South Korea, and India. These countries house leading OEMs and display manufacturers such as LG Display and Hyundai Mobis. The region’s dominance is driven by high vehicle production, rapid urbanization, rising disposable income, and growing consumer preference for technologically advanced vehicles. Additionally, increasing adoption of electric vehicles and government support for smart mobility initiatives further accelerate market growth in the region.
Get Customized Report as per Your Business Requirement - Enquiry Now
North America Automotive Display Market Insights
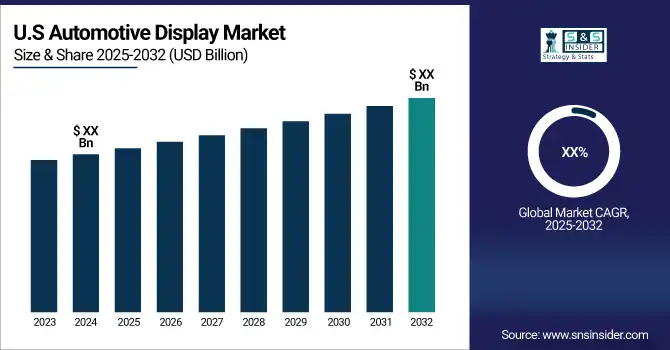
North America is witnessing steady growth in the automotive display market, driven by high adoption of advanced infotainment and driver assistance technologies. The U.S. dominates this region due to strong demand for premium vehicles, a tech-savvy population, and investments by companies like Tesla and General Motors. The rising adoption of electric and autonomous vehicles further propels the market across the region.
Europe Automotive Display Market Insights
Europe holds a significant share in the automotive display market, backed by stringent safety regulations, premium automotive brands, and rising demand for connected cars. Germany leads the region, owing to its strong automotive heritage and innovations by companies such as BMW, Audi, and Bosch. Increasing EV penetration and support for sustainable mobility also drive the display technology demand across the continent.
Middle East & Africa and Latin America Automotive Display Market Insights
The automotive display market in the Middle East & Africa and Latin America is gradually emerging, driven by rising demand for luxury and connected vehicles. The UAE leads in the Middle East & Africa due to high disposable income and smart city initiatives, while Brazil dominates Latin America with its large automotive base and growing interest in smart dashboard features. Increasing EV adoption and technological upgrades further support moderate growth across both regions.
Automotive Display Market Competitive Landscape:
Robert Bosch GmbH Overview:
Robert Bosch GmbH is a global engineering and technology company specializing in automotive components, industrial solutions, and mobility services. The company focuses on developing advanced automotive systems, including powertrain, safety, and driver-assistance technologies. Bosch invests heavily in innovation, integrating AI, connectivity, and IoT solutions to enhance vehicle performance, safety, and user experience. Its expertise in automotive electronics and software solutions positions it as a leader in the rapidly evolving smart mobility and autonomous driving market.
-
In January 2024, Robert Bosch GmbH introduced a cockpit and ADAS integration platform powered by Qualcomm’s Snapdragon Ride Flex SoC, enabling seamless support for both infotainment and driver-assistance features on a unified computing system.
Panasonic Corporation Overview:
Panasonic Corporation is a leading global electronics and technology company providing advanced solutions across automotive, consumer electronics, and industrial sectors. The company focuses on smart mobility, in-car infotainment, and connected vehicle technologies, leveraging AI, IoT, and advanced graphics capabilities. Panasonic collaborates with automotive OEMs and tech partners to develop immersive, safe, and user-friendly driving experiences, enhancing both driver assistance systems and in-car entertainment through cutting-edge software and hardware integration.
-
In January 2025, Panasonic Corporation and Qualcomm Technologies expanded their collaboration to integrate the Snapdragon Cockpit Elite system into vehicles, enhancing in-car experiences with AI-powered features, immersive gaming, and advanced 3D graphics capabilities.
KEY PLAYERS:
Some of the Automotive Display Market Companies
-
Continental AG
-
LG Display Co. Ltd
-
Panasonic Corporation
-
Delphi Technologies
-
Visteon Corporation
-
3M Company
-
Nippon Seiki Co. Ltd
-
Qualcomm Technologies Inc
-
Sharp Corporation
-
Samsung Electronics
-
Denso Corporation
-
Valeo SA
-
Hyundai Mobis
-
Pioneer Corporation
-
Continental Engineering Services
-
Harman International
-
AU Optronics Corporation
-
Innolux Corporation
| Report Attributes | Details |
|---|---|
| Market Size in 2024 | US$ 17.24 Billion |
| Market Size by 2032 | US$ 31.62 Billion |
| CAGR | CAGR of 7.87% From 2025 to 2032 |
| Base Year | 2023 |
| Forecast Period | 2025-2032 |
| Historical Data | 2021-2023 |
| Report Scope & Coverage | Market Size, Segments Analysis, Competitive Landscape, Regional Analysis, DROC & SWOT Analysis, Forecast Outlook |
| Key Segments |
|
| Regional Analysis/Coverage | North America (US, Canada, Mexico), Europe (Eastern Europe [Poland, Romania, Hungary, Turkey, Rest of Eastern Europe] Western Europe] Germany, France, UK, Italy, Spain, Netherlands, Switzerland, Austria, Rest of Western Europe]), Asia Pacific (China, India, Japan, South Korea, Vietnam, Singapore, Australia, Rest of Asia Pacific), Middle East & Africa (Middle East [UAE, Egypt, Saudi Arabia, Qatar, Rest of Middle East], Africa [Nigeria, South Africa, Rest of Africa], Latin America (Brazil, Argentina, Colombia, Rest of Latin America) |
| Company Profiles | Robert Bosch GmbH, Continental AG, LG Display Co. Ltd, Panasonic Corporation, Magneti Marelli S.p.A, Delphi Technologies, Visteon Corporation, 3M Company, Nippon Seiki Co. Ltd, Qualcomm Technologies Inc, Sharp Corporation, Samsung Electronics, Denso Corporation, Valeo SA, Hyundai Mobis, Pioneer Corporation, Continental Engineering Services, Harman International, AU Optronics Corporation, Innolux Corporation |
Frequently Asked Questions
Ans: Asia Pacific dominated the Automotive Display Market in 2024, led by rising EV adoption and advanced automotive display integration.
Ans: Instrument Cluster Displays dominated the market in 2024, while Head-Up Displays showed the fastest growth trend.
Ans: Rising adoption of ADAS and autonomous driving technologies, requiring high-resolution interactive displays to enhance driver safety and awareness, is the key growth driver.
Ans: The Automotive Display Market size in 2024 is estimated at approximately USD 17.24 billion.
Ans: The Automotive Display Market is projected to grow at a CAGR of 7.87% from 2025 to 2032.
Get in Touch
