Internal Combustion Engine (ICE) Market Report Scope & Overview:
Get E-PDF Sample Report on Internal Combustion Engine (ICE) Market - Request Sample Report
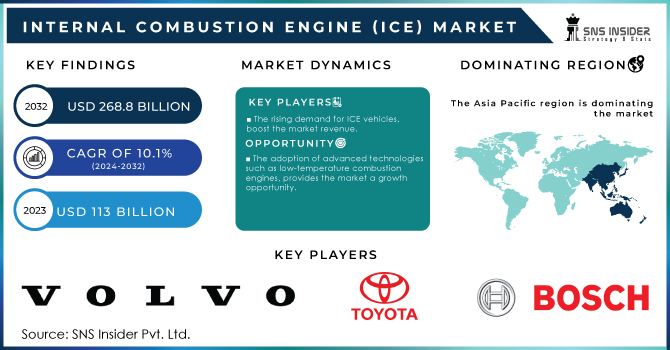
The Internal Combustion Engine (ICE) Market demand size was recorded at USD 113 Bn by 2023 and is expected to reach USD 268.8 Bn during 2032, growing at a CAGR of 10.1% over the forecast period 2024-2032.
This growth is driven by a growing focus on clean, sustainable energy solutions and increasing demand from sectors including cleaner transportation. Hydrogen ICE technology is a big improvement in reducing carbon emissions and increasing energy efficiency, so this innovative performance has enabled huge investments shaping technological development in automotive as well as the entire global energy consequences.
Moreover, because of the increasing adoption of ICEs in numerous automotive and non-automotive applications such as cars, motorcycles, aircraft, boats, diesel generators, lawnmowers locomotives ships airplanes in countries like China, Japan, India expected to hold substantial market share, thus further fuelling growth prospects in internal combustion engine market. The internal combustion engine (ICE) sector has recorded a lot of developments in recent times Low-temperature combustion, including Homogeneous charge compression Ignition (HCCI) and Premixed charge compression ignition(PCCI )has been able to improve engine efficiency by 20 % while emitting less toxins as well. For Instance, Low temperature Combustion(LTC) had made strategies to improve engine efficiency by up to 20% compared to conventional diesel engines. This is because LTC reduces emissions of particulate matter and nitrogen oxides by lowering combustion temperatures and avoiding fuel-rich regions. By helping engines meet increasingly stringent emissions regulations, LTC is enabling the continued growth and development of the ICE market.
The recent technological advancement in combustion engine design and material that leads to improvement in efficiency and effectiveness, have boosted the market in recent years .For Instance, Toyota is also planning to reveal a new in-built-powertrain (or internal combustion engine, ICE) which includes a 1.5- and four-liter cylinders that will be used in vehicles from July 2024. The new innovations that driving this momentum are Variable Displacement Engines (VDE) and high-performance hybrid electric powertrains.
Lightweight, high-strength composite materials and electronic controls are helping manufacturers improve engine. NVH as well as move advanced technologies into these fast-moving marine propulsion power plants for commercial fleet operations. In addition to electrification efforts, alternative fuels such as biofuels and hydrogen are becoming more widespread for fossil-fueled ICE technologies is helping the newest-generation internal combustion engines make up ground in a move toward sustainability.
Market Dynamics:
Driver
The rising demand for ICE vehicles, boost the market revenue.
The rising demand for vehicles globally and the growing need to expand transportation infrastructure, consequently projecting significant growth in the internal combustion engine market. Road vehicles are key in almost all trade since they play such an important role as facilitative agents for the global supply chain to provide regional connectivity and timely goods delivery. For Instance, Nearly 14 million new electric passenger cars were registered in the world during the year, making it a total of 40 million that are now driving on roads around almost at a sales-forecast movement track from last year's outcome, splitting up to two times the normal level. Almost 18% of cars sold were electric, compared to an average of just over 14% in 2022. These trends show that growth is healthy as electric car markets head out of the initial market phase in 2022.
On the other hand, Mercedes-Benz revealed its new efficient gasoline-powered E-Class model in April 2023 reflecting the industry's gradual shift towards electrification
Restrain
The high cost associated with purchase, fuel, and maintenance, reduces the demand for ICE vehicles.
Opportunity
The adoption of advanced technologies such as low-temperature combustion engines, provides the market a growth opportunity.
Challenge
Strict government regulation regarding emissions affects and balances efficiency and performance, hindering the market.
Market Segmentation
By Fuel
-
Petroleum
-
Natural Gas
The petroleum segment contributed to the largest share of more than 80% in 2023 and is anticipated to register the highest growth rate over the forecast period owing to benefits offered by petroleum internal combustion engines which include low vibration, noise among others In addition, the segment is anticipated to generate revenue due rise in technological developments within automobile industry. This growth is due to their efficiency, low cost, lightweight nature, and emission reduction capability as compared with other fuels that we use in engines.
By End-User
-
Automotive
-
Marine
-
Aircraft
By End-User, the automotive segment held the highest volume share of more than 68% in 2023 and is anticipated to grow with significant rate during forecast period. This growth is associated with the rising spending power of consumers. Vehicle makers are currently fine-tuning new efficient internal combustion engines that deliver the highest returns on manufacturing investments. Additionally, adopting advanced technology for enhancing IC engine fuel economy, emission and performance is anticipated to create growth opportunities in the market across its forecast period.
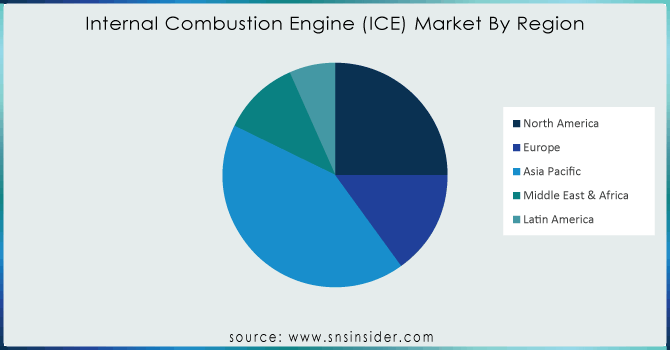
Regional Analysis:
Asia-Pacific region dominates the Internal Combustion Engine market with more than 40% of the market share in the global market in 2023. The presence of a large number of automotive manufacturers and growing demand for passenger automobiles in major countries including China and India are expected to influence the growth prospects. Moreover, the non-availability of electric vehicle charging infrastructure due to the absence of power distribution agreements in countries is another major constraint, and the very high cost for development when compared with other car accessories is supporting market growth. In addition to considering that ICE emits less harmful gases, it is aimed at making itself a viable option as the next alternative over EVs by using natural gas in IC engines.
According to geography, North America is expected to increase at a rapid pace during the course of the projection period due to the country's growing automotive use. We should use the North American region, home to renowned automakers like General Motors Company and Ford Motor Corporation, as an example. The automotive industry is changing the way that cars are built, leading to fewer and smaller engines for better performance so similar it becomes lightweight which paves another reason for efficiency. Therefore, these innovations in technology fuel the growth of the market. European Government rules on emissions have been the strictest globally and more gravitate to electric cars will be found in Europe, thus it should see a higher internal combustion share.
Get Customized Report as Per Your Business Requirement - Request For Customized Report
REGIONAL COVERAGE
North America
-
US
-
Canada
-
Mexico
Europe
-
Eastern Europe
-
Poland
-
Romania
-
Hungary
-
Turkey
-
Rest of Eastern Europe
-
-
Western Europe
-
Germany
-
France
-
UK
-
Italy
-
Spain
-
Netherlands
-
Switzerland
-
Austria
-
Rest of Western Europe
-
Asia Pacific
-
China
-
India
-
Japan
-
South Korea
-
Vietnam
-
Singapore
-
Australia
-
Rest of Asia Pacific
Middle East & Africa
-
Middle East
-
UAE
-
Egypt
-
Saudi Arabia
-
Qatar
-
Rest of Middle East
-
- Africa
-
Nigeria
-
South Africa
-
Rest of Africa
-
Latin America
-
Brazil
-
Argentina
-
Colombia
-
Rest of Latin America
Key Players:
The major key players are as follows Volvo AB, Toyota, Volkswagen, Renault SA, MAN SE, General Motors Co, Ford Motor, Fiat, Robert Bosch, and others.
Recent Developments
-
In June 2023, General Motors revealed plans to invest $632 million for the enhancement of its Fort Wayne Assembly facility located in Indiana. This investment will rebuild the plant to build America's next generation of full-size ICE pickups. This important strategic move is taken by company for expanding production capacities and meeting the changing requirements of one of its automotive customers
-
In April 2023, Mercedes' sixth-generation E-Class introduced the automaker's last new combustion engine model. The next generations of the E-Class will be based on a new platform designed to cater for electric powertrains but this current generation matters right now.
| Report Attributes | Details |
| Market Size in 2023 | USD 113.0 Bn |
| Market Size by 2032 | USD 268.8 Bn |
| CAGR | CAGR of 10.1 % From 2024 to 2032 |
| Base Year | 2023 |
| Forecast Period | 2024-2032 |
| Historical Data | 2020-2022 |
| Report Scope & Coverage | Market Size, Segments Analysis, Competitive Landscape, Regional Analysis, DROC & SWOT Analysis, Forecast Outlook |
| Key Segments | By Fuel: Petroleum, Natural Gas By End-User: Automotive, Marine, Aircraft |
| Regional Analysis/Coverage | North America (US, Canada, Mexico), Europe (Eastern Europe [Poland, Romania, Hungary, Turkey, Rest of Eastern Europe] Western Europe] Germany, France, UK, Italy, Spain, Netherlands, Switzerland, Austria, Rest of Western Europe]), Asia Pacific (China, India, Japan, South Korea, Vietnam, Singapore, Australia, Rest of Asia Pacific), Middle East & Africa (Middle East [UAE, Egypt, Saudi Arabia, Qatar, Rest of Middle East], Africa [Nigeria, South Africa, Rest of Africa], Latin America (Brazil, Argentina, Colombia Rest of Latin America) |
| Company Profiles | Volvo AB, Toyota, Volkswagen, Renault SA, MAN SE, General Motors Co, Ford Motor, Fiat, Robert Bosch, and others. |
| Key Drivers | The rising percentage of demand for ICE vehicles |
| Market Restraints | The high entry barriers and the increase in operating expenses because of geopolitical pressures. |
Frequently Asked Questions
The major key players are as follows Volvo AB, Toyota, Volkswagen, Renault SA, MAN SE, General Motors Co, Ford Motor, Fiat, Robert Bosch, and others.
Ans; APAC region will be dominating the market during the forecasted period.
Ans: The high entry barriers and the increase in operating expenses because of geopolitical pressures.
Ans; The rising percentage of demand for ICE vehicles
Ans: The Internal Combustion Engine (ICE) Market size is expected to reach USD 268.8 Bn by 2032, the value for the year 2023 was recorded at USD 113 Bn the market is expected to grow at a CAGR of 10.1% over the forecast period 2024-2032.
Get in Touch
