Bioadhesives Market Report Scope & Overview:
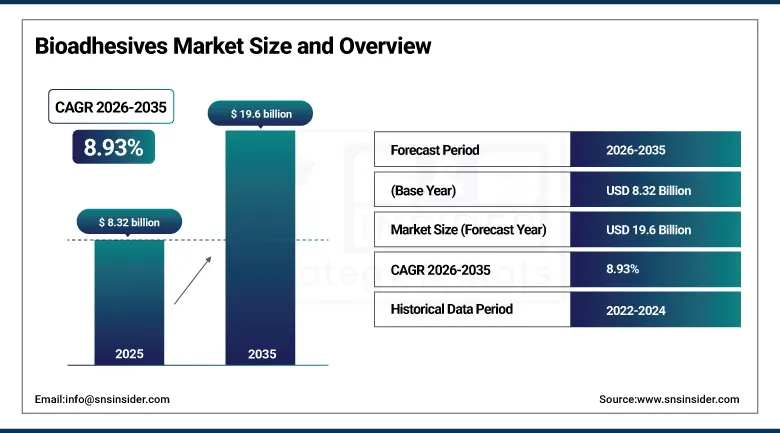
The Bioadhesives Market was valued at USD 8.32 Billion in 2025 and is expected to reach USD 19.6 Billion by 2035, growing at a CAGR of 8.93% from 2026–2035.
The global bioadhesives market is advancing as the adhesives industry undergoes a structural transition from petroleum-derived synthetic adhesives toward biologically sourced alternatives whose renewable raw material base, biodegradable performance characteristics, and low formaldehyde emissions create competitive advantages in packaging, construction, and healthcare applications whose sustainability specifications are progressively tightening. Bioadhesives are derived from renewable biological sources encompassing plant-based polymers including starch, cellulose, dextrin, and natural rubber, and animal-based proteins including casein, albumin, collagen, and gelatin, whose adhesive properties enable bonding applications across paper and packaging, woodworking, flooring, construction, and medical wound closure. Increasing regulatory restriction on volatile organic compound emissions, the packaging industry’s transition toward recyclable and compostable material systems, and the healthcare sector’s demand for biocompatible tissue adhesives for surgical wound closure collectively sustain above-average market growth.
In 2024, Henkel AG expanded its Technomelt SUPRA bioadhesive product line for flexible packaging lamination applications, introducing new plant-based hot-melt formulations achieving equivalent bond strength to conventional EVA hot-melt adhesives while reducing formaldehyde emissions below the threshold required for indoor air quality certification under Eurofins Gold Standard labelling. The expansion responded to brand owner demand for packaging adhesive solutions compatible with recyclability claims whose adhesive composition requirements for paper-based packaging recycling streams prohibit petroleum-derived polymers that contaminate fibre recycling processes.
Market Size and Forecast
-
Market Size in 2026E: USD 9.06 Billion
-
Market Size by 2035: USD 19.6 Billion
-
CAGR: 8.93% from 2026 to 2035
-
Fastest Growing Region: Asia Pacific
-
Largest Region: North America
To Get more information on Bioadhesives Market - Request Free Sample Report
Bioadhesives Market Trends
-
Recyclable flexible packaging system adoption is creating demand for bioadhesive laminates compatible with mono-material recycling stream requirements.
-
Medical bioadhesive innovation using mussel-inspired polydopamine chemistry is creating waterproof tissue bonding capability for wet surgical environments.
-
Casein and soy protein adhesive reformulation is improving water resistance for woodworking and flooring applications meeting California Proposition 65 compliance.
-
Starch-based bioadhesive encapsulation technology is improving thermal stability and extending shelf life for hot-melt packaging adhesive applications.
-
Regulatory VOC emission limits are driving construction industry specification of bioadhesive flooring adhesives replacing solvent-based synthetic alternatives.
The U.S. Bioadhesives Market Outlook
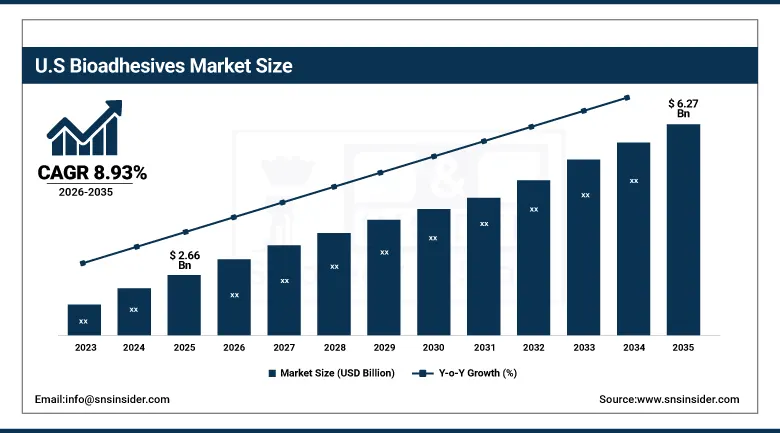
The U.S. Bioadhesives Market was valued at approximately USD 2.66 Billion in 2025 and is expected to reach approximately USD 6.27 Billion by 2035, growing at a CAGR of approximately 8.93%.
The United States leads North American bioadhesives revenues through its strict EPA VOC emission limits for adhesives and sealants creating regulatory substitution demand, the packaging industry’s sustainability commitment from brand owners including Procter & Gamble, Unilever, and Amazon whose sustainable packaging pledges create upstream adhesive specification requirements, and the wood products industry’s California Air Resources Board CARB Phase 2 compliance creating formaldehyde-free bioadhesive specification in composite wood panel production. Henkel and H.B. Fuller sustain U.S. bioadhesive market leadership.
In 2023, H.B. Fuller launched its CLARITY biobased adhesive product line for bookbinding and graphic arts applications, featuring polyvinyl alcohol and starch copolymer formulations achieving high bond strength and flexibility equivalent to petroleum-derived PVA adhesives while qualifying for biobased content certification under the USDA BioPreferred programme. The launch addressed graphic arts market demand for biobased adhesive alternatives whose certification documentation supports brand owner sustainability report claims without compromising the binding strength and aging resistance performance that professional print and publishing applications require.
Bioadhesives Market Segment Analysis
-
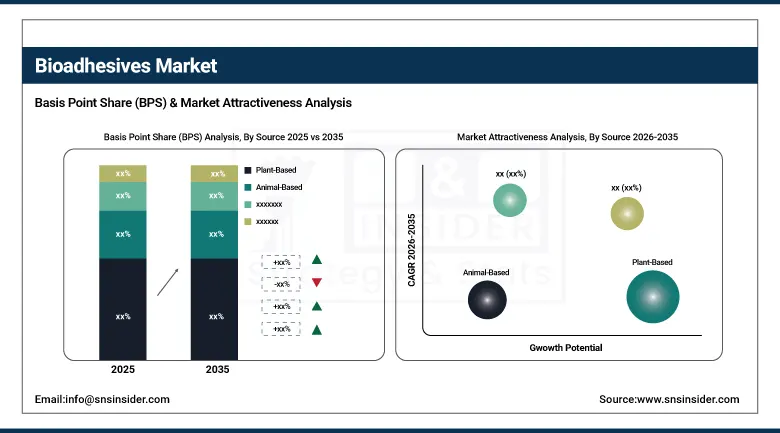
By Source, plant-based segment dominated the bioadhesives market with the largest share in 2025, expected to hold approximately 70.34% by 2035, while animal-based is the fastest growing with a CAGR of approximately 9.78%.
-
By Application, boxes & cartons segment dominated the bioadhesives market with the largest share in 2025 through corrugated packaging’s high-volume starch adhesive consumption, while the wound care & medical segment is the fastest growing application.
-
By End User, paper & packaging segment dominated the bioadhesives market with the largest share in 2025, while the healthcare segment is the fastest growing end user driven by surgical bioadhesive and medical device assembly demand.
By Source, plant-based dominates, animal-based grows fastest
Plant-based adhesives retained the dominant source position with the largest share of the bioadhesives market in 2025, projected to hold approximately 70.34% of market share by 2035. Their commercial primacy reflects the scale advantage that starch-based adhesives provide in the corrugated packaging industry, whose global production of over 400 billion square metres annually creates the world’s largest single bioadhesive application. The papermaking industry’s decades-long adoption of starch as a surface sizing, coating binder, and corrugated fluting adhesive creates an established supply chain infrastructure, validated performance database, and industrial processing familiarity that sustains starch bioadhesive specification dominance across the paper and packaging sector. Cellulose-derived adhesives, dextrin-based bottle labelling adhesives, and natural rubber contact adhesives for footwear and foam bonding collectively sustain plant-based bioadhesive consumption across diverse application categories.
Animal-based adhesives are growing fastest at approximately 9.78% CAGR because the healthcare sector’s demand for biocompatible tissue adhesives whose protein-based chemistry mimics biological tissue composition creates growing adoption of collagen, fibrin, albumin, and mussel-inspired adhesive proteins for surgical wound closure, orthopaedic implant fixation, and drug-eluting patch adhesion. Each new surgical bioadhesive product approved for tissue bonding creates healthcare procurement whose per-application commercial value substantially exceeds packaging adhesive economics, sustaining animal-based segment’s above-average revenue growth rate despite its smaller volume share.
By End User, paper & packaging dominates, healthcare grows fastest
Paper and packaging retained the dominant end-user position with the largest share of the bioadhesives market in 2025. The corrugated box manufacturing industry’s systematic adoption of starch-based fluting adhesives as the technical standard for corrugated board production creates a non-discretionary high-volume bioadhesive consumption base whose annual procurement scales directly with global corrugated packaging production volume of 400+ billion square metres. Flexible packaging lamination, pressure-sensitive label adhesives for beverage and food labels, and carton sealing adhesives collectively extend paper and packaging bioadhesive consumption across the full spectrum of consumer goods packaging formats whose brand owner sustainability commitments are creating progressive specification pressure toward certified biobased and recyclability-compatible adhesive systems.
Healthcare is growing fastest because the expanding surgical bioadhesive and medical device assembly applications are creating above-market bioadhesive adoption whose per-application commercial value and technical performance requirements sustain premium pricing that packaging applications cannot approach. Surgical tissue adhesives replacing sutures in wound closure, haemostatic bioadhesives for intraoperative bleeding control, and drug delivery patch bioadhesive systems each represent growing healthcare bioadhesive application categories whose collective clinical adoption is creating the market’s highest-value end-user demand growth.
Regional Analysis
|
Region |
Major Country |
Share within Region, 2025 (%) |
|---|---|---|
|
North America |
United States |
82.5% |
|
Europe |
Germany |
24.6% |
|
Asia Pacific |
China |
52.4% |
|
Middle East & Africa |
Saudi Arabia |
22.8% |
|
Latin America |
Brazil |
43.8% |
North America Bioadhesives Market Insights
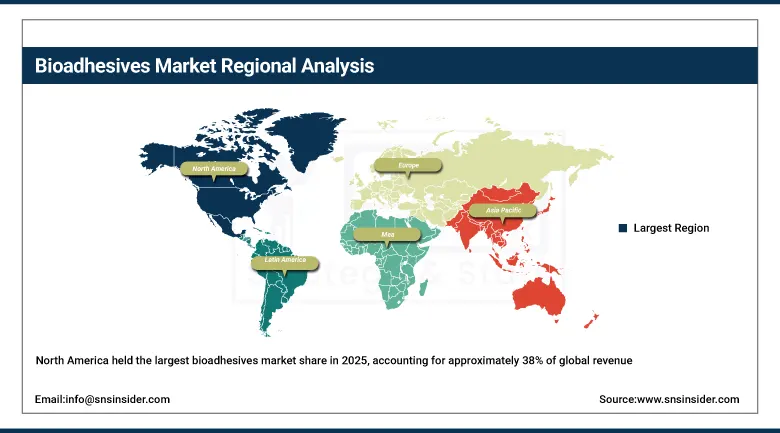
North America held the largest bioadhesives market share in 2025, accounting for approximately 38% of global revenue. This is driven by stringent EPA VOC emission limits, CARB Phase 2 formaldehyde regulations for wood composite panels, and the packaging industry’s extensive sustainability commitment. The United States accounts for approximately 82.5% of North American revenues through Henkel’s Technomelt bioadhesive portfolio, H.B. Fuller’s CLARITY biobased product line, and the packaging industry’s starch adhesive consumption at corrugated facilities across major North American market centres.
Canada contributes supplementary North American revenues through its large forest products industry’s adoption of protein and starch-based bioadhesives in oriented strand board and plywood manufacturing, the packaging sector’s growing bioadhesive specification under provincial extended producer responsibility regulations, and the healthcare industry’s growing surgical bioadhesive adoption in its advanced medical facilities.
Get Customized Report as per Your Business Requirement - Enquiry Now
Europe Bioadhesives Market Insights
Europe is the world’s most regulation-driven bioadhesives market where the EU’s REACH chemical regulation restricting VOC-emitting adhesive substances, the Ecodesign for Sustainable Products Regulation creating adhesive recyclability requirements for packaging, and the Construction Products Regulation’s emission class requirements for flooring and panel adhesives collectively create structured regulatory substitution demand for bioadhesive alternatives. Germany accounts for approximately 24.6% of European revenues through its large packaging, wood products, and construction sectors’ bioadhesive adoption.
France’s flexible packaging industry’s bioadhesive lamination investment, the Netherlands’ advanced sustainable packaging commitment creating brand owner adhesive specification requirements, and Italy and Spain’s large wood furniture and flooring industries’ bioadhesive adoption collectively sustain European market development. The EU’s Packaging and Packaging Waste Regulation creating mandatory recyclability requirements by 2030 creates a commercial transition catalyst for bioadhesive adoption across all consumer goods packaging categories.
Asia Pacific Bioadhesives Market Insights
Asia Pacific is the fastest-growing regional bioadhesives market, driven by the world’s largest corrugated packaging production, rapidly expanding e-commerce packaging demand, and growing regulatory pressure for sustainable packaging across China, Japan, South Korea, and Australia. China accounts for approximately 52.4% of Asia Pacific revenues through its dominant global corrugated box production, the largest single starch adhesive consumption market, and growing brand owner sustainability specifications from multinational companies whose Chinese supply chains are subject to global ESG procurement standards.
India is the most commercially dynamic emerging bioadhesives market within Asia Pacific, where the packaging industry’s rapid expansion, growing brand owner sustainability awareness, and government regulation of VOC emissions in construction adhesives create above-regional-average bioadhesive adoption momentum. Japan’s advanced sustainable packaging culture and South Korea’s strong biobased material policy frameworks contribute premium regional demand.
MEA & Latin America Bioadhesives Market Insights
Saudi Arabia leads MEA revenues through its growing packaging industry, the construction sector’s adoption of low-emission bioadhesive flooring and panel systems, and the healthcare sector’s procurement of medical bioadhesives in its expanding hospital infrastructure. The UAE’s sustainable packaging initiative and South Africa’s extended producer responsibility regulation contribute growing regional demand for bioadhesive packaging solutions.
Brazil leads Latin American revenues through its large corrugated packaging industry’s starch adhesive consumption, the wood furniture export sector’s formaldehyde-compliant bioadhesive adoption meeting European market import requirements, and the healthcare sector’s growing surgical bioadhesive procurement. Mexico and Colombia contribute growing secondary demand through their packaging and construction sectors’ progressive bioadhesive specification.
Market Dynamics
Growth Drivers: Packaging recyclability mandates and VOC emission regulations creating non-discretionary bioadhesive substitution demand across packaging and construction sectors
The bioadhesives market’s most commercially certain growth driver is the regulatory environment’s progressive restriction of petroleum-derived adhesive chemistries whose VOC emission, formaldehyde content, and non-recyclability create regulatory non-compliance in tightening emission and sustainability standards. The EU’s Packaging and Packaging Waste Regulation requiring 65% of packaging to be recyclable by 2025 creates adhesive compatibility requirements that many petroleum-derived lamination adhesives cannot meet within current recyclability testing frameworks, mandating bioadhesive specification for plastic-free and mono-material packaging applications. Each new sustainable packaging certification programme and each retailer’s packaging sustainability pledge creates brand owner specification requirements that propagate through the packaging supply chain to create adhesive manufacturer product development investment.
The packaging industry’s transition toward paper-based and mono-material flexible packaging creates an adhesive technology transition that benefits bioadhesives whose plant-based chemistry is compatible with fibre-based material recycling streams. Each flexible packaging format that transitions from multi-layer plastic laminate to paper-based or mono-material structure creates an adhesive specification change that bioadhesive products can fulfil where petroleum-derived alternatives cannot, creating a structural commercial transition that sustains bioadhesive market growth above the overall packaging adhesive market growth rate.
Restraints: Performance limitations versus synthetic adhesives in high-humidity applications and higher raw material cost constraining commodity market adoption
Bioadhesives’ inferior moisture resistance relative to synthetic adhesive alternatives creates performance adoption barriers in applications exposed to high humidity or liquid contact, including cold-chain food packaging, beverage label bonding, and exterior construction adhesive applications whose wet bond strength requirements exceed what current starch and protein bioadhesive formulations can reliably deliver without synthetic polymer modification that reduces bio based content certification eligibility. Each bioadhesive programme failure in high-humidity service creates performance concern that extends cautious specification review timelines beyond the regulatory compliance deadlines driving initial adoption evaluation.
Natural polymer raw material price volatility from agricultural commodity cycles, where starch prices track corn and wheat production and protein adhesive costs follow hide and dairy commodity markets, creates manufacturing cost uncertainty that bioadhesive producers cannot effectively hedge using the financial instruments available for petroleum feedstock price risk management. Each agricultural commodity price spike that increases bioadhesive production cost relative to petroleum-derived alternatives creates commercial pressure that constrains bioadhesive adoption in price-sensitive commodity packaging markets.
Opportunities: Surgical bioadhesive innovation and biobased content certification creating premium commercial differentiation
Surgical and medical bioadhesive development represents the most commercially valuable innovation frontier in the bioadhesives market, where each new FDA-cleared or CE-marked surgical tissue adhesive whose clinical evidence demonstrates equivalent or superior wound closure outcomes versus suture and staple creates a premium medical device market entry. The global surgical adhesive market’s shift toward bioadhesive formulations inspired by natural biological adhesion mechanisms, including mussel-inspired catechol chemistry, fibrin-based haemostatics, and polyethylene glycol crosslinked protein adhesives, creates a high-value commercial category whose regulatory approval barriers sustain premium pricing.
USDA BioPreferred programme certification and European bio based content labelling create commercial differentiation tools for bioadhesive manufacturers whose certified bio based content percentage provides procurement specification criteria that government agencies, brand owners with sustainability pledges, and eco-label certified product manufacturers can specify as a procurement requirement. Each new bio based content certification standard that enables quantitative bio based claim documentation creates commercial specification leverage that sustains premium pricing for certified bioadhesive products above commodity petrochemical adhesive market levels.
Recent Developments:
-
2024: Henkel AG expanded its Technomelt SUPRA bioadhesive product line for flexible packaging lamination, introducing plant-based hot-melt formulations achieving equivalent bond strength to EVA adhesives while reducing formaldehyde emissions below Eurofins Gold Standard indoor air quality certification thresholds.
-
2023: H.B. Fuller launched its CLARITY bio based adhesive product line for bookbinding and graphic arts applications, featuring polyvinyl alcohol and starch copolymer formulations qualifying for USDA BioPreferred programme certification while meeting professional binding performance requirements.
-
2023: CryoLife Inc. received FDA clearance for its BioGlue Surgical Adhesive new indication expansion for additional thoracic surgery applications, extending the albumin-glutaraldehyde bioadhesive’s clinical use to new surgical tissue bonding contexts in cardiac and thoracic procedures.
Bioadhesives Market Key Players are:
-
Henkel AG & Co. KGaA
-
H.B. Fuller Company
-
Ashland Global Holdings Inc.
-
Bostik SA (Arkema)
-
Sika AG
-
3M Company
-
Paramelt BV
-
DL Chemicals NV
-
Yparex BV
-
Adhesive Research Inc.
-
CryoLife Inc.
-
Cohera Medical Inc.
-
EcoSynthetix Inc.
-
Beardow Adams Ltd.
-
Organicell Regenerative Medicine Inc.
-
DowDuPont Inc. (Dow Performance Adhesives)
-
Adhezion Biomedical LLC
-
Bioadhesive Alliance Inc.
-
Infinity Bio-Chem Ltd.
-
Tremco Holdings LLC
Bioadhesives Market Report Scope:
| Report Attributes | Details |
|---|---|
| Market Size in 2025 | USD 8.32 Billion |
| Market Size by 2035 | USD 19.6 Billion |
| CAGR | CAGR of 8.93% From 2026 to 2035 |
| Base Year | 2025 |
| Forecast Period | 2026-2035 |
| Historical Data | 2022-2024 |
| Report Scope & Coverage | Market Size, Segments Analysis, Competitive Landscape, Regional Analysis, DROC & SWOT Analysis, Forecast Outlook |
| Key Segments | • By Source (Plant-Based, Animal-Based) • By Application (Boxes & Cartons, Cigarettes & Filters, Foil Laminates, Flooring, Labels & Envelopes, Woodworks, Wound Care & Medical, Others) • By End User (Paper & Packaging, Construction, Healthcare, Wood Industry, Personal Care & Cosmetics, Others) |
| Regional Analysis/Coverage | North America (US, Canada), Europe (Germany, UK, France, Italy, Spain, Russia, Poland, Rest of Europe), Asia Pacific (China, India, Japan, South Korea, Australia, ASEAN Countries, Rest of Asia Pacific), Middle East & Africa (UAE, Saudi Arabia, Qatar, South Africa, Rest of Middle East & Africa), Latin America (Brazil, Argentina, Mexico, Colombia, Rest of Latin America). |
| Company Profiles | Henkel AG & Co. KGaA, H.B. Fuller Company, Ashland Global Holdings Inc., Bostik SA (Arkema), Sika AG, 3M Company, Paramelt BV, DL Chemicals NV, Yparex BV, Adhesive Research Inc., CryoLife Inc., Cohera Medical Inc., EcoSynthetix Inc., Beardow Adams Ltd., Organicell Regenerative Medicine Inc., DowDuPont Inc. (Dow Performance Adhesives), Adhezion Biomedical LLC, Bioadhesive Alliance Inc., Infinity Bio-Chem Ltd., and Tremco Holdings LLC |
Frequently Asked Questions
The Bioadhesives Market is expected to grow at a CAGR of 8.93% from 2026 to 2035.
The Bioadhesives Market was valued at USD 8.32 Billion in 2025.
Packaging recyclability mandates requiring adhesive compatibility with mono-material recycling streams, VOC emission regulations creating synthetic adhesive substitution demand, and healthcare bioadhesive adoption for surgical wound closure and medical device assembly are the primary growth factors.
The Plant-Based segment dominated with the largest share in 2025, projected to hold approximately 70.34% by 2035.
North America dominated the Bioadhesives Market in 2025.
Get in Touch
