Rubber Processing Chemicals Market Report Scope & Overview
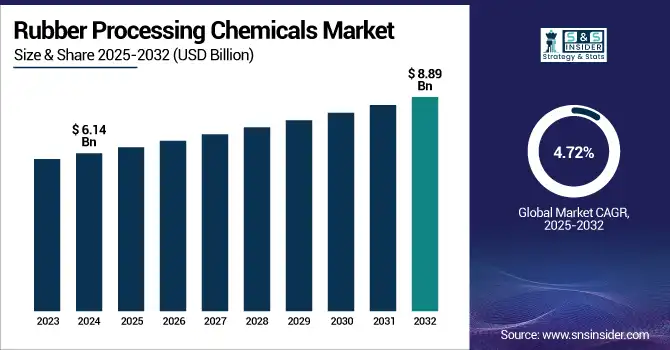
The Rubber Processing Chemicals Market size was USD 6.14 billion in 2024 and is expected to reach USD 8.89 billion by 2032, growing at a CAGR of 4.72% over the forecast period of 2025-2032.

To Get more information on Rubber Processing Chemicals Market - Request Free Sample Report
Rubber Processing Chemicals market analysis highlights increasing utilization in the automotive sector. The growth is driven by the increase in the global production and sales of vehicles (including trucks) and both continue their robust expansion, which further leads to an upsurge in demand for tires, seals, hoses, belts, and other rubber items that need to withstand a lot of kilometers and outside (as per AFPM) stresses and eventually wear and tear. This creates a need for very high-performance rubber processing chemicals, such as accelerators, anti-degradants, and processing aids, as these components require stringent performance, durability, and safety standards. Moreover, increased emphasis on fuel economy and preference for lighter-weight material in automobiles has compelled manufacturers to use advanced rubber technology, and this trend is expected to further augment the demand for these chemicals and drive the rubber processing chemicals market growth.
According to the data from the Open Government Data (OGD) Platform, the production of passenger vehicles in India rose to 4,901,840 units in 2023–24 from 4,587,116 units in 2022–23. With so many vehicles on the road, the demand for high-quality rubber components, including tires, hoses, and seals, is also on the rise, driving the vehicle manufacturing market forward.
Rubber Processing Chemicals Market Size and Forecast
-
Rubber Processing Chemicals Market Size in 2024: USD 6.14 Billion
-
Rubber Processing Chemicals Market Size by 2032: USD 8.89 Billion
-
CAGR: 4.72% from 2025 to 2032
-
Base Year: 2024
-
Forecast Period: 2025–2032
-
Historical Data: 2021–2023
Rubber Processing Chemicals Market Trends
-
Rising demand for tires, automotive components, and industrial rubber products is driving the rubber processing chemicals market.
-
Increasing use of accelerators, antioxidants, vulcanizing agents, and softeners is boosting product performance and efficiency.
-
Growing automotive production and industrialization are fueling market expansion.
-
Focus on improving durability, elasticity, and heat resistance is shaping chemical formulation trends.
-
Adoption of eco-friendly and sustainable chemicals is gaining traction due to environmental regulations.
-
Technological advancements in polymer chemistry are enhancing processing and product quality.
-
Collaborations between chemical manufacturers, rubber producers, and research institutions are accelerating innovation and development.
Rubber Processing Chemicals Market Growth Drivers:
-
Growing Demand for High-Performance and Specialty Rubber drives the Market Growth
The increasing requirement for high-performance and specialty rubber is one of the main driving factors behind the growth of the rubber processing chemicals market. Rubber materials with better performance properties, such as elasticity, durability, heat, wear, and chemical resistance, and resistance to weathering, are serving industries of every kind, from automotive, aerospace, industrial machinery, and consumer goods. This trend in high-spec rubber applications has led to increased use of high-performance processing chemicals that are required for enhanced processing– specific process chemicals which imparts improved physical properties in processed rubber compounds such as processability, mechanical properties, fatigue resistance, vulcanization chemicals oil and heat resistance, ozone and UV stability, fire resistance, and other specifications of the final rubber products.
As per the Rubber Board, India is the third-largest producer and fourth-largest consumer of natural rubber in the world. It has around 6000 rubber units, including all types of industries including large-scale, medium-scale, and small-scale, producing around 35000 rubber products. It employs more than 400,000 workers and is a major driver of income throughout the economy.
Rubber Processing Chemicals Market Restraints:
-
Complex Manufacturing Processes May Hamper the Market Growth
The manufacture of rubber processing chemicals is complex, hence hindering the growth of the rubber processing chemicals market. Rubber additives, including accelerators, anti-degradants, and flame retardants, rubber chemicals industry are specialty chemicals produced using advanced technology and precise chemical reactions that are strictly controlled. This complexity requires heavy investment in research & development, skilled labor, and advanced manufacturing facilities. Furthermore, environmental and safety regulations also pose issues for manufacturers as they try to maintain product quality. This makes it difficult for smaller businesses to enter or establish themselves in the market, reducing competition and innovation. As a whole, they can hinder the broader market from growing, because only the established players with deep pockets can afford to navigate all these manufacturing challenges efficiently.
Rubber Processing Chemicals Market Opportunities:
-
Increasing Adoption in Healthcare and Medical Devices Creates an Opportunity in the Market
Rubber processing chemicals market, as medical and healthcare devices are gaining adoption This creates an attractive opportunity for the market. Health care requires quality, sturdy rubber solutions that these rubber manufacturers make use of in the form of gloves, tubing, seals, and also different medical tools that feature direct contact with clients. Such products, which need a certain level of rubber processing chemicals in order to improve their functionality, biocompatibility, and protection against sterilization.
With an upsurge in healthcare infrastructure facilities worldwide and the rise in demand for sophisticated medical devices, manufacturers are looking to develop rubber materials that conform to stringent regulatory standards while ensuring end-user or patient safety. The paper addition, this random phenomenon propels the demand for novel chemical additives which making space for opportunities for growth and new product evolution in the rubber processing chemicals market and driving the rubber processing chemicals market trends.
The U.S. government has approved substantial investments to bolster the pharmaceutical and medical device manufacturing sectors. These investments aim to enhance domestic production capabilities and reduce reliance on foreign supply chains.
Moreover, the U.K. government has recognized life sciences as a key growth sector, committing up to USD 640 million to enhance the manufacturing of treatments and medical devices. Despite facing challenges in attracting foreign investments, the U.K.'s strong research base and infrastructure continue to support innovation in medical technologies.
Rubber Processing Chemicals Market Segment Analysis
By Product, Anti-degradants segment dominates the Rubber Processing Chemicals Market.
Anti-degradants held the largest Rubber Processing Chemicals market share, around 48%, in 2024. It is used as it serves two main functions of improving the durability and performance of rubber products by preventing degradation from heat, oxygen, ozone, and other environmental factors. Such chemicals are commonly found in tires, auto parts, and many industrial rubber products used today, especially those that require long-life performance with good aging resistance. Rising demand for highly durable and long-lasting rubber components, in particular those used in the automotive and construction sectors, has seen an increase in the use of anti-degradants.
Accelerators held a significant Rubber Processing Chemicals market share as they provide momentum toward vulcanization that commercializes the fundamentals of vulcanizing. These compounds shorten the vulcanization period and temperature range, thus optimizing the manufacturing process and lowering its costs. They are most used for tyre production, hose and belt production, and numerous other automobile and industrial rubber products where high resistance against wear, along with precise mechanical properties, are desired.
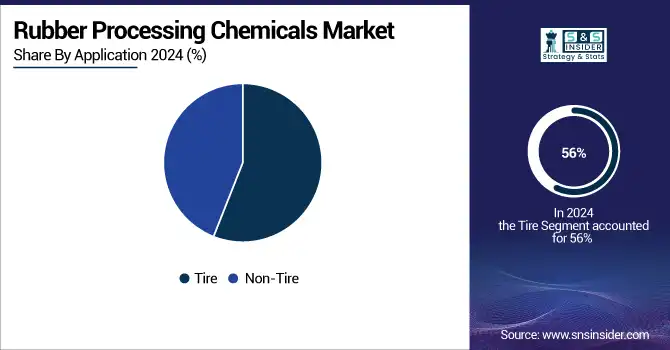
By Application, Tire segment dominates the market.
The Tire segment held the largest market share, around 56%, in 2024 owing to high global consumption of automotive tires in passenger vehicles, commercial trucks, and two-wheelers. As indispensable parts of a vehicle that need specific mechanical properties relating to resistance to wear and heat, elasticity, and traction, all these properties are improved using rubber processing chemicals including anti-degradants, accelerators, and processing aids for making tires. The growing production of vehicles, primarily in developing nations, and rising replacement tire demand have led to high consumption of these chemicals.
The non-tire segment holds a significant market share in the rubber processing chemicals market due to the consistency of seals, gaskets, hoses, belts, footwear, medical devices, and rubber parts for machinery and construction. These applications require properties such as flexibility, chemical resistance, weatherability, and durability, which are basically achieved by rubber processing chemicals such as accelerators, anti-degradants, and flame retardants. Growth in industries, such as construction, healthcare, industrial manufacturing, and consumer goods has led to increased demand for high-performance rubber products.

Rubber Processing Chemicals Market Regional Analysis
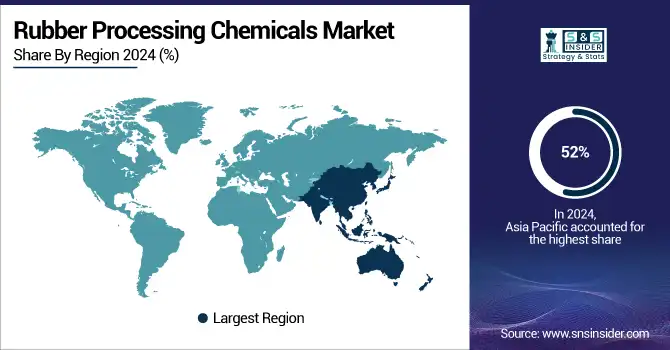
Asia Pacific Rubber Processing Chemicals Market Insights
Asia-Pacific held the largest market share, around 52%, in 2024. It is owing to rapid industrialization, high production of automobiles, and demand for rubber products in various end-use industries in that region. Countries, such as China, India, Japan, and South Korea, among others, serve as key markets for automotive manufacturing, tire production, and industrial goods are major consumers, and it is expected to drive the regional rubber processing chemicals market in the forthcoming years. The region's dominance is further reinforced by the availability of low-cost labor, the availability of raw materials, and government policies, broadly promote manufacturing and infrastructure. Moreover, the increasing number of people belonging to the middle-class section, coupled with the growing use of urbanization, has boosted the demand for automobiles, footwear, consumer goods, and construction materials, thus leading to hot rubber consumption.
In April 2023, China Petroleum & Chemical Corporation (Sinopec) is starting up its new copolymer production facility located in Hainan. This facility has an annual capacity of 170,000 tons for Styrene-Butadiene-Styrene (SBS) and Styrene-Ethylene-Butylene-Styrene (SEBS) copolymers and will be one of the largest production plants globally.
North America Rubber Processing Chemicals Market Insights
North America Rubber Processing Chemicals market held a significant market share and is the fastest-growing segment in the forecast period due to the presence of a well-established automotive, aerospace, and industrial manufacturing sector and the high demand for advanced rubber products. Increasing demand for high-performance, long-lasting, and specific rubber components in the region is driving the use of processing chemicals, which include accelerators, anti-degradants, and flame retardants. North America is also aware of technological innovations and research, which leads to trends toward more green and efficient rubber formulations. Regulatory agencies such as the EPA also promote safer, sustainable chemicals, driving the manufacturing industry toward more innovative processing technologies for green chemistry.
The U.S Rubber Processing Chemicals market size was USD 0.845 billion in 2024 and is expected to reach USD 1.35 billion by 2032 and grow at a CAGR of 6.10% over the forecast period of 2025-2032. The country’s growth is driven by an established industrial base, technology-driven innovations, and growth across various sectors, including automotive, aerospace, healthcare, and construction. The U.S. is one of the largest producers and consumers of vehicles, resulting in high demand for tires and rubber parts, which demand a range of processing chemicals to optimize performance, durability, and safety. Due to Ghana's significant concentration on R&D and advancement, advanced and environmentally friendly rubber compounds could be produced to satisfy progressing environmental regulations enforced by regulatory authorities, such as the EPA.
In April 2023, Ecore International purchased 360 Tire Recycling Group. Ecore International, which makes recycled rubber products in the U.S., has purchased 360 Tire Recycling Group to increase its sources of recyclable rubber tires and broaden its manufacturing capacity.
Europe Rubber Processing Chemicals Market Insights
Europe is expected to hold a significant market share during the forecast period owing to its long-established automotive, manufacturing, and construction sectors that require superior quality rubber products. A number of top tire and rubber product producers that use high-performance rubbers and rubbers to meet the toughest performance and durability specifications are located in the region. Additionally, the high-level emphasis on environmental regulations and sustainability in Europe has further induced innovations in sustainable and safer chemical formulations, driving the growth of the market. Moreover, the large number of chemical manufacturers and rampant investments in R&D have resulted in the presence of advanced rubber processing solutions, which are being made available by the rubber processing chemicals companies being made available.
Middle East & Africa and Latin America Rubber Processing Chemicals Market Insights
The Rubber Processing Chemicals Market in the Middle East & Africa and Latin America is witnessing steady growth, driven by expanding automotive, construction, and industrial sectors. Rising demand for high-performance rubber products, coupled with government initiatives supporting industrialization and infrastructure development, is boosting adoption. Increasing investments in manufacturing facilities and growing awareness of advanced chemical additives for enhanced durability, elasticity, and processing efficiency are further accelerating market expansion in these regions.

Get Customized Report as per Your Business Requirement - Enquiry Now
Rubber Processing Chemicals Market Competitive Landscape:
LANXESS AG Overview:
LANXESS AG is a leading specialty chemicals company headquartered in Germany, focusing on high-performance chemical products and additives for diverse industries, including automotive, construction, and rubber processing. The company specializes in producing innovative solutions such as polymer additives, high-performance plastics, and advanced intermediates. With a strong commitment to sustainability and technological advancement, LANXESS leverages research and development to deliver high-quality, efficient, and environmentally friendly chemical solutions that meet evolving global industrial demands.
-
In October 2023, LANXESS introduced new bio-based vulcanizing agents from plant oils. These agents are designed to enhance sustainability by reducing dependence on petrochemicals, addressing the growing demand for eco-friendly solutions in the rubber market.
Arkema S.A. Overview:
Arkema S.A., a French multinational specialty chemicals and advanced materials company, develops innovative chemical solutions for industries such as construction, automotive, electronics, and rubber processing. The company focuses on high-performance polymers, adhesives, coatings, and additives, with an emphasis on sustainability, efficiency, and technological innovation. Arkema combines global expertise with local operations to deliver products that improve performance, safety, and durability across a wide range of industrial applications.
-
In September 2023, Arkema cooperated with a major research institute to develop AI-driven predictive maintenance systems for rubber parts. This initiative aims to enhance performance and prevent failures by maximizing product durability and extending the lifespan of rubber components.
Key Players:
-
Eastman Chemical Company
-
Solvay S.A.
-
Arkema S.A.
-
BASF SE
-
Akzo Nobel N.V.
-
China Petroleum & Chemical Corporation (Sinopec)
-
Emerald Performance Materials LLC
-
Behn Meyer Group
-
Hexpol AB
-
Lanxess Rubber Additives
-
RTP Company
-
Cabot Corporation
-
Wacker Chemie AG
-
ChemChina
-
Nocil Ltd.
-
Lubrizol Corporation
-
Omnova Solutions Inc.
-
Flexsys Inc.
Report Attributes | Details |
---|---|
Market Size in 2024 | USD 6.14 Billion |
Market Size by 2032 | USD 8.89 Billion |
CAGR | CAGR of 4.72% From 2025 to 2032 |
Base Year | 2024 |
Forecast Period | 2025-2032 |
Historical Data | 2021-2023 |
Report Scope & Coverage | Market Size, Segments Analysis, Competitive Landscape, Regional Analysis, DROC & SWOT Analysis, Forecast Outlook |
Key Segments | •By Product (Anti-degradants, Accelerators, Flame Retardants, Processing Aid/Promoters, Others) •By Application (Tire, Non-Tire) |
Regional Analysis/Coverage | North America (US, Canada, Mexico), Europe (Germany, France, UK, Italy, Spain, Poland, Turkey, Rest of Europe), Asia Pacific (China, India, Japan, South Korea, Singapore, Australia, Rest of Asia Pacific), Middle East & Africa (UAE, Saudi Arabia, Qatar, South Africa, Rest of Middle East & Africa), Latin America (Brazil, Argentina, Rest of Latin America) |
Company Profiles | Lanxess AG, Eastman Chemical Company, Solvay S.A., Arkema S.A., BASF SE, Akzo Nobel N.V., China Petroleum & Chemical Corporation (Sinopec), Sumitomo Chemical Co., Ltd., Emerald Performance Materials LLC, Behn Meyer Group. |
Table Of Contents
1. Introduction
1.1 Market Definition & Scope
1.2 Research Assumptions & Abbreviations
1.3 Research Methodology
2. Executive Summary
2.1 Market Snapshot
2.2 Market Absolute $ Opportunity Assessment & Y-o-Y Analysis, 2021–2032
2.3 Market Size & Forecast, By Segmentation, 2021–2032
2.3.1 Market Size By Product
2.3.2 Market Size By Application
2.4 Market Share & Bps Analysis By Region, 2024
2.5 Industry Growth Scenarios – Conservative, Likely & Optimistic
2.6 Industry CxO’s Perspective
3. Market Overview
3.1 Market Dynamics
3.1.1 Drivers
3.1.2 Restraints
3.1.3 Opportunities
3.1.4 Key Market Trends
3.2 Industry PESTLE Analysis
3.3 Key Industry Forces (Porter’s) Impacting Market Growth
3.4 Industry Supply Chain Analysis
3.4.1 Raw Material Suppliers
3.4.2 Manufacturers
3.4.3 Distributors/Suppliers
3.4.4 Customers/End-Users
3.5 Industry Life Cycle Assessment
3.6 Parent Market Overview
3.7 Market Risk Assessment
4. Statistical Insights & Trends Reporting
4.1 Production & Manufacturing Metrics
4.1.1 Overview
4.1.2 % Share of In-House vs. Outsourced Production of Chemicals
4.1.3 Average Batch Size and Production Yield (%)
4.1.4 Manufacturing Cost per Kg by Chemical Type (USD)
4.1.5 Quality Compliance Rate (ISO, ASTM Standards)
4.2 Performance & Efficiency Metrics
4.2.1 Overview
4.2.2 Average Improvement in Rubber Tensile Strength or Durability per Chemical Type
4.2.3 % Reduction in Processing Time Using Advanced Chemicals
4.2.4 Rate of Defects or Product Failures Attributable to Chemical Quality (%)
4.2.5 Efficiency Metrics for Eco-Friendly Chemical Alternatives
4.3 Pricing & Cost Metrics
4.3.1 Overview
4.3.2 Average Price per Kg by Chemical Type (USD)
4.3.3 Cost Comparison Between Traditional and Specialty Chemicals
4.3.4 % Price Variation by Region or Supplier
4.3.5 Trend Analysis of Raw Material Costs Impact on Chemical Pricing
4.4 Regulatory & Compliance Metrics
4.4.1 Overview
4.4.2 % of Chemicals Compliant with Environmental and Safety Regulations
4.4.3 Regional Restrictions or Bans on Specific Chemicals
4.4.4 Average Time to Obtain Regulatory Approval for New Chemicals
4.4.5 % Adoption of REACH, OSHA, or Local Standards
5. Rubber Processing Chemicals Market Segmental Analysis & Forecast, By Product, 2021 – 2032, Value (Usd Billion)
5.1 Introduction
5.2 Anti-degradants
5.2.1 Key Trends
5.2.2 Market Size & Forecast, 2021 – 2032
5.3 Accelerators
5.4 Flame Retardants
5.5 Processing Aid/Promoters
5.6 Others
6. Rubber Processing Chemicals Market Segmental Analysis & Forecast, By Application, 2021 – 2032, Value (Usd Billion)
6.1 Introduction
6.2 Tire
6.2.1 Key Trends
6.2.2 Market Size & Forecast, 2021 – 2032
6.3 Non-Tire
7. Rubber Processing Chemicals Market Segmental Analysis & Forecast By Region, 2021 – 2025, Value (Usd Billion)
7.1 Introduction
7.2 North America
7.2.1 Key Trends
7.2.2 Rubber Processing Chemicals Market Size & Forecast, By Product, 2021 – 2032
7.2.3 Rubber Processing Chemicals Market Size & Forecast, By Application, 2021 – 2032
7.2.4 Rubber Processing Chemicals Market Size & Forecast, By Country, 2021 – 2032
7.2.4.1 USA
7.2.4.1.1 Rubber Processing Chemicals Market Size & Forecast, By Product, 2021 – 2032
7.2.4.1.2 Rubber Processing Chemicals Market Size & Forecast, By Application, 2021 – 2032
7.2.4.2 Canada
7.2.4.2.1 Rubber Processing Chemicals Market Size & Forecast, By Product, 2021 – 2032
7.2.4.2.2 Rubber Processing Chemicals Market Size & Forecast, By Application, 2021 – 2032
7.3 Europe
7.3.1 Key Trends
7.3.2 Rubber Processing Chemicals Market Size & Forecast, By Product, 2021 – 2032
7.3.3 Rubber Processing Chemicals Market Size & Forecast, By Application, 2021 – 2032
7.3.4 Rubber Processing Chemicals Market Size & Forecast, By Country, 2021 – 2032
7.3.4.1 Germany
7.3.4.1.1 Rubber Processing Chemicals Market Size & Forecast, By Product, 2021 – 2032
7.3.4.1.2 Rubber Processing Chemicals Market Size & Forecast, By Application, 2021 – 2032
7.3.4.2 UK
7.3.4.2.1 Rubber Processing Chemicals Market Size & Forecast, By Product, 2021 – 2032
7.3.4.2.2 Rubber Processing Chemicals Market Size & Forecast, By Application, 2021 – 2032
7.3.4.3 France
7.3.4.3.1 Rubber Processing Chemicals Market Size & Forecast, By Product, 2021 – 2032
7.3.4.3.2 Rubber Processing Chemicals Market Size & Forecast, By Application, 2021 – 2032
7.3.4.4 Italy
7.3.4.4.1 Rubber Processing Chemicals Market Size & Forecast, By Product, 2021 – 2032
7.3.4.4.2 Rubber Processing Chemicals Market Size & Forecast, By Application, 2021 – 2032
7.3.4.5 Spain
7.3.4.5.1 Rubber Processing Chemicals Market Size & Forecast, By Product, 2021 – 2032
7.3.4.5.2 Rubber Processing Chemicals Market Size & Forecast, By Application, 2021 – 2032
7.3.4.6 Russia
7.3.4.6.1 Rubber Processing Chemicals Market Size & Forecast, By Product, 2021 – 2032
7.3.4.6.2 Rubber Processing Chemicals Market Size & Forecast, By Application, 2021 – 2032
7.3.4.7 Poland
7.3.4.7.1 Rubber Processing Chemicals Market Size & Forecast, By Product, 2021 – 2032
7.3.4.7.2 Rubber Processing Chemicals Market Size & Forecast, By Application, 2021 – 2032
7.3.4.8 Rest of Europe
7.3.4.8.1 Rubber Processing Chemicals Market Size & Forecast, By Product, 2021 – 2032
7.3.4.8.2 Rubber Processing Chemicals Market Size & Forecast, By Application, 2021 – 2032
7.4 Asia-Pacific
7.4.1 Key Trends
7.4.2 Rubber Processing Chemicals Market Size & Forecast, By Product, 2021 – 2032
7.4.3 Rubber Processing Chemicals Market Size & Forecast, By Application, 2021 – 2032
7.4.4 Rubber Processing Chemicals Market Size & Forecast, By Country, 2021 – 2032
7.4.4.1 China
7.4.4.1.1 Rubber Processing Chemicals Market Size & Forecast, By Product, 2021 – 2032
7.4.4.1.2 Rubber Processing Chemicals Market Size & Forecast, By Application, 2021 – 2032
7.4.4.2 India
7.4.4.2.1 Rubber Processing Chemicals Market Size & Forecast, By Product, 2021 – 2032
7.4.4.2.2 Rubber Processing Chemicals Market Size & Forecast, By Application, 2021 – 2032
7.4.4.3 Japan
7.4.4.3.1 Rubber Processing Chemicals Market Size & Forecast, By Product, 2021 – 2032
7.4.4.3.2 Rubber Processing Chemicals Market Size & Forecast, By Application, 2021 – 2032
7.4.4.4 South Korea
7.4.4.4.1 Rubber Processing Chemicals Market Size & Forecast, By Product, 2021 – 2032
7.4.4.4.2 Rubber Processing Chemicals Market Size & Forecast, By Application, 2021 – 2032
7.4.4.5 Australia
7.4.4.5.1 Rubber Processing Chemicals Market Size & Forecast, By Product, 2021 – 2032
7.4.4.5.2 Rubber Processing Chemicals Market Size & Forecast, By Application, 2021 – 2032
7.4.4.6 ASEAN Countries
7.4.4.6.1 Rubber Processing Chemicals Market Size & Forecast, By Product, 2021 – 2032
7.4.4.6.2 Rubber Processing Chemicals Market Size & Forecast, By Application, 2021 – 2032
7.4.4.7 Rest of Asia-Pacific
7.4.4.7.1 Rubber Processing Chemicals Market Size & Forecast, By Product, 2021 – 2032
7.4.4.7.2 Rubber Processing Chemicals Market Size & Forecast, By Application, 2021 – 2032
7.5 Latin America
7.5.1 Key Trends
7.5.2 Rubber Processing Chemicals Market Size & Forecast, By Product, 2021 – 2032
7.5.3 Rubber Processing Chemicals Market Size & Forecast, By Application, 2021 – 2032
7.5.4 Rubber Processing Chemicals Market Size & Forecast, By Country, 2021 – 2032
7.5.4.1 Brazil
7.5.4.1.1 Rubber Processing Chemicals Market Size & Forecast, By Product, 2021 – 2032
7.5.4.1.2 Rubber Processing Chemicals Market Size & Forecast, By Application, 2021 – 2032
7.5.4.2 Argentina
7.5.4.2.1 Rubber Processing Chemicals Market Size & Forecast, By Product, 2021 – 2032
7.5.4.2.2 Rubber Processing Chemicals Market Size & Forecast, By Application, 2021 – 2032
7.5.4.3 Mexico
7.5.4.3.1 Rubber Processing Chemicals Market Size & Forecast, By Product, 2021 – 2032
7.5.4.3.2 Rubber Processing Chemicals Market Size & Forecast, By Application, 2021 – 2032
7.5.4.4 Colombia
7.5.4.4.1 Rubber Processing Chemicals Market Size & Forecast, By Product, 2021 – 2032
7.5.4.4.2 Rubber Processing Chemicals Market Size & Forecast, By Application, 2021 – 2032
7.5.4.5 Rest of Latin America
7.5.4.5.1 Rubber Processing Chemicals Market Size & Forecast, By Product, 2021 – 2032
7.5.4.5.2 Rubber Processing Chemicals Market Size & Forecast, By Application, 2021 – 2032
7.6 Middle East & Africa
7.6.1 Key Trends
7.6.2 Rubber Processing Chemicals Market Size & Forecast, By Product, 2021 – 2032
7.6.3 Rubber Processing Chemicals Market Size & Forecast, By Application, 2021 – 2032
7.6.4 Rubber Processing Chemicals Market Size & Forecast, By Country, 2021 – 2032
7.6.4.1 UAE
7.6.4.1.1 Rubber Processing Chemicals Market Size & Forecast, By Product, 2021 – 2032
7.6.4.1.2 Rubber Processing Chemicals Market Size & Forecast, By Application, 2021 – 2032
7.6.4.2 Saudi Arabia
7.6.4.2.1 Rubber Processing Chemicals Market Size & Forecast, By Product, 2021 – 2032
7.6.4.2.2 Rubber Processing Chemicals Market Size & Forecast, By Application, 2021 – 2032
7.6.4.3 Qatar
7.6.4.3.1 Rubber Processing Chemicals Market Size & Forecast, By Product, 2021 – 2032
7.6.4.3.2 Rubber Processing Chemicals Market Size & Forecast, By Application, 2021 – 2032
7.6.4.4 Egypt
7.6.4.4.1 Rubber Processing Chemicals Market Size & Forecast, By Product, 2021 – 2032
7.6.4.4.2 Rubber Processing Chemicals Market Size & Forecast, By Application, 2021 – 2032
7.6.4.5 South Africa
7.6.4.5.1 Rubber Processing Chemicals Market Size & Forecast, By Product, 2021 – 2032
7.6.4.5.2 Rubber Processing Chemicals Market Size & Forecast, By Application, 2021 – 2032
7.6.4.6 Rest of Middle East & Africa
7.6.4.6.1 Rubber Processing Chemicals Market Size & Forecast, By Product, 2021 – 2032
7.6.4.6.2 Rubber Processing Chemicals Market Size & Forecast, By Application, 2021 – 2032
8. Competitive Landscape
8.1 Key Players' Positioning
8.2 Competitive Developments
8.2.1 Key Strategies Adopted (%), By Key Players, 2024
8.2.2 Year-Wise Strategies & Development, 2021 – 2025
8.2.3 Number Of Strategies Adopted By Key Players, 2024
8.3 Market Share Analysis, 2024
8.4 Product/Service & Application Benchmarking
8.4.1 Product/Service Specifications & Features By Key Players
8.4.2 Product/Service Heatmap By Key Players
8.4.3 Application Heatmap By Key Players
8.5 Industry Start-Up & Innovation Landscape
8.6 Key Company Profiles
8.6.1 Lanxess AG
8.6.1.1 Company Overview & Snapshot
8.6.1.2 Product/Service Portfolio
8.6.1.3 Key Company Financials
8.6.1.4 SWOT Analysis
8.6.2 Eastman Chemical Company
8.6.3 Solvay S.A.
8.6.4 Arkema S.A.
8.6.5 BASF SE
8.6.6 Akzo Nobel N.V.
8.6.7 China Petroleum & Chemical Corporation (Sinopec)
8.6.8 Sumitomo Chemical Co., Ltd.
8.6.9 Emerald Performance Materials LLC
8.6.10 Behn Meyer Group
8.6.11 Hexpol AB
8.6.12 Lanxess Rubber Additives
8.6.13 RTP Company
8.6.14 Cabot Corporation
8.6.15 Wacker Chemie AG
8.6.16 ChemChina
8.6.17 Nocil Ltd.
8.6.18 Lubrizol Corporation
8.6.19 Omnova Solutions Inc.
8.6.20 Flexsys Inc.
9. Analyst Recommendations
9.1 SNS Insider Opportunity Map
9.2 Industry Low-Hanging Fruit Assessment
9.3 Market Entry & Growth Strategy
9.4 Analyst Viewpoint & Suggestions On Market Growth
10. Assumptions
11. Disclaimer
12. Appendix
12.1 List Of Tables
12.2 List Of Figures
Key Segments
By Product
-
Anti-degradants
-
Accelerators
-
Flame Retardants
-
Processing Aid/Promoters
-
Others
By Application
-
Tire
-
Non-Tire
Request for Segment Customization as per your Business Requirement: Segment Customization Request
Regional Coverage:
North America
-
US
-
Canada
-
Mexico
Europe
-
Germany
-
France
-
UK
-
Italy
-
Spain
-
Poland
-
Turkey
-
Rest of Europe
Asia Pacific
-
China
-
India
-
Japan
-
South Korea
-
Singapore
-
Australia
-
Rest of Asia Pacific
Middle East & Africa
-
UAE
-
Saudi Arabia
-
Qatar
-
South Africa
-
Rest of Middle East & Africa
Latin America
-
Brazil
-
Argentina
-
Rest of Latin America
Request for Country Level Research Report: Country Level Customization Request
Available Customization
With the given market data, SNS Insider offers customization as per the company’s specific needs. The following customization options are available for the report:
-
Detailed Volume Analysis
-
Criss-Cross segment analysis (e.g. Product X Application)
-
Competitive Product Benchmarking
-
Geographic Analysis
-
Additional countries in any of the regions
-
Customized Data Representation
-
Detailed analysis and profiling of additional market players
An accurate research report requires proper strategizing as well as implementation. There are multiple factors involved in the completion of good and accurate research report and selecting the best methodology to compete the research is the toughest part. Since the research reports we provide play a crucial role in any company’s decision-making process, therefore we at SNS Insider always believe that we should choose the best method which gives us results closer to reality. This allows us to reach at a stage wherein we can provide our clients best and accurate investment to output ratio.
Each report that we prepare takes a timeframe of 350-400 business hours for production. Starting from the selection of titles through a couple of in-depth brain storming session to the final QC process before uploading our titles on our website we dedicate around 350 working hours. The titles are selected based on their current market cap and the foreseen CAGR and growth.
The 5 steps process:
Step 1: Secondary Research:
Secondary Research or Desk Research is as the name suggests is a research process wherein, we collect data through the readily available information. In this process we use various paid and unpaid databases which our team has access to and gather data through the same. This includes examining of listed companies’ annual reports, Journals, SEC filling etc. Apart from this our team has access to various associations across the globe across different industries. Lastly, we have exchange relationships with various university as well as individual libraries.

Step 2: Primary Research
When we talk about primary research, it is a type of study in which the researchers collect relevant data samples directly, rather than relying on previously collected data. This type of research is focused on gaining content specific facts that can be sued to solve specific problems. Since the collected data is fresh and first hand therefore it makes the study more accurate and genuine.
We at SNS Insider have divided Primary Research into 2 parts.
Part 1 wherein we interview the KOLs of major players as well as the upcoming ones across various geographic regions. This allows us to have their view over the market scenario and acts as an important tool to come closer to the accurate market numbers. As many as 45 paid and unpaid primary interviews are taken from both the demand and supply side of the industry to make sure we land at an accurate judgement and analysis of the market.
This step involves the triangulation of data wherein our team analyses the interview transcripts, online survey responses and observation of on filed participants. The below mentioned chart should give a better understanding of the part 1 of the primary interview.

Part 2: In this part of primary research the data collected via secondary research and the part 1 of the primary research is validated with the interviews from individual consultants and subject matter experts.
Consultants are those set of people who have at least 12 years of experience and expertise within the industry whereas Subject Matter Experts are those with at least 15 years of experience behind their back within the same space. The data with the help of two main processes i.e., FGDs (Focused Group Discussions) and IDs (Individual Discussions). This gives us a 3rd party nonbiased primary view of the market scenario making it a more dependable one while collation of the data pointers.
Step 3: Data Bank Validation
Once all the information is collected via primary and secondary sources, we run that information for data validation. At our intelligence centre our research heads track a lot of information related to the market which includes the quarterly reports, the daily stock prices, and other relevant information. Our data bank server gets updated every fortnight and that is how the information which we collected using our primary and secondary information is revalidated in real time.

Step 4: QA/QC Process
After all the data collection and validation our team does a final level of quality check and quality assurance to get rid of any unwanted or undesired mistakes. This might include but not limited to getting rid of the any typos, duplication of numbers or missing of any important information. The people involved in this process include technical content writers, research heads and graphics people. Once this process is completed the title gets uploader on our platform for our clients to read it.
Step 5: Final QC/QA Process:
This is the last process and comes when the client has ordered the study. In this process a final QA/QC is done before the study is emailed to the client. Since we believe in giving our clients a good experience of our research studies, therefore, to make sure that we do not lack at our end in any way humanly possible we do a final round of quality check and then dispatch the study to the client.