Biomethane Market Report Scope & Overview:
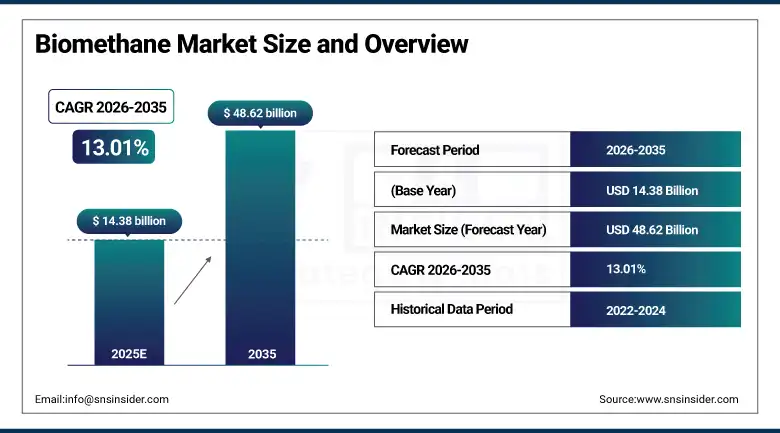
Biomethane Market was valued at USD 14.38 billion in 2025 and is expected to reach USD 48.62 billion by 2035, growing at a CAGR of 13.01% from 2026–2035.
The global biomethane market is witnessing an extraordinary structural acceleration, occurring right at the nexus of the two most important energy policy transformations today, the decarbonization of natural gas fuel chains and the most widely scalable waste-to-energy technology associated with the circular economy. Biomethane, alternatively called renewable natural gas, is the product of upgrading biogas which comes from anaerobic digestion of agricultural waste, municipal solid waste, sewage sludge, food processing wastes, and energy crops, resulting in production of a gas which contains methane of the same purity as the fossil natural gas but emits negligible carbon emissions if produced out of organic waste sources. The special drop-in quality of biomethane in relation to existing natural gas pipelines, gas-powered industry equipment, and compressed/liquefied gas-powered truck engines facilitates the decarbonization of sectors where decarbonization is not economically or technologically feasible such as heavy-goods vehicles, industrial heating, grid-peaking gas power plants, and home & commercial heating systems, all without replacing costly trillion dollar gas infrastructure investments which these sectors currently use.
The biomethane market's 13.01% CAGR from 2026 to 2035 reflects the structural convergence of deepening decarbonization imperatives across hard-to-electrify sectors. Veolia Group's March 2025 inauguration of its largest biomethane facility in Normandy with 25 GWh annual production capacity sourced from municipal waste, and Clean Energy Fuels Corp.'s.
Market Size and Forecast
-
Market Size in 2025: USD 14.38 Billion
-
Market Size by 2035: USD 48.62 Billion
-
CAGR: 13.01% from 2026 to 2035
-
Base Year: 2025
-
Forecast Period: 2026–2035
-
Historical Data: 2022–2024
To Get more information On Biomethane Market - Request Free Sample Report
Biomethane Market Trends
-
Accelerating integration of biomethane into national gas grids across Europe, with France, Germany, Denmark, and the Netherlands mandating renewable gas blending percentages that create guaranteed offtake volumes for biomethane producers and enable project financing at scales previously unattainable for standalone renewable gas facilities.
-
Rapid commercialization of bio-LNG for long-haul heavy goods vehicles, with major European and North American logistics operators including DHL, DB Schenker, and Amazon Logistics committing to fleet decarbonization programs that are creating large, predictable demand contracts underpinning new bio-LNG production facility investment across regional distribution hub locations.
-
Growing adoption of biomethane as a feedstock for green hydrogen production through steam methane reforming with carbon capture, offering a near-term pathway to low-carbon hydrogen production that leverages existing natural gas reforming infrastructure while achieving substantially lower lifecycle carbon intensity than fossil-derived blue hydrogen alternatives.
-
Expanding development of advanced anaerobic digestion technologies incorporating continuous stirred-tank reactor optimization, thermophilic digestion, and pre-treatment technologies that increase biogas yield from challenging feedstocks including lignocellulosic agricultural waste, food processing sludge, and mixed municipal solid waste, improving project economics across previously marginal feedstock categories.
-
Rising investment in membrane separation, pressure swing adsorption, and cryogenic upgrading technologies that are reducing the capital cost and energy consumption of biogas-to-biomethane upgrading by 20 to 35% compared to 2020 benchmarks, materially improving project return profiles and enabling smaller-scale distributed biomethane production facilities to achieve commercial viability.
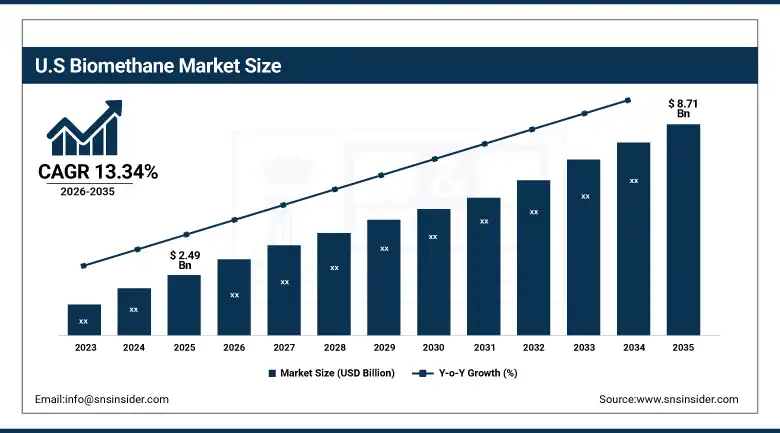
U.S. Biomethane Market was valued at approximately USD 2.49 billion in 2025 and is expected to reach USD 8.71 billion by 2035, growing at a CAGR of approximately 13.34%, driven by the Renewable Fuel Standard credit economics, the California Low Carbon Fuel Standard, and Clean Energy Fuels Corp.'s landmark commercial agreements establishing biomethane as the preferred decarbonization solution for U.S. heavy transport fleets.
The United States represents the world's second-largest and fastest-growing national biomethane market, anchored by a uniquely favorable policy economics framework where the combination of Renewable Fuel Standard D3 and D5 renewable identification number credits, California Low Carbon Fuel Standard credits, federal investment tax credits, and state-level renewable portfolio standard incentives creates a stacked credit revenue stack that often exceeds the wholesale gas commodity value of biomethane production, making U.S. anaerobic digestion RNG projects among the most financially attractive renewable energy investments available to institutional capital. The U.S. biomethane market is distinguished by its extraordinary feedstock diversity, drawing from the world's most productive agricultural sector generating vast volumes of livestock manure and crop residues, the largest municipal wastewater treatment infrastructure generating consistent sewage sludge volumes, and a food processing industry that produces high-energy-density organic waste streams ideally suited to co-digestion anaerobic digestion facilities.
In December 2024, Clean Energy Fuels Corp. finalized a long-term supply agreement with Amazon to deliver over 150 million gallons of renewable natural gas annually to Amazon's heavy-duty trucking operations across the United States the largest single corporate biomethane offtake commitment in U.S. history.
Biomethane Market Segment Insights
-
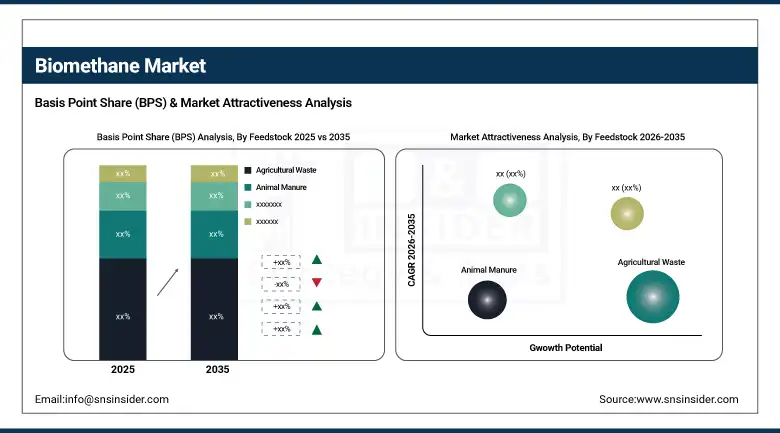
By Feedstock, Agricultural Waste dominated with approximately 32% revenue share in 2025; Sewage Sludge is expected to be the fastest-growing feedstock segment through 2026 to 2035.
-
By Production Method, Anaerobic Digestion held the highest revenue share of approximately 78% in 2025; Gasification is expected to grow at the fastest CAGR from 2026 to 2035.
-
By Application, Transportation (Vehicle Fuel) led with the highest revenue share in 2025; Injection into Natural Gas Grid is expected to grow at the fastest CAGR from 2026 to 2035.
-
By End-Use Industry, Transportation dominated in 2025; Industrial end-use is expected to grow at the fastest CAGR through 2026 to 2035.
Biomethane Market Segment Analysis
By Feedstock, Agricultural Waste dominates, Sewage Sludge expected to grow fastest
Agricultural waste maintained the leading position in the global Biomethane Market by feedstock in 2025, accounting for approximately 32% of total revenues, reflecting the extraordinary scale and consistency of the organic material streams generated by global agricultural operations that make this feedstock category the most reliable and widely distributed input for anaerobic digestion biomethane production. Agricultural feedstocks encompass livestock manure from intensive cattle, swine, and poultry operations that provide continuous year-round digester feedstock with predictable biogas yields, crop residues including maize stover, wheat straw, and rice husks that are available seasonally in quantities exceeding local digestibility capacity, and silage energy crops including dedicated energy maize and grass silage that deliver high methane yields per tonne of input material.
Sewage sludge is expected to emerge as the fastest-growing feedstock segment through 2026 to 2035, driven by the global expansion of municipal wastewater treatment infrastructure investment, particularly across rapidly urbanizing Asian and African cities that are extending centralized sewage treatment coverage to growing urban populations, and the progressive adoption of advanced anaerobic digestion as the preferred sludge management technology in both new and upgraded wastewater treatment plant designs. Sewage sludge offers particular advantages as a biomethane feedstock due to its continuous year-round availability from wastewater treatment operations, its high volatile solids content delivering consistent biogas yields, and the operational synergy between on-site anaerobic digestion and wastewater treatment facility energy self-sufficiency objectives that reduce municipal utility operating costs while generating marketable biomethane for grid injection or transport fuel use.
By Application, Transportation dominates, Grid Injection grows fastest
The Transportation application segment maintained the highest revenue share in the global Biomethane Market in 2025, anchored by the exceptionally strong policy economics and corporate sustainability demand for biomethane as a low-carbon compressed natural gas and liquefied natural gas transport fuel for heavy goods vehicles, public transit buses, refuse collection vehicles, and maritime vessels where battery electric propulsion is technically constrained by range, payload, or refueling time requirements that biomethane-powered natural gas engines can fully satisfy using existing CNG and LNG fueling infrastructure. The transportation biomethane segment benefits from the highest per-unit carbon credit revenue in the markets where renewable transport fuel mandate credit schemes operate, with U.S. Renewable Fuel Standard D3 credits and California LCFS credits generating financial incentives that make biomethane transport fuel production the most economically compelling biomethane application in those markets.
Injection into Natural Gas Grid is expected to grow at the fastest CAGR through 2026 to 2035, driven by the European Union's REPowerEU mandatory renewable gas blending targets for natural gas grid operators, the progressive development of biomethane grid injection infrastructure across France, Germany, the Netherlands, Italy, and Denmark, and the expanding corporate guarantee of origin certificate market that enables industrial and commercial gas consumers to purchase certified renewable gas through standard grid infrastructure without dedicated biomethane supply pipelines. Grid injection represents the most scalable biomethane application pathway, as it enables large-scale biomethane producers to access the entire connected market of gas consumers without requiring dedicated transport infrastructure or individual offtake agreements, while providing gas grid operators with the renewable gas volumes required to meet progressively tightening mandatory blending obligations.
Market Regional Analysis
|
Region |
Major Country |
Share within Region (%) |
|---|---|---|
|
North America |
United States |
~78% |
|
Europe |
Germany |
~33% |
|
Asia Pacific |
China |
~46% |
|
Middle East & Africa |
UAE |
~27% |
|
Latin America |
Brazil |
~48% |
North America Biomethane Market Insights
North America is the world's fastest-growing biomethane region, with the United States driving exceptional market expansion through the convergence of uniquely favorable Renewable Fuel Standard and Low Carbon Fuel Standard credit economics, growing corporate renewable gas procurement commitments from major logistics and manufacturing corporations, and the rapid deployment of new landfill gas-to-RNG, agricultural anaerobic digestion, and wastewater treatment biogas upgrading facilities across the country. The U.S. biomethane market benefits from the simultaneous availability of four complementary financial incentive streams — RFS credits, LCFS credits, federal clean energy tax credits, and state renewable portfolio standard incentives — that collectively create project economics substantially superior to those available in any other national market, attracting institutional capital from major oil companies including bp through Archaea Energy, Shell through Nature Energy's North American expansion, and TotalEnergies through its U.S. RNG portfolio development.
Get Customized Report as per Your Business Requirement - Enquiry Now
Europe Biomethane Market Insights
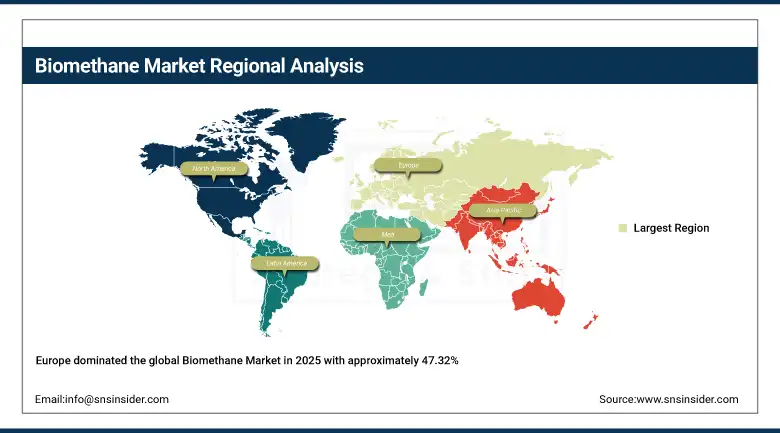
Europe dominated the global Biomethane Market in 2025 with approximately 47.32% of global revenues, led by the European Union's unparalleled biomethane policy framework, established production infrastructure, and the REPowerEU Action Plan's commitment to 35 billion cubic meters of domestic biomethane production by 2030 that is driving the most concentrated and well-capitalized biomethane project development pipeline in the world. Germany leads European biomethane production with over 230 grid-connected biomethane plants, supported by the Renewable Energy Sources Act feed-in tariff guarantees and the Bioenergy Action Plan's agricultural biomethane production incentives that have established Germany as the world's largest single national biomethane producer. France is executing the most ambitious biomethane grid injection programme globally, with the national 10% renewable gas grid target for 2030 driving rapid deployment of new anaerobic digestion facilities sourcing feedstock from agricultural operations, municipal organic waste, and food industry residues across all major French regions.
Asia Pacific Biomethane Market Insights
Asia-Pacific offers the highest growth opportunities in the global biomethane market over the forecast years from 2026 to 2035 due to growing biogas-to-biomethane policy initiatives in China according to the 14th Five-Year Plan on renewable energy, the National Biogas and Manure Management Program in India aiming to produce 10 billion cubic meters of biomethane annually using agricultural and municipal waste as feedstocks, and growing efforts towards biomethane imports and indigenous production in Japan and South Korea under their Green Growth Initiatives. China leads the world in terms of theoretical biomethane production potential using agricultural and animal wastes as feedstocks due to its intensive animal husbandry, with annual production of more than 900 million tonnes of animal waste being produced every year. The sustainable alternative towards affordable transportation scheme in India, which offers incentives to biogas producers using agricultural and municipal solid wastes as feedstocks, is fueling investment in biomethane production facilities in the major agricultural states in India, leading to significant additions to production capacity over the forecast years.
Middle East & Africa and Latin America Biomethane Market Insights
MEA and Latin America are emerging biomethane markets where abundant organic waste feedstocks, growing energy transition policy frameworks, and expanding renewable energy investment are beginning to catalyze initial commercial biomethane project development. The UAE leads MEA biomethane development through its ambitious circular economy agenda, with Abu Dhabi's Tadweer waste management authority developing organic waste-to-biomethane projects as part of the emirate's renewable energy and waste diversion strategy. South Africa's expanding agricultural sector and growing municipal organic waste management requirements are creating early-stage biomethane project development interest supported by South Africa's Renewable Energy Independent Power Producer Procurement Programme's emerging biogas category.
Biomethane Market Growth Drivers:
Escalating decarbonization mandates for natural gas supply chains and hard-to-electrify sectors creating structural biomethane demand across all major energy markets: The primary structural growth driver for the Biomethane Market is the global recognition by energy policy architects that the decarbonization of natural gas which supplies approximately 25% of global primary energy consumption and is deeply embedded in industrial process heat, residential heating, power generation peaking, and transport applications that cannot be fully electrified within the 2050 net-zero timelines of most major economies requires a credible renewable gas pathway that only biomethane currently provides at commercial scale and at pipeline-compatible quality specifications. The European Union's REPowerEU biomethane target of 35 billion cubic meters of domestic production by 2030, representing a sixfold increase from 2022 production levels, and the United States' Inflation Reduction Act clean fuel production credits creating substantial financial incentives for biomethane production facility investment, collectively represent the most consequential energy policy commitments to a single renewable energy technology in the 2024 to 2026 period.
Biomethane Market Restraints
Feedstock supply chain complexity, grid injection infrastructure limitations, and biogas upgrading capital intensity constraining market scaling velocity: A significant restraint on the Biomethane Market is the substantial infrastructure investment required across the entire biomethane value chain from organic waste collection and preprocessing logistics through anaerobic digestion or gasification production facilities, biogas upgrading equipment, gas quality verification systems, and grid injection or transport fuel distribution infrastructure that creates high capital requirements and extended development timelines for new production projects that constrain the pace at which market scaling can respond to demand growth signals. The geographic mismatch between optimal feedstock concentration locations in agricultural and rural areas and the natural gas grid infrastructure required for biomethane injection creates connectivity challenges in regions where distribution grid extensions to connect new anaerobic digestion facilities may require capital investments that significantly extend project payback periods.
Biomethane Market Opportunities
Green hydrogen production via biomethane reforming, bio-LNG maritime fuel, and carbon removal certification through biomethane with carbon capture: The most transformative near-term value creation opportunity in the biomethane market is the use of biomethane as a feedstock for low-carbon green hydrogen production through steam methane reforming with carbon capture and storage, which delivers hydrogen with lifecycle carbon intensity substantially below that of electrolytic green hydrogen at current electrolyzer cost levels while leveraging existing natural gas reforming infrastructure and established hydrogen distribution systems. This biomethane-to-hydrogen pathway offers a commercially competitive route to achieving the hydrogen production volumes required by the EU Hydrogen Strategy and U.S. National Clean Hydrogen Strategy without waiting for the further electrolyzer cost reductions and renewable electricity expansion required to make large-scale green electrolytic hydrogen economically viable. The maritime shipping sector's decarbonization requirements under International Maritime Organization greenhouse gas strategy mandates represent a substantial and growing demand opportunity for bio-LNG as a ship fuel that can be used in dual-fuel LNG engines already deployed across a growing portion of the global newbuild vessel orderbook, with major shipping companies including Maersk, CMA CGM, and Hapag-Lloyd all committing to bio-LNG fuel procurement as a near-term decarbonization pathway.
Recent Developments:
-
March 2025: Veolia Group launched the largest biomethane production unit built by the company in Normandy, France, with an annual biomethane production capacity of 25 GWh from municipal solid waste biomass. The installation is aligned to fulfill France’s goal of generating 10% renewable gas in the national gas network by 2030 and is also serving as a benchmark for biomethane produced from municipal waste at industrial scale.
-
December 2024: Clean Energy Fuels Corp. entered into a record-breaking long-term RNG supply agreement with Amazon to provide more than 150 million gallons of RNG derived from biomethane on an annual basis to power Amazon’s heavy duty truck fleet in America. This deal between Clean Energy Fuels and Amazon can be considered as one of the largest biomethane offtake deals recorded to date in global markets.
Biomethane Market Key Players
-
Engie S.A.
-
Air Liquide S.A.
-
Gasum Oy
-
EnviTec Biogas AG
-
Future Biogas Ltd.
-
Waga Energy S.A.
-
PlanET Biogas Group GmbH
-
Clean Energy Fuels Corp.
-
Bright Biomethane B.V.
-
Xebec Adsorption Inc.
-
Veolia Environnement S.A.
-
Greenlane Renewables Inc.
-
Archaea Energy (bp)
-
Hitachi Zosen Inova AG
-
Axiom Energy Group
-
Pentair plc
-
Verbio Vereinigte BioEnergie AG
-
TotalEnergies SE
-
Nature Energy Biogas A/S (Shell)
-
Biogest GmbH
Biomethane Market Report Scope:
| Report Attributes | Details |
|---|---|
| Market Size in 2025 | USD 14.38 Billion |
| Market Size by 2035 | USD 48.62 Billion |
| CAGR | CAGR of 13.01% From 2026 to 2035 |
| Base Year | 2025 |
| Forecast Period | 2026-2035 |
| Historical Data | 2022-2024 |
| Report Scope & Coverage | Market Size, Segments Analysis, Competitive Landscape, Regional Analysis, DROC & SWOT Analysis, Forecast Outlook |
| Key Segments | •By Feedstock (Organic Household Waste, Agricultural Waste, Industrial Food Processing Waste, Animal Manure, Energy Crops, Sewage Sludge, Others) •By Production Method (Anaerobic Digestion, Gasification, Others) •By Application (Automotive/Vehicle Fuel, Power Generation, Heating, Injection into Natural Gas Grid, Others) •By End-Use Industry (Residential, Commercial, Industrial, Transportation, Utilities) |
| Regional Analysis/Coverage | North America (US, Canada), Europe (Germany, UK, France, Italy, Spain, Russia, Poland, Rest of Europe), Asia Pacific (China, India, Japan, South Korea, Australia, ASEAN Countries, Rest of Asia Pacific), Middle East & Africa (UAE, Saudi Arabia, Qatar, South Africa, Rest of Middle East & Africa), Latin America (Brazil, Argentina, Mexico, Colombia, Rest of Latin America). |
| Company Profiles | Engie S.A., Air Liquide S.A., Gasum Oy, EnviTec Biogas AG, Future Biogas Ltd., Waga Energy S.A., PlanET Biogas Group GmbH, Clean Energy Fuels Corp., Bright Biomethane B.V., Xebec Adsorption Inc., Veolia Environnement S.A., Greenlane Renewables Inc., Archaea Energy (bp), Hitachi Zosen Inova AG, Axiom Energy Group, Pentair plc, Verbio Vereinigte BioEnergie AG, TotalEnergies SE, Nature Energy Biogas A/S (Shell), Biogest GmbH |
Frequently Asked Questions
Europe dominated the Biomethane Market in 2025 with approximately 47.32% of global revenues, led by Germany's extensive grid-connected biomethane plant network, France's ambitious national renewable gas grid injection programme, Denmark's large-scale agricultural co-digestion biomethane production under Nature Energy's Shell-owned platform, and the European Union's REPowerEU policy framework mandating 35 billion cubic meters of domestic biomethane production by 2030.
Anaerobic Digestion dominated the market in 2025 with approximately 78% of revenues, reflecting its status as the commercially proven and most widely deployed biomethane production technology, with decades of operational experience across European, North American, and Asian markets providing the engineering confidence and financing track record required for large-scale project development.
Agricultural Waste dominated the market in 2025 with approximately 32% of revenues, driven by the large and continuous supply of crop straw, livestock manure, and biodegradable agricultural residues that provide the most reliable and widely distributed feedstock base for anaerobic digestion biomethane production across all major agricultural regions globally.
The Biomethane Market was valued at USD 14.38 billion in 2025.
The Biomethane Market is expected to grow at a CAGR of 13.01% from 2026 to 2035.
Get in Touch
