Biophotonics Market Size & Growth:
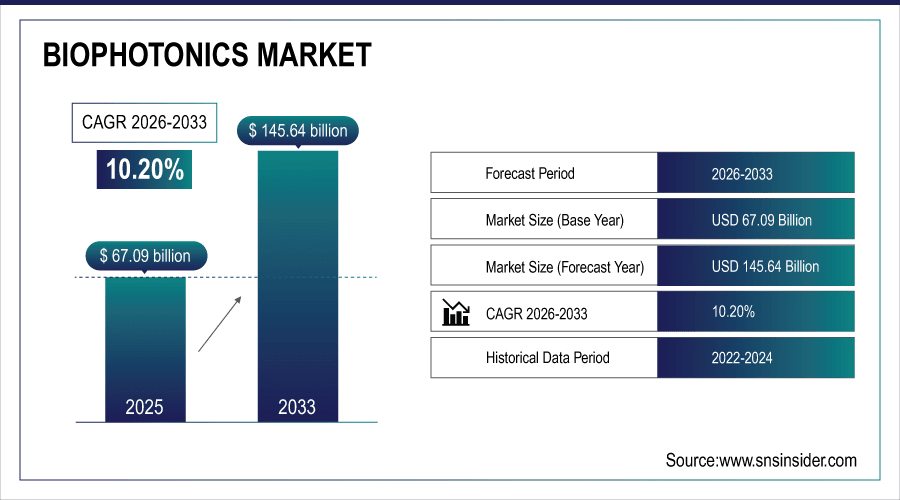
The Biophotonics Market size was valued at USD 67.09 Billion in 2025 and is projected to reach USD 177.20 Billion by 2035, growing at a CAGR of 10.20% during 2026-2035.
Increase in Demand for Advanced Diagnostic Imaging Technologies in the Healthcare Industry Rising incidences of chronic diseases is expected to upsurge demand for biophotonics for faster and correct diagnosis. Newer technologies, such as less invasive imaging technology and laser-related treatments, are improving treatment results. Increased investment in R&D and supportive government initiatives for photonics research also drives the market growth. Given the ample applications in the life sciences, medical diagnostics, and biotechnology segment, its long-term prospects appear to be robust.
Minimally invasive biophotonic procedures reduce hospital stays by 30–50% and cut complication rates by ~40% vs. traditional surgery.
To Get More Information On Biophotonics Market - Request Free Sample Report
Market Size and Forecast:
-
Market Size in 2025: USD 67.09 Billion
-
Market Size by 2035: USD 177.20 Billion
-
CAGR: 10.20% from 2026 to 2035
-
Base Year: 2025
-
Forecast Period: 2026–2035
-
Historical Data: 2022–2024
Biophotonics Market Trends
-
Biophotonics adoption accelerates as healthcare shifts toward precision medicine, enabling early disease detection and personalized treatments.
-
Rising demand for biophotonic-enabled minimally invasive diagnostic and therapeutic procedures improves patient outcomes and clinical efficiency.
-
Continuous global R&D investments enhance imaging, spectroscopy, and laser technologies, driving higher accuracy, affordability, and reliability.
-
Biophotonics adoption grows in agriculture, biotechnology, and environmental sciences, diversifying applications beyond traditional medical and clinical domains.
-
Supportive policies, photonics research funding, and integration with digital healthcare platforms boost biophotonics adoption and scalability worldwide.
The U.S. Biophotonics Market size was valued at USD 17.88 Billion in 2025 and is projected to reach USD 45.79 Billion by 2035, growing at a CAGR of 9.86% during 2026-2035.
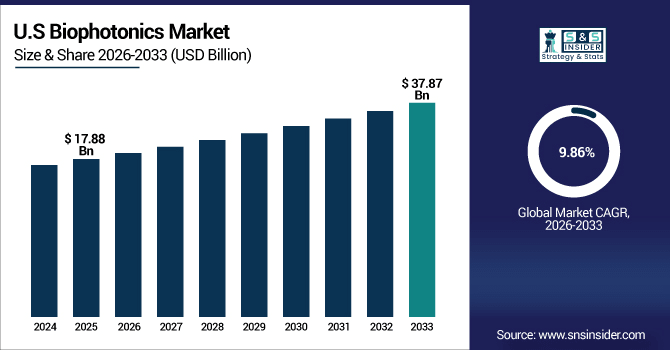
The Biophotonics Market is driven by the growing adoption of advanced imaging and diagnostic technologies in healthcare. With the increasing prevalence of chronic conditions like cancer and cardiovascular disease, this is increasing the demand for non-invasive solutions. A significant amount of innovation is fueled by public and private sector investments in R&D. This country has a well-developed healthcare system that contributes to a faster adoption of biophotonics in clinical and research applications. An increasing attention to personalized medicine and precision diagnostics lends even further momentum to the use of liquid biopsy. Furthermore, this synergy between universities, biotech, and medical device companies helps to fortify the U.S. market position.
Biophotonics Market Growth Drivers:
-
Rising demand for non-invasive diagnostics and imaging technologies fuels rapid growth in biophotonics solutions.
Rise in the incidence of chronic diseases is propelling the adoption of biophotonics in healthcare diagnostics, and increasing resonates of precision medicine are likely to increase the demand for advanced imaging and detection technologies, thus providing a push to biophotonics market. Ongoing R&D is enhancing performance, increasing precision, and driving down prices of biophotonic tools [3]. Simultaneously, biophotonics integration in personalized medicine and clinical applications is propelling the penetration of biophotonics market, in addition, the long-term growth of the market over the forecast period is reinforcing by government support for photonics research.
Point-of-care biophotonic devices (e.g., smartphone-based fluorescence readers) projected to grow 42% in 2024, especially in emerging markets.
Biophotonics Market Restraints:
-
High cost of biophotonics devices and complex regulatory approvals restrict widespread adoption globally.
High procurement and maintenance costs due to precision and advanced technology of biophotonics equipment and limited affordability in developing regions are hampering the growth of biophotonics market even when the need for analyzing these signifies through clearly as significant in treatment of variable healthcare pheno-types. In addition, lengthy approval process for medical devices, which delays commercialization time lines, and a shortage of skilled professionals, causing operational difficulties to manage advanced instruments, is creating barriers to the growth of the market on this front. Contributing to this are the aforementioned factors, which jointly act as a roadblock to rapid growth of the biophotonics market.
Biophotonics Market Opportunities:
-
Expanding applications in personalized medicine and life sciences create significant growth avenues for biophotonics.
The global transition towards precision healthcare is supported by biophotonics which helps in early disease diagnosis and targeted treatment. Minimally invasive procedures are expanding its applications in diagnostics and therapeutics, advancements in imaging, spectroscopy, and laser technologies spurred by rising R&D investments are improving their performance. Apart from healthcare, adoption in agriculture and biotech is unlocking potential new non-medical applications, and smart healthcare projects together with increasing digitalization are driving additional prospects for biophotonics market in future.
In biotech, biophotonics drives >40% of high-throughput screening systems for drug discovery — market value of 6.2B in 2024.
Biophotonics Market Segment Analysis
-
By Product: In 2025, lasers are projected to lead the biophotonics market with 40.21% share, while imaging systems will be the fastest growing segment with a CAGR of 10.76%.
-
By Application: Biological sensing & process applications are expected to dominate the market with a 39.21% share in 2025, whereas live cell imaging will grow at the fastest pace, recording a CAGR of 10.91%.
-
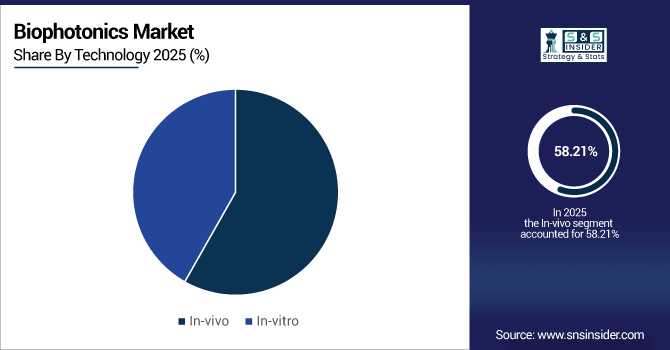
By Technology: In 2025, in-vivo technology will account for the majority share at 58.21%, while in-vitro technology is anticipated to grow the fastest with a CAGR of 10.49%.
-
By End-User: Medical diagnostics are forecasted to hold the largest share of 55.27% in 2025, while medical therapeutics will register the fastest growth with a CAGR of 10.70%.
By Technology, In-vivo Lead While In-vitro Registers Fastest Growth
The share of in-vivo technology for biophotonics is expected to be the largest at 58.21% in 2025E as it facilitates the real-time, non-invasive monitoring of internal processes inside a living organism. Applications range from diagnostics to therapeutic guidance and advanced imaging. On the other hand, in-vitro technology is recognized as the fastest-growing segment with a CAGR of 10.49%. This is due to the fact that, it is been used for analysis and research purpose in laboratory setting. Dominance and rapid growth together highlight the complementary nature of both technologies in health and research.
By Products, Lasers Leads Market While Imaging Systems Registers Fastest Growth
Lasers are the leading segment of the biophotonics market in 2025E with the dominance of 40.21% due to their extensive use in imaging, diagnostics, and therapeutic applications. They are widely used due to their accuracy and efficiency in every sector of healthcare and life sciences. Imaging systems however are experiencing the highest momentum in the market. These systems are anticipated to achieve a CAGR of 10.76% thanks to the improvement of systems such as high resolution imaging and real-time monitoring. This growth also reflects a trend towards increasingly accurate and less invasive forms of diagnosis.
By Application, Biological sensing & process Dominate While Live Cell Imaging Shows Rapid Growth
In 2025 by biological sensing & process is dominated applications, contributing 39.21% share, largely because of their critical role in disease detection, biosensing, and cellular analysis. The increasing prevalence of chronic and infectious diseases further boosts demand in this segment. Live cell imaging, however, is the standout in terms of growth. With a rapid CAGR of 10.91%, it is expanding quickly due to its importance in drug discovery and cell biology research. This demonstrates the growing reliance on advanced imaging in biomedical studies.
By End-User, Medical Diagnostics Lead While Medical Therapeutics Grow Fastest
Medical diagnostics hold the largest share of 55.27% in 2025, reflecting the rising use of biophotonics in early disease detection, imaging, and personalized medicine. The growing burden of chronic illnesses and demand for accurate diagnostics have cemented this segment’s leadership. At the same time, medical therapeutics is positioned as the fastest-growing end-user category. With a projected CAGR of 10.70%, it benefits from the growing adoption of photonic-based treatment methods such as laser therapies. Together, these end-user dynamics highlight biophotonics’ role in both prevention and treatment.
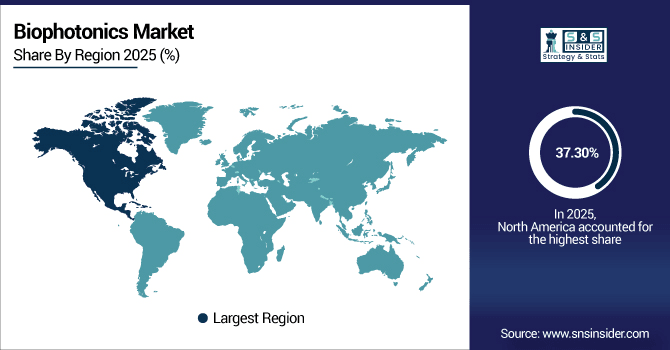
North America Biophotonics Market Insights
In 2025 North America dominated the Biophotonics Market and accounted for 37.30% of revenue share, this leadership is due to technological leadership and advanced infrastructure. High R&D spending and government support drive continuous innovation. Adoption in precision medicine and personalized healthcare is robust. Presence of major industry players accelerates commercialization of new technologies. Strong academic research institutions further enhance market growth.
Get Customized Report as Per Your Business Requirement - Enquiry Now
U.S. Biophotonics Market Insights
The U.S. dominates the North American biophotonics market. Strong healthcare infrastructure and funding drive adoption of advanced imaging. Widespread use in oncology, neurology, and ophthalmology boosts demand. A high concentration of biophotonics companies encourages innovation and product launches. Regulatory frameworks support safe commercialization and clinical integration.
Asia-pacific Biophotonics Market Insights
By 2026-2035 Asia-pacific is predicted to grow the fastest in the Biophotonics Market by 10.85% growing in a canvass of expanding healthcare infrastructure, and government investments. Increasing penetration of advanced diagnostics and imaging due to increasing demand from customer end-users. Growing emphasis on accuracy medicine and lifetime sciences R&D [Research and development] stimulates the use. In addition, the booming biotechnology and pharmaceutical sectors add to the total. Countries such as Japan, India, and South Korea have made strong advances to create growth in this area
China Biophotonics Market Insights
China holds a central position in the Asia-Pacific biophotonics market. Rapid urbanization and population growth increase healthcare demand. Government support for innovation and R&D in medical devices fuels market development. Adoption of biophotonic solutions in cancer detection and chronic disease management is rising.
Europe Biophotonics Market Insights
In 2025, Europe’s biophotonics market benefits from supportive regulations and rising demand for minimally invasive diagnostics. Countries across the region are investing in healthcare modernization. Academic and clinical research collaborations enhance biophotonics applications. Integration into precision medicine initiatives supports market penetration. Growing awareness about advanced diagnostics strengthens adoption.
Germany Biophotonics Market Insights
Germany leads the European biophotonics landscape. Its advanced healthcare infrastructure supports high adoption levels. Strong presence of medical device manufacturers fuels innovation. Significant investments in research and clinical trials expand applications.
Latin America (LATAM) and Middle East & Africa (MEA) Biophotonics Market Insights
The Biophotonics Market is experiencing moderate growth in the Latin America (LATAM) and Middle East & Africa (MEA) regions, due to the improving healthcare infrastructure supports gradual adoption. Rising awareness of early diagnostics encourages uptake of biophotonic tools. Cost-effective solutions attract demand in resource-constrained regions. Government and private sector collaborations are opening new opportunities.
Biophotonics Market Competitive Landscape:
Hamamatsu Photonics is a global leader in photonics technology, offering advanced imaging, spectroscopy, and light detection solutions. The company plays a crucial role in biophotonics with its high-sensitivity sensors and imaging systems. Its innovations support applications in cancer detection, neurology, and life sciences research. Continuous R&D investments strengthen its position in healthcare and diagnostics.
-
In August 2025, Hamamatsu Photonics was selected for Japan’s NEDO project to advance quantum computing industrialization, developing ultra-high-speed and high-sensitivity cameras, and spatial light modulators.
Olympus Corporation is a key player in medical imaging and biophotonics technologies. The company provides endoscopes, microscopes, and imaging systems widely used in diagnostics and minimally invasive procedures. Its biophotonics solutions are central to precision medicine and early disease detection. Strong global presence and clinical partnerships drive its market growth.
-
In July 2025, Olympus entered a strategic partnership with Revival Healthcare Capital, co-founding Swan EndoSurgical with an initial investment of at least USD 65 million to develop endoluminal robotic systems for minimally invasive gastrointestinal procedures.
Affymetrix, now part of Thermo Fisher Scientific, is recognized for its expertise in genomics and molecular diagnostics. Its biophotonics-enabled microarray and imaging platforms support research in personalized medicine and biotechnology. The company focuses on improving diagnostic accuracy and life sciences research efficiency. Integration with Thermo Fisher’s portfolio enhances its global impact.
-
In June 2025, Thermo Fisher Scientific launched a new Microarray Pharmacogenomics Research Programme at the European Society of Human Genetics (ESHG) conference. This initiative aims to advance the understanding of genetic variations influencing drug response, thereby supporting the development of personalized therapeutic strategies.
Zeiss is a leader in optical systems and biophotonics applications, particularly in microscopy and medical imaging. Its advanced imaging platforms enable breakthroughs in cell biology, oncology, and neurology research. The company invests heavily in innovation for high-resolution and 3D imaging solutions. Strong collaborations with academic and clinical institutions expand its influence in healthcare.
-
In April 2025, Zeiss introduced the AI-powered ZEISS Research Data Platform for ophthalmic research, enabling seamless integration of clinical and research data to accelerate discoveries.
Key Biophotonics Companies are:
-
Olympus Corporation
-
Affymetrix (Thermo Fisher Scientific)
-
Zeiss
-
Zecotek Photonics Inc.
-
BD (Becton, Dickinson, and Company)
-
Lumenis Ltd.
-
Bio-Rad Laboratories, Inc.
-
Shimadzu Corporation
-
Carl Zeiss AG
-
Danaher Corporation
-
Thermo Fisher Scientific Inc.
-
Oxford Instruments plc
-
IPG Photonics Corporation
-
Nikon Corporation
-
Canon Inc.
-
Bruker Corporation
-
LUMICKS
-
Thorlabs, Inc.
| Report Attributes | Details |
|---|---|
| Market Size in 2025 | USD 67.09 Billion |
| Market Size by 2035 | USD 177.20 Billion |
| CAGR | CAGR of 10.20% From 2026 to 2035 |
| Base Year | 2025 |
| Forecast Period | 2026-2035 |
| Historical Data | 2022-2024 |
| Report Scope & Coverage | Market Size, Segments Analysis, Competitive Landscape, Regional Analysis, DROC & SWOT Analysis, Forecast Outlook |
| Key Segments | • By Products (Imaging Systems, Lasers, Fiber Optics, Others) • By Application (Biological sensing & process, Live Cell Imaging, Optical Sensing & Detection, Photosynthesis Evaluation, and others) • By Technology (In-vivo and In-vitro) • By End-Use (Medical Therapeutics, Medical Diagnostics, and Others) |
| Regional Analysis/Coverage | North America (US, Canada), Europe (Germany, UK, France, Italy, Spain, Russia, Poland, Rest of Europe), Asia Pacific (China, India, Japan, South Korea, Australia, ASEAN Countries, Rest of Asia Pacific), Middle East & Africa (UAE, Saudi Arabia, Qatar, South Africa, Rest of Middle East & Africa), Latin America (Brazil, Argentina, Mexico, Colombia, Rest of Latin America). |
| Company Profiles | Hamamatsu Photonics, Olympus Corporation, Affymetrix (Thermo Fisher Scientific), Zeiss, Zecotek Photonics Inc., BD (Becton, Dickinson, and Company), PerkinElmer Inc., Lumenis Ltd., Bio-Rad Laboratories, Inc., Shimadzu Corporation, Carl Zeiss AG, Danaher Corporation, Thermo Fisher Scientific Inc., Oxford Instruments plc, IPG Photonics Corporation, Nikon Corporation, Canon Inc., Bruker Corporation, LUMICKS, Thorlabs, Inc. |
Frequently Asked Questions
North America dominated the Biophotonics Market in 2025.
The Lasers segment dominated during the projected period.
Growth is driven by rising demand for advanced, non-invasive diagnostic and therapeutic healthcare solutions.
The market was valued at USD 67.09 Billion in 2025 and is projected to reach USD 177.20 Billion by 2035.
The Biophotonics Market is expected to grow at a CAGR of 10.20% during 2026–2035.
Get in Touch
