Bleeding Disorders Treatment Market Size & Overview:

Bleeding Disorders Treatment Market Revenue Analysis

To get more information on Bleeding Disorders Treatment Market - Request Free Sample Report

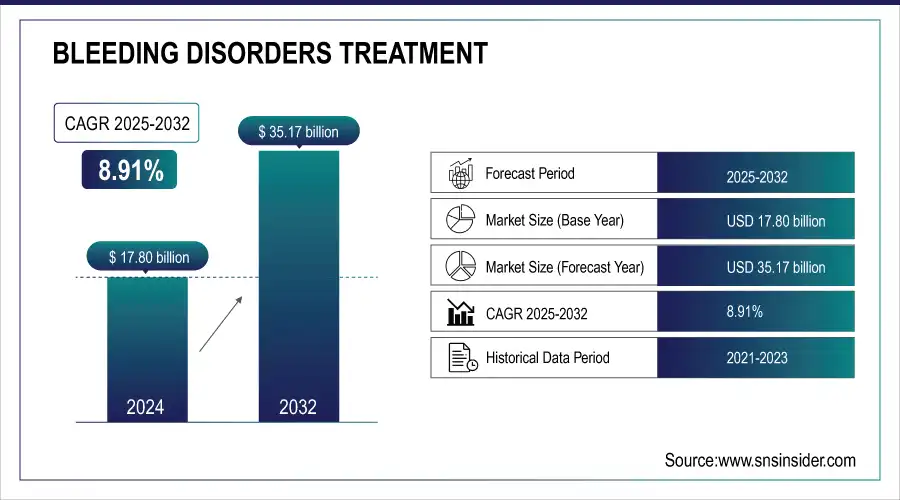
The Bleeding Disorders Treatment Market Size was USD 17.80 Bn in 2024 and is projected to reach USD 35.17 Bn by 2032, growing at 8.91% CAGR.

The Bleeding Disorders Treatment Market is growing enormously because of the increasing incidence of bleeding disorders such as hemophilia, Von Willebrand disease (vWD), and other rare clotting disorders. Hemophilia, primarily Hemophilia A and B, is the most common, with an estimated incidence of about 1 in 5,000 male births worldwide. This has driven the demand for advanced therapies to improve the quality of life of patients and decrease the risks associated with bleeding events.

In the past few years, gene therapy and recombinant proteins have changed the landscape of treatment. For example, CSL announced the three-year results from the HOPE-B study for etranacogene dezaparvovec-drlb, a gene therapy for Hemophilia B that has confirmed long-term safety and efficacy post one-time infusion in December 2023. Similarly, Takeda's ADAMTS13, recombinant-krhn was approved by the U.S. FDA in November 2023 approved it as the treatment for congenital thrombotic thrombocytopenic purpura or cTTP. That's a milestone in treating rare blood disorders.

Additionally, Novo Nordisk has been in the lead with Mim8, a potential once-weekly or monthly prophylactic treatment for hemophilia A, while concizumab (another treatment from Novo Nordisk) has been recommended by the EMA for approval as a once-daily subcutaneous prophylactic treatment for hemophilia A or B with inhibitors, which could change the management of these conditions.

The surge in biopharmaceutical innovations, including recombinant coagulation factors, gene therapies, and enzyme replacement therapies supports the growth in this market. Moreover, new clinical trials and research regarding new therapies for common and rare bleeding disorders are also projected to drive growth in this market over the next years​

Key Bleeding Disorders Treatment Market Trends:

  • High prevalence of Hemophilia A, Hemophilia B, and Von Willebrand Disease increasing the need for specialized treatment.

  • Rising patient population creating significant demand for advanced and convenient therapies.

  • Recent approvals of innovative gene therapies like etranacogene dezaparvovec-drlb transforming treatment approaches.

  • Clinical evidence, such as the HOPE-B study, confirming long-term efficacy and safety of new therapies.

  • Adoption of recombinant factor concentrates improving treatment effectiveness and patient quality of life.

Bleeding Disorders Treatment Market Growth Drivers:

  • The increase in the world prevalence of bleeding disorders, especially hemophilia, represents a principal driver of the bleeding disorders treatment market.

Hemophilia A accounts for about 80% of all cases of hemophilia. It afflicts 1 in every 5,000 males born worldwide, and Hemophilia B affects 1 in every 25,000 males. The patients have led to a greatly increased number of patients needing specialized treatment. Moreover, diseases such as Von Willebrand Disease (vWD), which is the most common hereditary bleeding disorder, have a prevalence of about 1 in 1,000 individuals around the world thereby further increasing the markets' potential. With growing patient numbers, there is a significant demand for better and easier treatments to address these lifetime conditions.

  • Advances in gene therapy and recombinant therapies are increasingly driving the growth of this market in bleeding disorders.

Recent approvals, such as etranacogene dezaparvovec-drlb for Hemophilia B, with long-term efficacy from a single infusion, are revolutionizing treatment choices. For instance, the HOPE-B study, which in December 2023 confirmed the durability and safety of this gene therapy, exemplifies the potential for gene therapy to replace regular infusions and reduce bleeding episodes in hemophilia patients. Similarly, recombinant factor concentrates have enabled more effective treatment of bleeding disorders, helping prevent spontaneous bleeding and improve the quality of life for patients. Such innovations are expected to result in long-term growth in the market.

Market players driving the growth of the Bleeding Disorders Treatment Market through gene therapy and recombinant therapies:

Company Key Therapy Focus Area Recent Developments

CSL Behring

Etranacogene dezaparvovec-drlb (Gene Therapy for Hemophilia B)

Gene therapy for Hemophilia B

The HOPE-B study (December 2023) confirmed long-term durability and safety with a one-time infusion.

Takeda

ADAMTS13, recombinant-krhn (Recombinant Enzyme Replacement Therapy)

Treatment for Congenital Thrombotic Thrombocytopenic Purpura (cTTP)

FDA approval in November 2023 for the first recombinant enzyme replacement therapy for cTTP.

Novo Nordisk

Mim8 (Recombinant Therapy for Hemophilia A)

Prophylactic treatment for Hemophilia A

Positive phase 3 results for once-weekly and once-monthly dosing (June 2024).


Concizumab (Recombinant Therapy for Hemophilia A or B with inhibitors)

Prophylactic treatment for Hemophilia A and B with inhibitors

EMA recommendation for approval (October 2024), a once-daily subcutaneous therapy for patients with inhibitors.

Bleeding Disorders Treatment Market Restraints:

  • Limited Patient Population Hindering Market Growth of Bleeding Disorders Treatment

One of the biggest challenges facing the treatment market for bleeding disorders is the low number of patients for certain rare conditions, such as congenital thrombotic thrombocytopenic purpura (cTTP) and specific subtypes of Von Willebrand Disease (vWD). Such conditions are very rare; cTTP, for example, affects only 1 in a million. The low number of patients puts a cap on the demand for specialized therapies, hence diminishing the incentive for companies to invest heavily in research and development. This results in slow treatment adoption and market growth.​

Bleeding Disorders Treatment Market Segment Analysis:
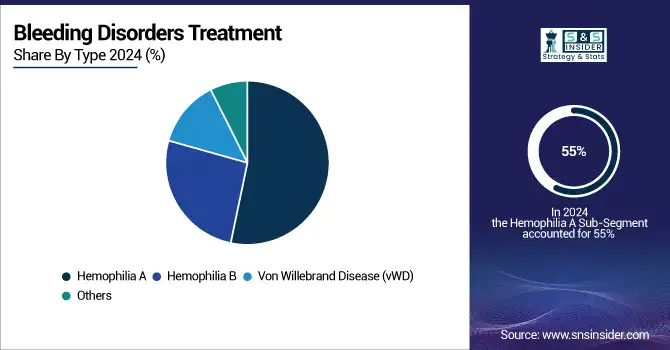
By Type

Hemophilia A segment dominated the bleeding disorders market with a market share of 55% in 2023. This is because Hemophilia A accounts for the majority at 80% of hemophilia cases globally. With an estimated figure of 1 in 5,000 male births affected, it drives a significant portion of the demand for treatments for bleeding disorders. Still ongoing are the advancements within recombinant therapies, including gene therapies specifically targeted toward Hemophilia A.

Von Willebrand Disease is the fastest-growing segment in this market with the highest CAGR during the forecast period. vWD is the most common inherited bleeding disorder, affecting about 1 in 1,000 people worldwide. Its growth is driven by increased diagnosis rates and better treatment options, especially for those with severe vWD. The growing awareness, improved diagnostic tools, and the introduction of new treatments tailored to vWD are expected to fuel this segment's growth over the forecast period.

By Drug Class

The Recombinant Coagulation Factor Concentrates segment dominated the market with a market share of 40% in 2023. This is because the high efficacy rate, better safety profiles, and ability to avoid bleeding events have made them standard treatments in Hemophilia A and B cases. These products have essentially replaced plasma-derived therapy as a treatment choice primarily because recombinant drugs are less likely to spread blood-borne pathogens; they can offer long-term benefits through fewer injections and are significantly pure.

The desmopressin segment is the fastest growing in the bleeding disorder treatment market, mainly for its increasing use in mild Hemophilia A and Von Willebrand Disease (vWD). Desmopressin is favored because of its affordability, ease of administration, and effectiveness in promoting blood clotting in patients with these milder forms of bleeding disorders. As awareness spreads, its use is being extended, especially in settings where more expensive therapies cannot be accessed.

By End-User

The hospital segment dominated the market with a market share of 50% in 2023. This is generally because the condition is much more complex, and most need hospital-based treatment. All advanced medical structures and specialty care providers are to be found within hospitals in managing treatments for conditions like Hemophilia and vWD through gene therapies, recombinant factor concentrates, and even newer treatments available. In addition, advanced treatment is usually expensive, which makes it more readily available in hospitals where all services are provided.

Bleeding Disorders Treatment Market Regional Analysis:

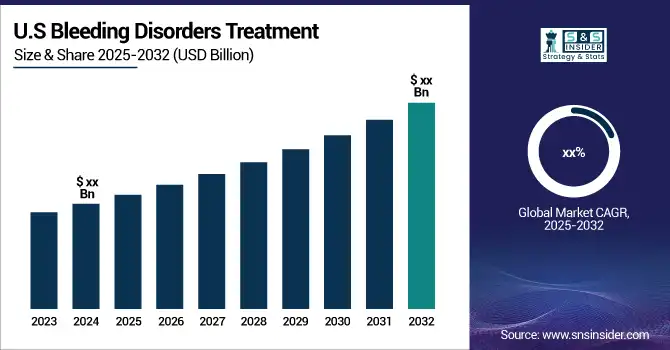
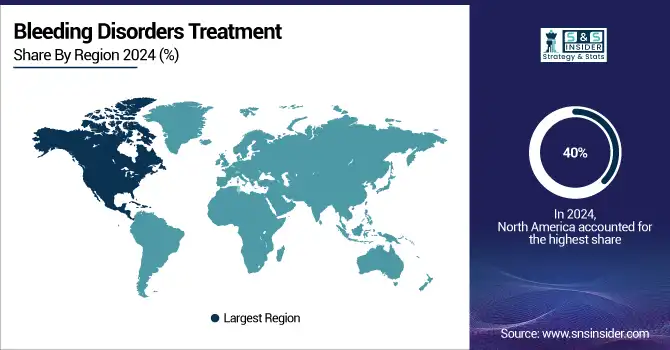
North America Bleeding Disorders Treatment Market Insights

North America dominated the bleeding disorders treatment market with a 40% market share, largely driven by the high prevalence of hemophilia and other bleeding disorders, advanced healthcare infrastructure, and a high adoption rate for treatment. The United States in particular is one of the largest markets because of a large patient population suffering from bleeding disorders. Several top pharmaceutical companies in the United States are involved in research and development, producing next-generation treatments like gene therapies and recombinant factor concentrates. The region also boasts a strong healthcare system, insurance, and easy access to specialized medical centers with comprehensive care for bleeding disorder patients. The approval processes for new treatments by the FDA in North America are much faster than those in other regions. Further, ongoing research and development work in the United States and Canada continue to advance the science behind treatment innovation, especially concerning recombinant therapies and gene therapies.

Asia Pacific Bleeding Disorders Treatment Market Insights

Asia Pacific is the fastest-growing region in the bleeding disorders treatment market during the forecast period. The region is seeing tremendous growth due to awareness and improvement in healthcare infrastructure as well as rising diagnostic capabilities. In countries like China and India, where immense underserved populations are suffering from bleeding disorders, the market is expanding as better options are becoming available. With improving economic conditions, more patients in these regions are gaining access to advanced therapies such as recombinant coagulation factor concentrates and desmopressin. Also, increasing healthcare expenditures and the attempts to enhance the diagnosis of bleeding disorders are fuelling market growth. Continued rapid adoption of newer therapies, such as gene therapies, should be expected with modernization in countries' healthcare systems and public health initiatives that increase awareness of rare bleeding disorders.

Europe Bleeding Disorders Treatment Market Insights

Europe represents a mature market for bleeding disorders treatment, driven by strong healthcare infrastructure, widespread access to advanced therapies, and supportive reimbursement policies. Rising prevalence of hemophilia and von Willebrand disease, coupled with ongoing clinical research and government initiatives, are fostering market expansion across countries such as Germany, France, and the U.K.

Latin America (LATAM) and Middle East & Africa (MEA) Bleeding Disorders Treatment Market Insights

LATAM and MEA markets are gradually expanding, supported by increasing diagnosis rates, improving healthcare facilities, and growing availability of recombinant therapies. Government programs to enhance rare disease awareness, along with international partnerships for affordable treatment access, are fueling demand. Brazil, Mexico, Saudi Arabia, and South Africa are key contributors to regional market growth.


Bleeding-Disorders-Treatment-Market-Regional-Share

Get Customized Report as per Your Business Requirement - Enquiry Now

Bleeding Disorders Treatment Market Key Players:

  • Biogen Inc. (Eloctate, Alprolix)

  • CSL Behring (Humate-P, Idelvion)

  • Pfizer Inc. (BeneFIX, Xyntha)

  • Novo Nordisk A/S (Novoeight, Refixia)

  • Grifols S.A. (Alphanate, Fanhdi)

  • Bayer AG (Kogenate, Jivi)

  • Octapharma AG (Wilate, Nuwiq)

  • Sanofi (Altuviiio, Obizur)

  • Roche (Hemlibra, ACE910)

  • Takeda Pharmaceutical (Advate, Feiba)

  • Ferring Pharmaceuticals (Desmopressin, Stimate Nasal Spray)

  • Baxter International (Obizur, Rixubis)

  • Amgen Inc. (Investigational therapies)

  • Alnylam Pharmaceuticals (RNAi-based treatments)

  • Bristol-Myers Squibb (Clinical-stage therapies)

  • Janssen Pharmaceuticals (Coagulopathy treatments)

  • Zydus Lifesciences (Plasma-derived factor concentrates, Generic antifibrinolytics)

  • Sun Pharmaceuticals (Tranexamic acid, Desmopressin)

  • AbbVie Inc. (Clotting factor stabilizers, Anticoagulant reversal agents)

  • Bausch & Lomb (Hemostatic products, Specialty bleeding management solutions)

Key suppliers

  • Lonza Group AG Suppliers

  • Thermo Fisher Scientific Inc. Suppliers

  • Merck KGaA (MilliporeSigma) Suppliers

  • Cytiva Suppliers

  • Bio-Rad Laboratories, Inc. Suppliers

  • Sartorius AG Suppliers

  • Charles River Laboratories International, Inc. Suppliers

  • WuXi Biologics Suppliers

  • Octapharma AG Suppliers

  • Catalent, Inc. Suppliers

Competitive Landscape for Bleeding Disorders Treatment Market:

Novo Nordisk A/S is a global leader in bleeding disorders treatment, offering innovative therapies such as Novoeight and Refixia for hemophilia management. The company focuses on developing advanced recombinant factor products and long-acting treatments, enhancing patient outcomes. Strong R&D investments and global presence solidify its position in the market.

  • June 2024: Novo Nordisk revealed positive outcomes from the phase 3 FRONTIER2 trial, which involved 254 participants aged 12 and older with hemophilia A, both with and without inhibitors. The trial assessed Mim8, an investigational therapy, under once-weekly and once-monthly prophylactic treatment regimens aimed at reducing prolonged and spontaneous bleeding episodes.

Takeda Pharmaceutical Company is a key player in the bleeding disorders treatment market, providing leading therapies such as Advate and Feiba. With a strong commitment to innovation, Takeda develops advanced plasma-derived and recombinant factor products. Its global reach and focus on rare disease care reinforce its leadership in hemophilia management.

  • November 2023: Takeda achieved a milestone with the U.S. FDA approval of ADAMTS13, recombinant-krhn. This marks the first-ever recombinant ADAMTS13 enzyme replacement therapy designed to treat congenital thrombotic thrombocytopenic purpura (cTTP), providing a groundbreaking therapeutic option for patients with this rare blood disorder.


Bleeding Disorders Treatment Market Report Scope:

Report Attributes Details
Market Size in 2024 USD 17.80 Billion
Market Size by 2032 USD 35.17 Billion
CAGR CAGR of 8.91% From 2024 to 2032
Base Year 2024
Forecast Period 2025-2032
Historical Data 2021-2023
Report Scope & Coverage Market Size, Segments Analysis, Competitive Landscape, Regional Analysis, DROC & SWOT Analysis, Forecast Outlook
Key Segments • By Type (Hemophilia A, Hemophilia B, Von Willebrand Disease (vWD), Others)
• By Drug Class (Plasma Derived Coagulation Factor Concentrates, Recombinant Coagulation Factor Concentrate, Desmopressin, Antifibrinolytics, Fibrin Sealants, Other Bleeding Disorders Treatment)
• By End-Users (Hospitals, Clinics, Research Institutes, Others)   
Regional Analysis/Coverage North America (US, Canada), Europe (Germany, UK, France, Italy, Spain, Russia, Poland, Rest of Europe), Asia Pacific (China, India, Japan, South Korea, Australia, ASEAN Countries, Rest of Asia Pacific), Middle East & Africa (UAE, Saudi Arabia, Qatar, South Africa, Rest of Middle East & Africa), Latin America (Brazil, Argentina, Mexico, Colombia, Rest of Latin America).
Company Profiles Biogen Inc., CSL Behring, Pfizer Inc., Novo Nordisk A/S, Grifols S.A., Bayer AG, Octapharma AG, Sanofi, Roche, Takeda Pharmaceutical, Ferring Pharmaceuticals, Baxter International, Amgen Inc., Alnylam Pharmaceuticals, Bristol-Myers Squibb, Janssen Pharmaceuticals, Zydus Lifesciences, Sun Pharmaceuticals, AbbVie Inc., Bausch & Lomb.

Table Of Contents

1. Introduction

1.1 Market Definition & Scope

 1.2 Research Assumptions & Abbreviations

 1.3 Research Methodology

2. Executive Summary

2.1 Market Snapshot

 2.2 Market Absolute $ Opportunity Assessment & Y-o-Y Analysis, 2021–2032

 2.3 Market Size & Forecast, By Segmentation, 2021–2032

  2.3.1 Market Size By Type

  2.3.2 Market Size By Drug Class

  2.3.3 Market Size By End-Users

 2.4 Market Share & Bps Analysis By Region, 2024

 2.5 Industry Growth Scenarios – Conservative, Likely & Optimistic

 2.6 Industry CxO’s Perspective

3. Market Overview

3.1 Market Dynamics

  3.1.1 Drivers

  3.1.2 Restraints

  3.1.3 Opportunities

  3.1.4 Key Market Trends

 3.2 Industry PESTLE Analysis

 3.3 Key Industry Forces (Porter’s) Impacting Market Growth

 3.4 Industry Supply Chain Analysis

  3.4.1 Raw Material Suppliers

  3.4.2 Manufacturers

  3.4.3 Distributors/Suppliers

  3.4.4 Customers/End-Users

 3.5 Industry Life Cycle Assessment

 3.6 Parent Market Overview

 3.7 Market Risk Assessment

4. Statistical Insights & Trends Reporting

4.1 Incidence & Prevalence Metrics

4.1.1 Global and regional prevalence (per 100,000 population) of major bleeding disorders (Hemophilia A, Hemophilia B, Von Willebrand Disease, rare bleeding disorders)

4.1.2 Annual incidence of diagnosed cases (%) by age group (pediatric, adult, elderly)

4.1.3 Mortality and morbidity rates (%) associated with untreated or poorly managed bleeding disorders

4.2 Treatment & Prescription Trends

4.2.1 Share of patients on prophylactic vs. on-demand therapy (%)

4.2.2 Prescription volume trends for replacement therapies (plasma-derived, recombinant factors, extended half-life factors)

4.2.3 Adoption rate (%) of emerging therapies (gene therapy, non-factor therapies, bispecific antibodies)

4.3 Healthcare Spending & Cost Burden

4.3.1 Average annual treatment cost per patient (USD) by therapy type

4.3.2 Regional healthcare expenditure (%) on bleeding disorder management relative to rare diseases budget

4.3.3 Share of costs attributed to hospitalization, emergency care, and long-term prophylaxis (%)

4.4 Patient Access & Reimbursement Metrics

4.4.1 Percentage of patients with insurance/reimbursement coverage for advanced therapies

4.4.2 Regional disparity (%) in treatment access between high-income and low-middle-income countries

4.4.3 Share of patients enrolled in patient assistance or compassionate use programs (%)

5. Bleeding Disorders Treatment Market Segmental Analysis & Forecast, By Type, 2021 – 2032, Value (USD Billion)

5.1 Introduction

 5.2 Hemophilia A

  5.2.1 Key Trends

  5.2.2 Market Size & Forecast, 2021 – 2032

5.3 Hemophilia B

  5.3.1 Key Trends

  5.3.2 Market Size & Forecast, 2021 – 2032

5.4 Von Willebrand Disease (vWD)

  5.4.1 Key Trends

  5.4.2 Market Size & Forecast, 2021 – 2032

5.5 Others

  5.5.1 Key Trends

  5.5.2 Market Size & Forecast, 2021 – 2032

6. Bleeding Disorders Treatment Market Segmental Analysis & Forecast, By Drug Class, 2021 – 2032, Value (USD Billion)

    6.1 Introduction

 6.2 Plasma Derived Coagulation Factor Concentrates

  6.2.1 Key Trends

  6.2.2 Market Size & Forecast, 2021 – 2032

               6.3 Recombinant Coagulation Factor Concentrate

  6.3.1 Key Trends

  6.3.2 Market Size & Forecast, 2021 – 2032

               6.4 Desmopressin

  6.4.1 Key Trends

  6.4.2 Market Size & Forecast, 2021 – 2032

               6.5 Antifibrinolytics

  6.5.1 Key Trends

  6.5.2 Market Size & Forecast, 2021 – 2032

               6.6 Fibrin Sealants

  6.6.1 Key Trends

  6.6.2 Market Size & Forecast, 2021 – 2032

               6.7 Other bleeding Disorders Treatment

  6.7.1 Key Trends

  6.7.2 Market Size & Forecast, 2021 – 2032

7. Bleeding Disorders Treatment Market Segmental Analysis & Forecast, By End-Users, 2021 – 2032, Value (USD Billion)

    7.1 Introduction

 7.2 Hospital

  7.2.1 Key Trends

  7.2.2 Market Size & Forecast, 2021 – 2032

 7.3 Clinics

  7.3.1 Key Trends

  7.3.2 Market Size & Forecast, 2021 – 2032

 7.4 Research Institutes

  7.4.1 Key Trends

  7.4.2 Market Size & Forecast, 2021 – 2032

 7.5 Others

  7.5.1 Key Trends

  7.5.2 Market Size & Forecast, 2021 – 2032

8. Bleeding Disorders Treatment Market Segmental Analysis & Forecast By Region, 2021 – 2025, Value (USD Billion)

8.1 Introduction

8.2 North America

 8.2.1 Key Trends

 8.2.2 Bleeding Disorders Treatment Market Size & Forecast, By Type, 2021 – 2032

 8.2.3 Bleeding Disorders Treatment Market Size & Forecast, By Drug Class, 2021 – 2032

 8.2.4 Bleeding Disorders Treatment Market Size & Forecast, By End-Users, 2021 – 2032

 8.2.5 Bleeding Disorders Treatment Market Size & Forecast, By Country, 2021 – 2032

  8.2.5.1 USA

   8.2.5.1.1 Bleeding Disorders Treatment Market Size & Forecast, By Type, 2021 – 2032

   8.2.5.1.2 Bleeding Disorders Treatment Market Size & Forecast, By Drug Class, 2021 – 2032

   8.2.5.1.3 Bleeding Disorders Treatment Market Size & Forecast, By End-Users, 2021 – 2032

  8.2.5.2 Canada

   8.2.5.2.1 Bleeding Disorders Treatment Market Size & Forecast, By Type, 2021 – 2032

   8.2.5.2.2 Bleeding Disorders Treatment Market Size & Forecast, By Drug Class, 2021 – 2032

   8.2.5.2.3 Bleeding Disorders Treatment Market Size & Forecast, By End-Users, 2021 – 2032

8.3 Europe

 8.3.1 Key Trends

 8.3.2 Bleeding Disorders Treatment Market Size & Forecast, By Type, 2021 – 2032

 8.3.3 Bleeding Disorders Treatment Market Size & Forecast, By Drug Class, 2021 – 2032

 8.3.4 Bleeding Disorders Treatment Market Size & Forecast, By End-Users, 2021 – 2032

 8.3.5 Bleeding Disorders Treatment Market Size & Forecast, By Country, 2021 – 2032

  8.3.5.1 Germany

   8.3.5.1.1 Bleeding Disorders Treatment Market Size & Forecast, By Type, 2021 – 2032

   8.3.5.1.2 Bleeding Disorders Treatment Market Size & Forecast, By Drug Class, 2021 – 2032

   8.3.5.1.3 Bleeding Disorders Treatment Market Size & Forecast, By End-Users, 2021 – 2032

  8.3.5.2 UK

   8.3.5.2.1 Bleeding Disorders Treatment Market Size & Forecast, By Type, 2021 – 2032

   8.3.5.2.2 Bleeding Disorders Treatment Market Size & Forecast, By Drug Class, 2021 – 2032

   8.3.5.2.3 Bleeding Disorders Treatment Market Size & Forecast, By End-Users, 2021 – 2032

  8.3.5.3 France

   8.3.5.3.1 Bleeding Disorders Treatment Market Size & Forecast, By Type, 2021 – 2032

   8.3.5.3.2 Bleeding Disorders Treatment Market Size & Forecast, By Drug Class, 2021 – 2032

   8.3.5.3.3 Bleeding Disorders Treatment Market Size & Forecast, By End-Users, 2021 – 2032

  8.3.5.4 Italy

   8.3.5.4.1 Bleeding Disorders Treatment Market Size & Forecast, By Type, 2021 – 2032

   8.3.5.4.2 Bleeding Disorders Treatment Market Size & Forecast, By Drug Class, 2021 – 2032

   8.3.5.4.3 Bleeding Disorders Treatment Market Size & Forecast, By End-Users, 2021 – 2032

  8.3.5.5 Spain

   8.3.5.5.1 Bleeding Disorders Treatment Market Size & Forecast, By Type, 2021 – 2032

   8.3.5.5.2 Bleeding Disorders Treatment Market Size & Forecast, By Drug Class, 2021 – 2032

   8.3.5.5.3 Bleeding Disorders Treatment Market Size & Forecast, By End-Users, 2021 – 2032

  8.3.5.6 Russia

   8.3.5.6.1 Bleeding Disorders Treatment Market Size & Forecast, By Type, 2021 – 2032

   8.3.5.6.2 Bleeding Disorders Treatment Market Size & Forecast, By Drug Class, 2021 – 2032

   8.3.5.6.3 Bleeding Disorders Treatment Market Size & Forecast, By End-Users, 2021 – 2032

  8.3.5.7 Poland

   8.3.5.7.1 Bleeding Disorders Treatment Market Size & Forecast, By Type, 2021 – 2032

   8.3.5.7.2 Bleeding Disorders Treatment Market Size & Forecast, By Drug Class, 2021 – 2032

   8.3.5.7.3 Bleeding Disorders Treatment Market Size & Forecast, By End-Users, 2021 – 2032

  8.3.5.8 Rest of Europe

   8.3.5.8.1 Bleeding Disorders Treatment Market Size & Forecast, By Type, 2021 – 2032

   8.3.5.8.2 Bleeding Disorders Treatment Market Size & Forecast, By Drug Class, 2021 – 2032

   8.3.5.8.3 Bleeding Disorders Treatment Market Size & Forecast, By End-Users, 2021 – 2032

8.4 Asia-Pacific

 8.4.1 Key Trends

 8.4.2 Bleeding Disorders Treatment Market Size & Forecast, By Type, 2021 – 2032

 8.4.3 Bleeding Disorders Treatment Market Size & Forecast, By Drug Class, 2021 – 2032

 8.4.4 Bleeding Disorders Treatment Market Size & Forecast, By End-Users, 2021 – 2032

 8.4.5 Bleeding Disorders Treatment Market Size & Forecast, By Country, 2021 – 2032

  8.4.5.1 China

   8.4.5.1.1 Bleeding Disorders Treatment Market Size & Forecast, By Type, 2021 – 2032

   8.4.5.1.2 Bleeding Disorders Treatment Market Size & Forecast, By Drug Class, 2021 – 2032

   8.4.5.1.3 Bleeding Disorders Treatment Market Size & Forecast, By End-Users, 2021 – 2032

  8.4.5.2 India

   8.4.5.2.1 Bleeding Disorders Treatment Market Size & Forecast, By Type, 2021 – 2032

   8.4.5.2.2 Bleeding Disorders Treatment Market Size & Forecast, By Drug Class, 2021 – 2032

   8.4.5.2.3 Bleeding Disorders Treatment Market Size & Forecast, By End-Users, 2021 – 2032

  8.4.5.3 Japan

   8.4.5.3.1 Bleeding Disorders Treatment Market Size & Forecast, By Type, 2021 – 2032

   8.4.5.3.2 Bleeding Disorders Treatment Market Size & Forecast, By Drug Class, 2021 – 2032

   8.4.5.3.3 Bleeding Disorders Treatment Market Size & Forecast, By End-Users, 2021 – 2032

  8.4.5.4 South Korea

   8.4.5.4.1 Bleeding Disorders Treatment Market Size & Forecast, By Type, 2021 – 2032

   8.4.5.4.2 Bleeding Disorders Treatment Market Size & Forecast, By Drug Class, 2021 – 2032

   8.4.5.4.3 Bleeding Disorders Treatment Market Size & Forecast, By End-Users, 2021 – 2032

  8.4.5.5 Australia

   8.4.5.5.1 Bleeding Disorders Treatment Market Size & Forecast, By Type, 2021 – 2032

   8.4.5.5.2 Bleeding Disorders Treatment Market Size & Forecast, By Drug Class, 2021 – 2032

   8.4.5.5.3 Bleeding Disorders Treatment Market Size & Forecast, By End-Users, 2021 – 2032

  8.4.5.6 ASEAN Countries

   8.4.5.6.1 Bleeding Disorders Treatment Market Size & Forecast, By Type, 2021 – 2032

   8.4.5.6.2 Bleeding Disorders Treatment Market Size & Forecast, By Drug Class, 2021 – 2032

   8.4.5.6.3 Bleeding Disorders Treatment Market Size & Forecast, By End-Users, 2021 – 2032

  8.4.5.7 Rest of Asia-Pacific

   8.4.5.7.1 Bleeding Disorders Treatment Market Size & Forecast, By Type, 2021 – 2032

   8.4.5.7.2 Bleeding Disorders Treatment Market Size & Forecast, By Drug Class, 2021 – 2032

   8.4.5.7.3 Bleeding Disorders Treatment Market Size & Forecast, By End-Users, 2021 – 2032

8.5 Latin America

 8.5.1 Key Trends

 8.5.2 Bleeding Disorders Treatment Market Size & Forecast, By Type, 2021 – 2032

 8.5.3 Bleeding Disorders Treatment Market Size & Forecast, By Drug Class, 2021 – 2032

 8.5.4 Bleeding Disorders Treatment Market Size & Forecast, By End-Users, 2021 – 2032

 8.5.5 Bleeding Disorders Treatment Market Size & Forecast, By Country, 2021 – 2032

  8.5.5.1 Brazil

   8.5.5.1.1 Bleeding Disorders Treatment Market Size & Forecast, By Type, 2021 – 2032

   8.5.5.1.2 Bleeding Disorders Treatment Market Size & Forecast, By Drug Class, 2021 – 2032

   8.5.5.1.3 Bleeding Disorders Treatment Market Size & Forecast, By End-Users, 2021 – 2032

  8.5.5.2 Argentina

   8.5.5.2.1 Bleeding Disorders Treatment Market Size & Forecast, By Type, 2021 – 2032

   8.5.5.2.2 Bleeding Disorders Treatment Market Size & Forecast, By Drug Class, 2021 – 2032

   8.5.5.2.3 Bleeding Disorders Treatment Market Size & Forecast, By End-Users, 2021 – 2032

  8.5.5.3 Mexico

   8.5.5.3.1 Bleeding Disorders Treatment Market Size & Forecast, By Type, 2021 – 2032

   8.5.5.3.2 Bleeding Disorders Treatment Market Size & Forecast, By Drug Class, 2021 – 2032

   8.5.5.3.3 Bleeding Disorders Treatment Market Size & Forecast, By End-Users, 2021 – 2032

  8.5.5.4 Colombia

   8.5.5.4.1 Bleeding Disorders Treatment Market Size & Forecast, By Type, 2021 – 2032

   8.5.5.4.2 Bleeding Disorders Treatment Market Size & Forecast, By Drug Class, 2021 – 2032

   8.5.5.4.3 Bleeding Disorders Treatment Market Size & Forecast, By End-Users, 2021 – 2032

  8.5.5.5 Rest of Latin America

   8.5.5.5.1 Bleeding Disorders Treatment Market Size & Forecast, By Type, 2021 – 2032

   8.5.5.5.2 Bleeding Disorders Treatment Market Size & Forecast, By Drug Class, 2021 – 2032

   8.5.5.5.3 Bleeding Disorders Treatment Market Size & Forecast, By End-Users, 2021 – 2032

8.6 Middle East & Africa

 8.6.1 Key Trends

 8.6.2 Bleeding Disorders Treatment Market Size & Forecast, By Type, 2021 – 2032

 8.6.3 Bleeding Disorders Treatment Market Size & Forecast, By Drug Class, 2021 – 2032

 8.6.4 Bleeding Disorders Treatment Market Size & Forecast, By End-Users, 2021 – 2032

 8.6.5 Bleeding Disorders Treatment Market Size & Forecast, By Country, 2021 – 2032

  8.6.5.1 UAE

   8.6.5.1.1 Bleeding Disorders Treatment Market Size & Forecast, By Type, 2021 – 2032

   8.6.5.1.2 Bleeding Disorders Treatment Market Size & Forecast, By Drug Class, 2021 – 2032

   8.6.5.1.3 Bleeding Disorders Treatment Market Size & Forecast, By End-Users, 2021 – 2032

  8.6.5.2 Saudi Arabia

   8.6.5.2.1 Bleeding Disorders Treatment Market Size & Forecast, By Type, 2021 – 2032

   8.6.5.2.2 Bleeding Disorders Treatment Market Size & Forecast, By Drug Class, 2021 – 2032

   8.6.5.2.3 Bleeding Disorders Treatment Market Size & Forecast, By End-Users, 2021 – 2032

  8.6.5.3 Qatar

   8.6.5.3.1 Bleeding Disorders Treatment Market Size & Forecast, By Type, 2021 – 2032

   8.6.5.3.2 Bleeding Disorders Treatment Market Size & Forecast, By Drug Class, 2021 – 2032

   8.6.5.3.3 Bleeding Disorders Treatment Market Size & Forecast, By End-Users, 2021 – 2032

  8.6.5.4 Egypt

   8.6.5.4.1 Bleeding Disorders Treatment Market Size & Forecast, By Type, 2021 – 2032

   8.6.5.4.2 Bleeding Disorders Treatment Market Size & Forecast, By Drug Class, 2021 – 2032

   8.6.5.4.3 Bleeding Disorders Treatment Market Size & Forecast, By End-Users, 2021 – 2032

  8.6.5.5 South Africa

   8.6.5.5.1 Bleeding Disorders Treatment Market Size & Forecast, By Type, 2021 – 2032

   8.6.5.5.2 Bleeding Disorders Treatment Market Size & Forecast, By Drug Class, 2021 – 2032

   8.6.5.5.3 Bleeding Disorders Treatment Market Size & Forecast, By End-Users, 2021 – 2032

  8.6.5.6 Rest of Middle East & Africa

   8.6.5.6.1 Bleeding Disorders Treatment Market Size & Forecast, By Type, 2021 – 2032

   8.6.5.6.2 Bleeding Disorders Treatment Market Size & Forecast, By Drug Class, 2021 – 2032

   8.6.5.6.3 Bleeding Disorders Treatment Market Size & Forecast, By End-Users, 2021 – 2032

9. Competitive Landscape

 9.1 Key Players' Positioning

 9.2 Competitive Developments

  9.2.1 Key Strategies Adopted (%), By Key Players, 2024

  9.2.2 Year-Wise Strategies & Development, 2021 – 2025

  9.2.3 Number Of Strategies Adopted By Key Players, 2024

 9.3 Market Share Analysis, 2024

 9.4 Product/Service & Application Benchmarking

  9.4.1 Product/Service Specifications & Features By Key Players

  9.4.2 Product/Service Heatmap By Key Players

  9.4.3 Application Heatmap By Key Players

 9.5 Industry Start-Up & Innovation Landscape

9.6 Key Company Profiles

 9.6.1 AbbVie Inc.

  9.6.1.1 Company Overview & Snapshot

  9.6.1.2 Product/Service Portfolio

  9.6.1.3 Key Company Financials

  9.6.1.4 SWOT Analysis

 9.6.2 Bayer AG.

  9.6.2.1 Company Overview & Snapshot

  9.6.2.2 Product/Service Portfolio

  9.6.2.3 Key Company Financials

  9.6.2.4 SWOT Analysis

 9.6.3 Novo Nordisk A/S

  9.6.3.1 Company Overview & Snapshot

  9.6.3.2 Product/Service Portfolio

  9.6.3.3 Key Company Financials

  9.6.3.4 SWOT Analysis

 9.6.4 Pfizer Inc.

  9.6.4.1 Company Overview & Snapshot

  9.6.4.2 Product/Service Portfolio

  9.6.4.3 Key Company Financials

  9.6.4.4 SWOT Analysis

 9.6.5 Biogen Inc.

  9.6.5.1 Company Overview & Snapshot

  9.6.5.2 Product/Service Portfolio

  9.6.5.3 Key Company Financials

  9.6.5.4 SWOT Analysis

 9.6.6 CSL Behring (CSL Ltd).

  9.6.6.1 Company Overview & Snapshot

  9.6.6.2 Product/Service Portfolio

  9.6.6.3 Key Company Financials

  9.6.6.4 SWOT Analysis

 9.6.7 Grifols S.A.

  9.6.7.1 Company Overview & Snapshot

  9.6.7.2 Product/Service Portfolio

  9.6.7.3 Key Company Financials

  9.6.7.4 SWOT Analysis

 9.6.8 Octapharma AG

  9.6.8.1 Company Overview & Snapshot

  9.6.8.2 Product/Service Portfolio

  9.6.8.3 Key Company Financials

  9.6.8.4 SWOT Analysis

 9.6.9 BDI Pharma Inc.

  9.6.9.1 Company Overview & Snapshot

  9.6.9.2 Product/Service Portfolio

  9.6.9.3 Key Company Financials

  9.6.9.4 SWOT Analysis

 9.6.10 Ferring Pharmaceuticals Ltd.

  9.6.10.1 Company Overview & Snapshot

  9.6.10.2 Product/Service Portfolio

  9.6.10.3 Key Company Financials

  9.6.10.4 SWOT Analysis

 9.6.11 Sanofi S.A.

  9.6.11.1 Company Overview & Snapshot

  9.6.11.2 Product/Service Portfolio

  9.6.11.3 Key Company Financials

  9.6.11.4 SWOT Analysis

 9.6.12 Takeda Pharmaceutical Company Limited

  9.6.12.1 Company Overview & Snapshot

  9.6.12.2 Product/Service Portfolio

  9.6.12.3 Key Company Financials

  9.6.12.4 SWOT Analysis

 9.6.13 F. Hoffmann-La Roche Ltd.

  9.6.13.1 Company Overview & Snapshot

  9.6.13.2 Product/Service Portfolio

  9.6.13.3 Key Company Financials

  9.6.13.4 SWOT Analysis

 9.6.14 Amgen Inc.

  9.6.14.1 Company Overview & Snapshot

  9.6.14.2 Product/Service Portfolio

  9.6.14.3 Key Company Financials

  9.6.14.4 SWOT Analysis

 9.6.15 Baxter International Inc.

  9.6.15.1 Company Overview & Snapshot

  9.6.15.2 Product/Service Portfolio

  9.6.15.3 Key Company Financials

  9.6.15.4 SWOT Analysis

 9.6.16 BioMarin Pharmaceutical Inc.

  9.6.16.1 Company Overview & Snapshot

  9.6.16.2 Product/Service Portfolio

  9.6.16.3 Key Company Financials

  9.6.16.4 SWOT Analysis

 9.6.17 Genentech, Inc.

  9.6.17.1 Company Overview & Snapshot

  9.6.17.2 Product/Service Portfolio

  9.6.17.3 Key Company Financials

  9.6.17.4 SWOT Analysis

 9.6.18 Kedrion Biopharma Inc.

  9.6.18.1 Company Overview & Snapshot

  9.6.18.2 Product/Service Portfolio

  9.6.18.3 Key Company Financials

  9.6.18.4 SWOT Analysis

 9.6.19 LFB S.A.

  9.6.19.1 Company Overview & Snapshot

  9.6.19.2 Product/Service Portfolio

  9.6.19.3 Key Company Financials

  9.6.19.4 SWOT Analysis

 9.6.20 Kamada Ltd.

  9.6.20.1 Company Overview & Snapshot

  9.6.20.2 Product/Service Portfolio

  9.6.20.3 Key Company Financials

  9.6.20.4 SWOT Analysis

10. Analyst Recommendations

 10.1 SNS Insider Opportunity Map

 10.2 Industry Low-Hanging Fruit Assessment

 10.3 Market Entry & Growth Strategy

 10.4 Analyst Viewpoint & Suggestions On Market Growth

11. Assumptions

12. Disclaimer

13. Appendix

 13.1 List Of Tables

 13.2 List Of Figures

Key Market Segments:

By Type

  • Hemophilia A

  • Hemophilia B

  • Von Willebrand Disease (vWD)

  • Others

By Drug Class

  • Plasma Derived Coagulation Factor Concentrates

  • Recombinant Coagulation Factor Concentrate

  • Desmopressin

  • Antifibrinolytics

  • Fibrin Sealants

  • Other bleeding Disorders Treatment

By End-Users

  • Hospital

  • Clinics

  • Research Institutes

  • Others

Request for Segment Customization as per your Business Requirement: Segment Customization Request

REGIONAL COVERAGE:

North America

  • US

  • Canada

  • Mexico

Europe

  • Eastern Europe

    • Poland

    • Romania

    • Hungary

    • Turkey

    • Rest of Eastern Europe

  • Western Europe

    • Germany

    • France

    • UK

    • Italy

    • Spain

    • Netherlands

    • Switzerland

    • Austria

    • Rest of Western Europe

Asia Pacific

  • China

  • India

  • Japan

  • South Korea

  • Vietnam

  • Singapore

  • Australia

  • Rest of Asia Pacific

Middle East & Africa

  • Middle East

    • UAE

    • Egypt

    • Saudi Arabia

    • Qatar

    • Rest of the Middle East

  • Africa

    • Nigeria

    • South Africa

    • Rest of Africa

Latin America

  • Brazil

  • Argentina

  • Colombia

  • Rest of Latin America

Request for Country Level Research Report: Country Level Customization Request

Available Customization

With the given market data, SNS Insider offers customization to meet the company’s specific needs. The following customization options are available for the report:

  • Product Analysis

  • Criss-Cross segment analysis (e.g. Product X Application)

  • Product Matrix which gives a detailed comparison of the product portfolio of each company

  • Geographic Analysis

  • Additional countries in any of the regions

  • Company Information

  • Detailed analysis and profiling of additional market players (Up to five)

An accurate research report requires proper strategizing as well as implementation. There are multiple factors involved in the completion of good and accurate research report and selecting the best methodology to compete the research is the toughest part. Since the research reports we provide play a crucial role in any company’s decision-making process, therefore we at SNS Insider always believe that we should choose the best method which gives us results closer to reality. This allows us to reach at a stage wherein we can provide our clients best and accurate investment to output ratio.

Each report that we prepare takes a timeframe of 350-400 business hours for production. Starting from the selection of titles through a couple of in-depth brain storming session to the final QC process before uploading our titles on our website we dedicate around 350 working hours. The titles are selected based on their current market cap and the foreseen CAGR and growth.


The 5 steps process:

Step 1: Secondary Research:

Secondary Research or Desk Research is as the name suggests is a research process wherein, we collect data through the readily available information. In this process we use various paid and unpaid databases which our team has access to and gather data through the same. This includes examining of listed companies’ annual reports, Journals, SEC filling etc. Apart from this our team has access to various associations across the globe across different industries. Lastly, we have exchange relationships with various university as well as individual libraries.

Secondary Research

Step 2: Primary Research

When we talk about primary research, it is a type of study in which the researchers collect relevant data samples directly, rather than relying on previously collected data.  This type of research is focused on gaining content specific facts that can be sued to solve specific problems. Since the collected data is fresh and first hand therefore it makes the study more accurate and genuine.

We at SNS Insider have divided Primary Research into 2 parts.

Part 1 wherein we interview the KOLs of major players as well as the upcoming ones across various geographic regions. This allows us to have their view over the market scenario and acts as an important tool to come closer to the accurate market numbers. As many as 45 paid and unpaid primary interviews are taken from both the demand and supply side of the industry to make sure we land at an accurate judgement and analysis of the market.

This step involves the triangulation of data wherein our team analyses the interview transcripts, online survey responses and observation of on filed participants. The below mentioned chart should give a better understanding of the part 1 of the primary interview.

Primary Research

Part 2: In this part of primary research the data collected via secondary research and the part 1 of the primary research is validated with the interviews from individual consultants and subject matter experts.

Consultants are those set of people who have at least 12 years of experience and expertise within the industry whereas Subject Matter Experts are those with at least 15 years of experience behind their back within the same space. The data with the help of two main processes i.e., FGDs (Focused Group Discussions) and IDs (Individual Discussions). This gives us a 3rd party nonbiased primary view of the market scenario making it a more dependable one while collation of the data pointers.

Step 3: Data Bank Validation

Once all the information is collected via primary and secondary sources, we run that information for data validation. At our intelligence centre our research heads track a lot of information related to the market which includes the quarterly reports, the daily stock prices, and other relevant information. Our data bank server gets updated every fortnight and that is how the information which we collected using our primary and secondary information is revalidated in real time.

Data Bank Validation

Step 4: QA/QC Process

After all the data collection and validation our team does a final level of quality check and quality assurance to get rid of any unwanted or undesired mistakes. This might include but not limited to getting rid of the any typos, duplication of numbers or missing of any important information. The people involved in this process include technical content writers, research heads and graphics people. Once this process is completed the title gets uploader on our platform for our clients to read it.

Step 5: Final QC/QA Process:

This is the last process and comes when the client has ordered the study. In this process a final QA/QC is done before the study is emailed to the client. Since we believe in giving our clients a good experience of our research studies, therefore, to make sure that we do not lack at our end in any way humanly possible we do a final round of quality check and then dispatch the study to the client.