Brain Imaging Devices Market Report Scope & Overview:
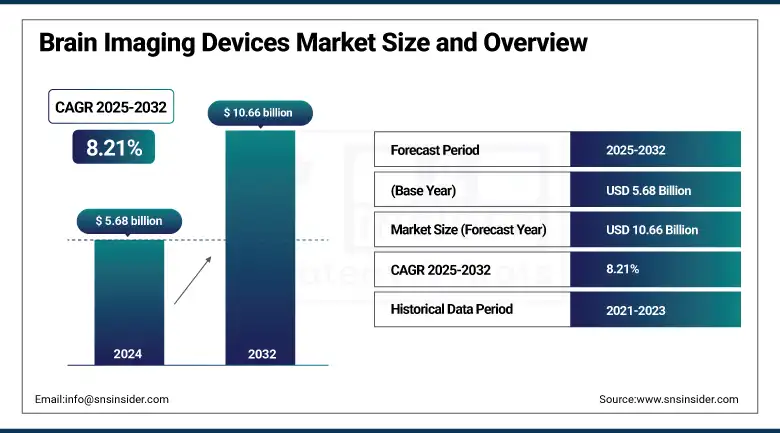
The brain imaging devices market size was valued at USD 5.68 billion in 2024 and is expected to reach USD 10.66 billion by 2032, growing at a CAGR of 8.21% over 2025-2032.
The brain imaging devices market trend is growing due to rising easier access & increasing incidence of neurological disorders, which include stroke, epilepsy, brain tumor, and other diseases, such as Alzheimer's. This increasing disease burden is leading to a greater need for early and non-invasive diagnostic assessment, such as MRI, CT, EEG, MEG, and PET, among others. Neuroimaging techniques are being upgraded in terms of AI application, the development of portable scanners, and that of multimodal systems, all of which will be ideal for raising the diagnostic accuracy rate and administrative level.
For instance, in March 2024, Cerca Magnetics and FieldLine Inc. commenced clinical trials of the wearable MEG systems, initiating the move away from bed-based systems to those that are real-time and ambulatory for brain monitoring.
Large companies including GE HealthCare, Siemens Healthineers, and Canon Medical are ramping up R&D spending for next-generation brain imaging technology. The rise of global healthcare and neurotechnologies investment, including public–private partnerships and programs, such as the NIH BRAIN Initiative, is strengthening innovation conduits. Furthermore, regulatory clearances by entities, including the FDA, for AI-based and wearables imaging solutions are fast-tracking market penetration. Growing availability of advanced imaging systems and expanding funding for diagnostic facilities also further reinforce the demand-supply equilibrium and reinforce the clinical adoption in medical institutions.
To Get more information On Brain Imaging Devices Market - Request Free Sample Report
In April 2024, GE HealthCare unveiled an AI-enhanced MRI system optimized for brain diagnostics, which increases scan efficiency while cutting the procedure time by 40%.
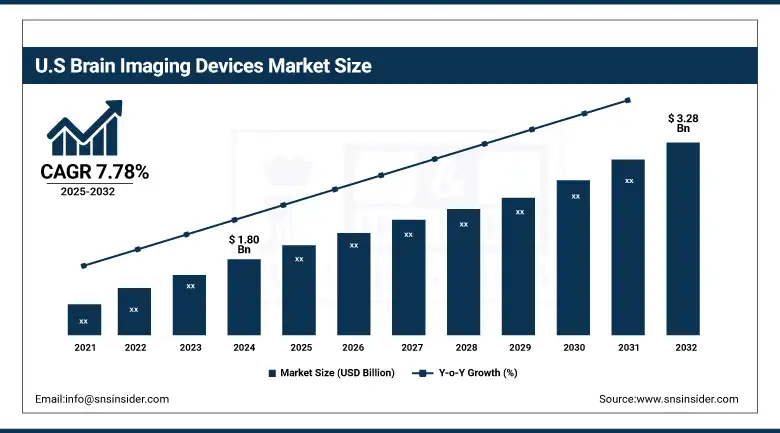
The U.S. brain imaging devices market size was valued at USD 1.80 billion in 2024 and is expected to reach USD 3.28 billion by 2032, growing at a CAGR of 7.78% over 2025-2032. Of the total, the U.S. is a top contender due to a high incidence of neurological diseases, including more than 6 million Americans who have Alzheimer's, and advanced infrastructure. In addition, a number of brain imaging devices have been approved by the U.S. FDA in the last few years, facilitating early uptake. Canada is also seeing increasing demand, mostly reflecting its growing elderly population and investment in neuroscience research. The market continues to be at the lead with the existence of major players and continued public-private partnerships in North America.
Market Dynamics:
Drivers:
-
Surge in Neurological Disorder Diagnostics, Increased Funding in Neuroscience, and Technological Innovation in Imaging Tools Fuel Market Growth
Factors, such as a rise in diagnostics for neurological conditions, growth in neuroscience initiatives, and advancements in brain imaging, are the key drivers of the market. The World Health Organization (WHO) reports that more than 16% of global deaths are attributed to neurological diseases, reinforcing the pressing importance of reliable and rapid diagnosis. AI-powered imaging is making a rapid appearance. For instance, Philips debuted a deep-learning-enabled MRI in 2023 that allows for faster neuro scans with fewer artifacts.
On the investment side, brain-centered startup venture funding grew to over USD 1.2 billion globally over 2022-2024, indicating investors’ increasing confidence in the sector. In addition, public initiatives, such as the Canadian Brain Research Fund and China’s Brain Science and Brain-Inspired Intelligence Project, are growing pipelines of funding. This momentum has been supported by regulatory bodies, in which more than 30 neuroimaging devices were granted FDA 510(k) clearances between 2021-2024, which encouraged manufacturers to bring new products to market. This alignment of the demand for diagnostics, the flow of financing, and the right regulations in place will push the market along.
Restraints:
-
Brain Imaging Devices Market Faces Several Restraints, Particularly in Terms of Affordability, Infrastructure Gaps, and Workforce Limitations
High costs of capital for cutting-edge systems, such as PET-MRI hybrids, in excess of USD 2 million in many instances, make adoption challenging for smaller hospitals and outpatient clinic users. There is also a lack of skilled radiologists and neuroradiologists globally, leading to delayed active use of the state-of-the-art imaging equipment. Almost 28% of brain MRI facilities will be experiencing scan delays related to staffing deficits, according to a 2023 study from the American College of Radiology.
Regulatory barriers also present high barriers to entry, such as for MEG devices, which are subject to more rigorous review on account of EMF safety issues, resulting in longer approval cycles. Moreover, compatibility and data integration challenges with hospital PACS systems were impeding the smooth transition to a digital image environment. These supply-side and operating obstacles limit the scale of adoption of new technologies and hinder market take-up in less digitized health systems, in spite of high demand.
Segmentation Analysis:
By Product Type
The brain imaging devices market trend was the leading market in 2024 for imaging devices and represented an 82.5% share of the total. The ubiquity is derived from the crucial ability to diagnose a myriad of neurological disorders, including stroke, tumors, epilepsy, and traumatic brain injury, with modalities such as MRI, PET, CT, EEG, and MEG. These devices are being used increasingly in hospitals and imaging centers because of their high level of accuracy and clinical fidelity. Accessory type (electrode & sensor) is the fastest-growing. This power requirement is now increasing with the ever-increasing availability of portable and wearable neuroimaging devices, with applications in remote diagnostic and sleep studies. Brain imaging devices market growth momentum is also pegged by disposable accessory usage in ambulatory settings, wherein patient-centric & mobile healthcare gains center stage.
By Modality
In 2024, fixed brain imaging devices held a 64.8% share because of their wide application in clinical settings for highly detailed brain images in acute conditions, such as stroke and tumor. Their capacity for high-resolution whole-body imaging renders them invaluable in hospital-based neurology. Contrarily, wearable brain imaging devices were the fastest growing modality, which were primarily popularized due to the growing implementation of portable EEG and fNIRS devices for long-term recordings, studies of cognition, and decentralized trials. They are increasingly being used in outpatient and research settings for real-time analysis of brain activity, similar to large, cumbersome setups in neuroimaging that are available only in most traditional hospital settings.
By Application
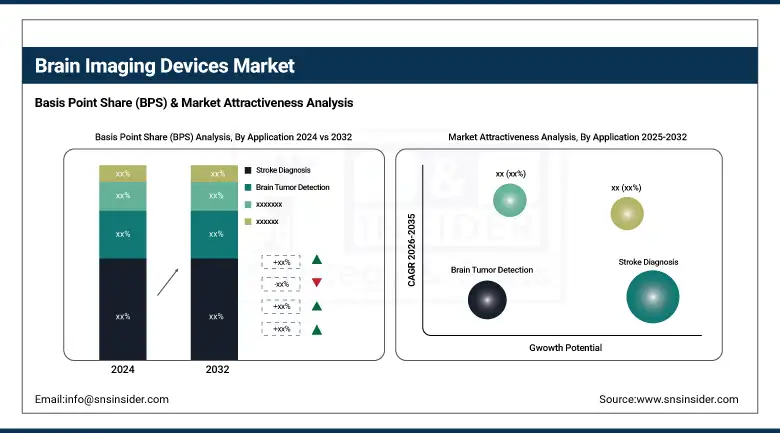
Stroke diagnosis was the largest in terms of brain imaging devices market share in 2024, comprising 29.3% share, due to the increasing global burden of stroke incidences, and the demand for swift diagnosis imaging without invasion, with MRI and CT technology. It is an emergency department that gives top priority to stroke imaging, as timing in treating a stroke is everything. Epilepsy monitoring was the fastest-growing application segment, driven by growing awareness, prevalence, and utilization of continuous EEG and MEG to monitor or track seizures, particularly in children and treatment-resistant patient populations. Advances in long-term wearable EEG and home-based diagnostics are helping make epilepsy detection more efficient and scalable and are accelerating the growth of this segment, as clinicians look for real-time, ambulatory monitoring solutions.
By End-user
Hospitals continued to be the major end-user in 2024, with a market share of 54.6%. Since they have integrated diagnostic systems and specialized neurology departments and receive funding for advanced imaging platforms, they are frequent users of brain imaging equipment. They also manage the highest number of critical neurological conditions, including stroke, traumatic brain injury, and tumors. Diagnostic imaging centers, meanwhile, are the fastest-growing category by end-user. These centers are furnished with high-quality and cost-effective neuroimaging equipment, and they have an expanding outpatient profile. Imaging centers are venturing into new areas in decentralization and rapid diagnosis in response to incentive reimbursement programs and are providing competition to hospital-based imaging and serving the growing need for neurological screening and follow-up.
Regional Analysis:
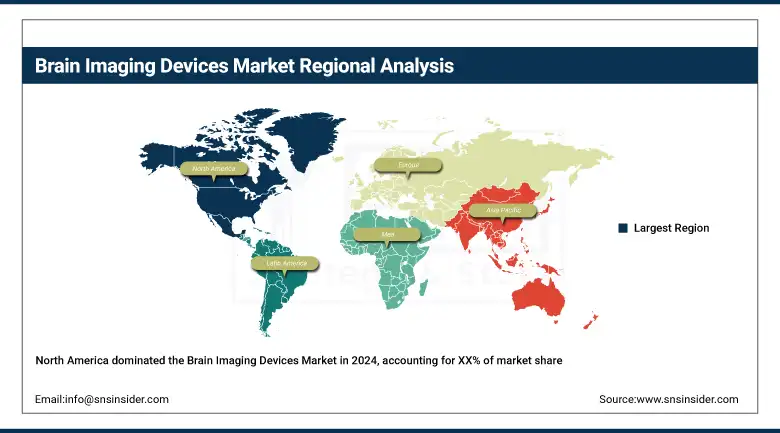
North America held a significant share of the brain imaging devices market analysis in 2024, owing to high healthcare spending, early adoption of advanced imaging technologies, and favorable reimbursement schemes. The market has been receiving robust R&D investment and significant deployment of AI in the diagnostic imaging sector in the region.
Get Customized Report as per Your Business Requirement - Enquiry Now
Europe is the second-largest brain imaging devices market, supported by well-established government healthcare systems, a high level of neurological screening programs, and increasing uptake of AI-embedded imaging devices. It is a powerhouse of clinical trials and medical technology innovation. Germany dominated in Europe with its sophisticated hospital system, vast diagnostic imaging network, and high level of expenditure on healthcare technologies, and thus was valued at about 24% of the European market in 2024. France and the U.K. are also highly adopting, particularly for stroke diagnosis and epilepsy monitoring. Poland and Russia, meanwhile, are growing fastest in Eastern Europe, due to the modernization of diagnostic facilities and state-sponsored funding initiatives. The EC digital health strategy and the use of AI in diagnostics continue to drive the brain imaging devices market growth in the region.
Asia Pacific is the fastest-growing region in the brain imaging devices market trends due to the increasing burden of neurological diseases, healthcare expenditure, and growing diagnostic infrastructure. China takes the lead in the region, driven by fast hospital expansion, increasing stroke incidence (where stroke is already the major cause of death), and on-site manufacturing of imaging systems. In 2024, China has a market share of around 36% in the Asia Pacific. India is coming up, and portability of EEG and MRI is being used in tier-2 cities and also in rural diagnostics. There is also consistent demand for advanced neuroimaging in Japan, where an aging population and tech-driven health care ecosystem are increasingly using such studies. As AI-enabled diagnostics gain governmental support and private investment, adoption is on the rise in ASEAN countries, South Korea, and Australia, establishing the Asia Pacific (APAC) as the next lucrative region for growth.
Key Players:
Notable brain imaging device companies in the market include GE HealthCare Technologies Inc., Siemens Healthineers AG, Koninklijke Philips N.V., Medtronic, Compumedics Limited, MEGIN, CTF MEG Neuro Innovations Inc., FieldLine Inc., Cerca Magnetics Limited, Advanced Brain Monitoring Inc., Canon Medical Systems Corporation, Natus Medical Incorporated, Magstim EGI, Cadwell Industries Inc., Nihon Kohden Corporation, NeuroLogica Corp., Hitachi High-Tech Corporation, EB Neuro S.p.A., Shimadzu Corporation, and Canon Medical Informatics Inc.
Recent Developments:
In May 2025, Hyperfine secured FDA 510(k) clearance for Optive AI, next-generation AI software integrated into its Swoop portable ultra-low-field MRI system. This release significantly enhances anatomical clarity and diagnostic confidence in decentralized brain MRI imaging.
In July 2024, Positrigo received FDA clearance for its NeuroLF, the first ultra-compact dedicated brain PET system in the U.S., specially designed for functional neuroimaging in Alzheimer’s, epilepsy, Parkinson’s, and tumor diagnostics, boosting accessibility to PET-based advanced brain diagnostics.
| Report Attributes | Details |
|---|---|
| Market Size in 2024 | USD 5.68 billion |
| Market Size by 2032 | USD 10.66 billion |
| CAGR | CAGR of 8.21% From 2025 to 2032 |
| Base Year | 2024 |
| Forecast Period | 2025-2032 |
| Historical Data | 2021-2023 |
| Report Scope & Coverage | Market Size, Segments Analysis, Competitive Landscape, Regional Analysis, DROC & SWOT Analysis, Forecast Outlook |
| Key Segments | • By Product Type (Imaging Devices (Electroencephalography (EEG), Magnetoencephalography (MEG), Magnetic Resonance Imaging (MRI), Computed Tomography (CT), Positron Emission Tomography (PET), Other Imaging Devices (Near-Infrared Spectroscopy (NIRS), Single Photon Emission Computed Tomography (SPECT), etc.)), Accessories (Electrodes, Sensors, Other Accessories (Lead wires and caps, Imaging-compatible head restraints, etc.)) • By Modality (Fixed Brain Imaging Devices, Portable Brain Imaging Devices, Wearable Brain Imaging Devices) • By Application (Stroke Diagnosis, Brain Tumor Detection, Traumatic Brain Injury (TBI), Epilepsy Monitoring, Sleep Apnea Assessment, Headache Evaluation, Structural Brain Anomalies, Other Neurological Applications (Alzheimer’s Disease and other dementias, Parkinson’s Disease, etc.)) By End-User (Hospitals, Diagnostic Imaging Centers, Ambulatory Surgical Centers (ASCs), Specialty Clinics, Other Healthcare Settings (Academic & Research Institutions, Neuroscience Research Labs)) |
| Regional Analysis/Coverage | North America (U.S., Canada), Europe (Germany, France, UK, Italy, Spain, Russia, Poland, Rest of Europe), Asia Pacific (China, India, Japan, South Korea, Australia, ASEAN Countries, Rest of Asia Pacific), Middle East & Africa (UAE, Saudi Arabia, Qatar, Egypt, South Africa, Rest of Middle East & Africa), Latin America (Brazil, Argentina, Mexico, Colombia, Rest of Latin America) |
| Company Profiles | GE HealthCare Technologies Inc., Siemens Healthineers AG, Koninklijke Philips N.V., Medtronic, Compumedics Limited, MEGIN, CTF MEG Neuro Innovations Inc., FieldLine Inc., Cerca Magnetics Limited, Advanced Brain Monitoring Inc., Canon Medical Systems Corporation, Natus Medical Incorporated, Magstim EGI, Cadwell Industries Inc., Nihon Kohden Corporation, NeuroLogica Corp., Hitachi High-Tech Corporation, EB Neuro S.p.A., Shimadzu Corporation, and Canon Medical Informatics Inc. |
Frequently Asked Questions
Ans: FDA and CE mark approvals impact time-to-market and innovation cycles, while reimbursement frameworks influence device adoption across care settings.
Ans: Asia-Pacific is the fastest-growing region due to increasing healthcare investment and neurology infrastructure, followed by Latin America with expanding diagnostic access.
Ans: Rising prevalence of conditions like stroke, epilepsy, Alzheimer's, and brain tumors significantly increases the need for early and accurate neuroimaging diagnostics.
Ans: AI enhances diagnostic accuracy, speeds up image analysis, and enables predictive analytics, driving rapid adoption across MRI, EEG, and CT-based neuroimaging platforms.
Ans: Major players include GE HealthCare, Siemens Healthineers, Philips, Medtronic, Canon Medical, and Nihon Kohden, offering a wide range of advanced brain imaging technologies.
Get in Touch
