Oxygenated Solvents Market Size & Overview
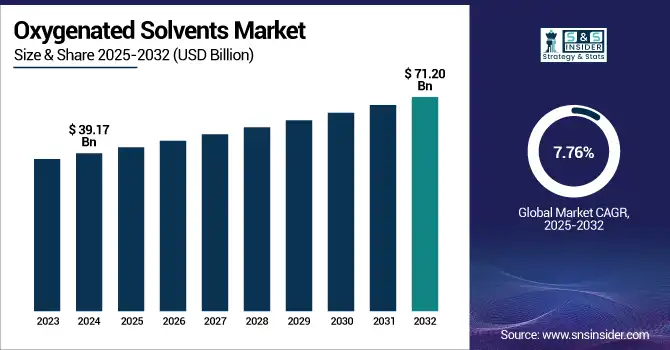
The Oxygenated Solvents Market size was valued at USD 39.17 billion in 2024 and is expected to reach USD 71.20 billion by 2032, growing at a CAGR of 7.76% over the forecast period of 2025-2032.
To Get more information on Oxygenated Solvents Market - Request Free Sample Report
Oxygenated solvents market analysis indicates that the expanding pharmaceutical industry significantly contributes to market growth. The pharmaceutical industry has experienced significant growth due to increases in global healthcare needs, investment in drug development, and a demand for innovative drugs. Water and oxygenated solvents are key in pharmaceutical manufacturing, especially for the formulation, extraction, purification, and synthesis of drugs. They provide better characteristics (high solvency power, low toxicity, and API compatibility) and are required for the manufacture of pharmaceutical products of better quality.
Moreover, the growing prevalence of chronic diseases, the increasing population of aging people, and the widespread adoption of a global culture of health are keeping the production of pharmaceuticals and increasing the need for oxygenated solvents in the industry on the rise.
For instance, new orders for manufactured goods in March 2025 were a reported USD 618.8 billion, up 4.3% from the previous month, according to the U.S. Census Bureau, released April 2025. This increase indicates an increase in the use of different manufacturing inputs, such as chemical products, including oxygenated solvents, which are used in producing pharmaceutical products.
Oxygenated Solvents Market Dynamics
Drivers
-
Rising demand from the paints & coatings industry drives the market growth.
Oxygenated solvents are one of the largest consumers in the paints and coatings industry, and the growth of the paints and coatings industry mostly drives the oxygenated solvents market. Such solvents play an important role in adjusting the viscosity, drying time, and finish of the wide variety of coatings and paint formulations. The demand for high-performance coatings has witnessed a strong growth owing to the increasing urbanization, infrastructure development, and surge in automotive manufacturing and refurbishing. Solvents containing oxygen, alcohols, ketones, and esters, among them, have found broad use in architectural, industrial, and automotive coatings because of good solvency, relatively low toxicity, and application convenience. Since construction and renovation activities are increasing, particularly in developing economies, the demand for quality paints and coatings is increasing, which in turn is driving the oxygenated solvents market growth.
The International Trade Administration states that the paints, coatings, and adhesives industry had 1,681 establishments in 2022 with more than 40,000 workers as of mid–2024. This reflects the growth of the industry and the increasing demand for chemical inputs, such as oxygenated solvents, with foreign direct investment in this sector reaching USD 7.6 billion in 2023.
Restrain
-
Price volatility of raw materials may hamper the market growth.
The oxygenated solvents market is sensitive towards both high and low rises in crude oil prices, as they are crude oil derivative petrochemicals, like natural gas. Fluctuating prices for key raw materials may cause uncertain production costs, making it difficult for manufacturers to achieve stable prices for oxygenated solvents. And the consequence of this lack of stability is massive operational costs that could be shifted to end-users and limit the demand altogether. This can also lead to supply chain disruptions due to some suppliers and manufacturers taking time to reach the target, while smaller manufacturers take time to adjust to competitive pressures in the market. This type of price fluctuation results in market uncertainty, which may slow the pace of investment and innovation initiatives and consequently restrict the production growth of the oxygenated solvents industry.
Opportunity
-
Innovations in solvent recovery and recycling technologies are creating opportunities for market growth.
The development of solvent recovery and recycling technologies offers vital market opportunities for oxygenated solvents as they address sustainability & cost benefits. These innovations allow manufacturers to recycle solvents multiple times, hence cutting down on waste and the impact of solvent disposal on the environment. To achieve industrial solvents market quality of the purified solvents, enhanced recovery systems with high recovery efficiency, such as distillation, membrane filtration, and adsorption technologies, are essential because the major recoverable solvents are usually produced at high concentrations (higher than 98% solids content). Solvent recycling technologies lead to less raw material use and, at the same time, lower operational costs, enabling firms to maintain a competitive edge in profitability under strict environmental regulations, which drive the oxygenated solvents market trends.
In 2024, Eastman Chemical increased production capacity for green solvent in Asia to meet increasing demand for sustainable solvents in the region. The move is indicative of Eastman's sustainability goals, but also of the increasing demand for sustainable products in the marketplace.
Oxygenated Solvents Market Segmentation Analysis
By Source
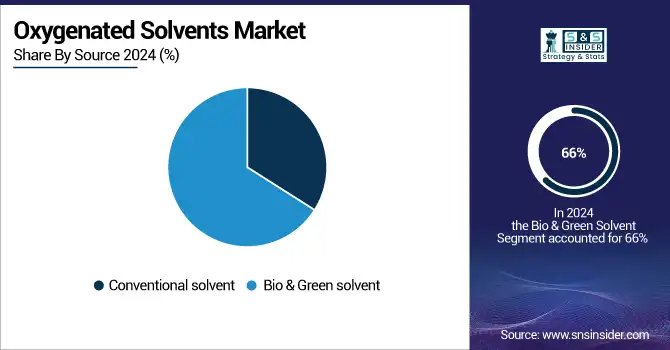
Bio & Green solvent held the largest oxygenated solvents market share, around 66%, in 2024. It is due to the environmental awareness and strict regulatory framework that requires harmful emissions and toxic materials to be replaced by eco-friendly materials. Such renewable-based solvents provide a safer and sustainable replacement to traditional petrochemical-based solvents, conforming to the latest worldwide drive towards lowering carbon footprint and promoting greener manufacturing processes. Furthermore, there is an increasing trend in consumer preference for products that are formulated with natural and non-toxic ingredients, particularly in the personal care, pharmaceuticals, and coatings industries.
Conventional solvent held a significant market share and was the fastest-growing segment in the forecast period. It is owing to their eco-friendliness, as their wide range of applications, proven performance, and cost-effectiveness lead the industry. These solvents, often based on petrochemical origin, are characterized by almost ideal solvency power, compatibility with numerous formulations, and assured bulk availability. Traditional solvents have been used in industries using solvents such as paints and coatings, the pharmaceutical, and agrochemical industries for extraction, cleaning, and formulation because they are efficient and versatile.
By Type
Glycol Ethers segment held the largest market share, around 31.34%, in 2024. This is primarily because of their high solubility potential and versatility across abundant industries, such as paints and coatings, healthcare, personal care, and detergents. With a unique combination of evaporation rate, low miscibility with both water and organic solvents, and low wet-to-wet toxicity, glycol ethers are often highly effective for a variety of formulations requiring controlled dry times and clean finishing. However, it needs to be mentioned that, as sustainability is starting to become a paramount global concern, bio and green solvents are quickly gaining momentum.
Bio & Green Solvents segment held a significant market share and was the fastest-growing segment in the forecast period. It is due to the increased demand for eco-friendly products, coupled with mandatory emission reductions of volatile organic compounds (VOCs) and hazardous chemicals, that has driven their rapid growth. Bio and green solvents are obtained from renewable resources, including but not limited to plants and biomass, and typically offer advantages such as biodegradability, low toxicity, and lower environmental impact than conventional petrochemical solvents. These sustainable solvents are being utilized in industries like personal care, pharmaceuticals, and agrochemicals to meet the sustainability goals and consumer demand for greener products.
By Application
The paints & coatings segment held the largest market share, around 34%, in 2024. It is owing to the high usage of these solvents for the formulation of high-performance coatings. Oxygenated chemical solvents are critical for paints and coatings, they are used as resin/binder components, to manipulate viscosity for application properties, and to provide adequate drying and film formation. Diverse coating solutions from skeletal decorative architectural paints to protective industrial coatings are driven by an ever-expanding global construction, automotive, and industrial demand. Moreover, the trend of consumers offering sophisticated appearances with improved durability also fuels the demand for oxygenated solvents in this industry.
Pharmaceuticals held a significant market share. It is owing to the importance of these solvents in the drug formulation, synthesis, and manufacturing processes. Alcohols, esters, and Glycol Ethers are oxygenated solvents commonly used as reaction media, extraction solvents, and diluents of active pharmaceutical ingredients (APIs). The wide range of compounds they can dissolve and their ability to do so at high purities make them indispensable in pharmaceutical production. Furthermore, high-quality solvents have always been required due to rising demand for new and complex drugs, globalization of pharmaceutical R&D activities, especially today in emerging markets.
Oxygenated Solvents Market Regional Outlook
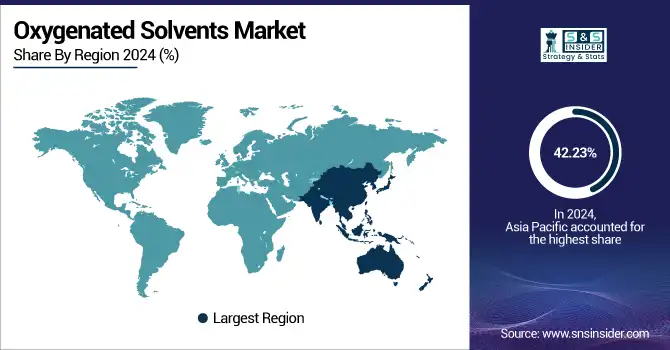
Asia Pacific held the largest market share, around 42.23%, in 2024. It is owing mostly to high industrialization, growing urbanization, and the rising manufacturing sector in countries such as China, India, Japan, South Korea, and others. Strong demand for industrial oxygenated solvents is generated from the region’s rapidly expanding paints and coatings, pharmaceutical, personal care, and agrochemical industries. Moreover, a plentiful supply of natural resources, inexpensive skilled labour, and government policies encouraging industrialization and exports are further encouraging growth in the market. The growing awareness about personal care, coupled with the growing disposable incomes, is another factor, further increasing solvent consumption in personal care and pharmaceutical products are the largest consumers of these solvents.
For instance, in 2022, Shell Overseas Investment B.V., a wholly owned subsidiary of Shell plc, acquired 100% of Solenergi Power Private Limited and the group of companies in India known as Sprng Energy from Actis Solenergi Limited. Such a buy will further boost Shell's renewable energy portfolio within Asia.
North America held a significant market share and growing region in the forecast period. It owing to the well-established chemical manufacturing infrastructure, technological advancement, and presence of a stringent regulatory environment, which promotes the use of high-quality, compliant solvents. With consistent R&D activities due to the strong pharma and personal care industries in the region, the solvent demand is expected to be substantial. Furthermore, North America has a significant paint and coating industry due to the automotive, construction, and industrial use of oxygenated solvents in high-performance and low-emission applications. Regulatory bodies like the EPA encourage the market to develop safer, solvent-based, low-volatile organic compounds (VOCs) options, which ultimately leads to market growth and innovation.
The U.S. Market size was valued at USD 6.76 billion in 2024 and is expected to reach USD 13.84 billion by 2032, growing at a CAGR of 8.92% in the forecast period 2025-2032. It is due high demand for advanced oxygenated solvents is driven by the well-established chemical manufacturing industry and the focus on innovation and quality in the country. Moreover, the stringent environmental & safety regulations imposed by various regulatory bodies, such as the EPA, promote the use of safer, low-VOC solvents, thereby boosting the market growth. The investments come along with large capital for R&D for the U.S., taking advantage of producing green and high-performance solvent solutions.
In 2023, Dow introduced a high-performance solvent for industrial use. This addition provides Dow with an improved portfolio to produce solvents, offering lower toxicity, increased efficiency, and superior performance for a wide range of industrial applications.
Europe held a significant market share in 2024. It is owing to a stringent regulation, a high industrial base, and a rising green chemistry and sustainability trend. It also puts pressure on manufacturers to pursue oxygenated solvents with proven compliance, making those products a sound investment for the long term. Besides that, the legacy of Europe’s large pharmaceuticals, paints and coatings, and cosmetics industries commands a large fraction of solvent use there. Top oxygenated solvents companies focus on innovation and sustainability, which are driving forces in Germany, France, and the U.K.
Get Customized Report as per Your Business Requirement - Enquiry Now
Key Players
BASF SE, Linde plc, CF Industries Holdings, Inc., Nutrien Ltd., Yara International ASA, OCI Nitrogen, Deepak Fertilizers and Petrochemicals Corporation Ltd., Dyno Nobel, Sinopec, Mitsubishi Chemical Corporation.
Recent Development:
-
In December 2024, BASF opened a new Catalyst Development and Solids Processing Center in Ludwigshafen, Germany. This facility is supposed to expedite the development of novel catalysts and process technologies, strengthening BASF`s research capabilities and enabling the supported green transformation of the chemical processes.
-
In 2025, CF Industries reached a positive final investment decision relating to a green ammonia plant at the Blue Point Complex in a joint venture with JERA Co., Inc. and Mitsui & Co., Ltd. The project will feature carbon capture and sequestration, targeting low-carbon ammonia production while minimizing greenhouse gas emissions.
| Report Attributes | Details |
|---|---|
| Market Size in 2024 | USD 39.17 Billion |
| Market Size by 2032 | USD 71.20 Billion |
| CAGR | CAGR of 7.76% From 2025 to 2032 |
| Base Year | 2024 |
| Forecast Period | 2025-2032 |
| Historical Data | 2021-2023 |
| Report Scope & Coverage | Market Size, Segments Analysis, Competitive Landscape, Regional Analysis, DROC & SWOT Analysis, Forecast Outlook |
| Key Segments | •By Source (Conventional solvent, Bio solvent, Green solvent) •By Type (Alcohols, Esters, Glycols, Glycol Ethers, Ketones, Bio & Green Solvents, Others) •By Application (Paints & Coatings, Pharmaceuticals, Personal Care, Crop Protection, Lubricants, Others), |
| Regional Analysis/Coverage | North America (US, Canada, Mexico), Europe (Germany, France, UK, Italy, Spain, Poland, Turkey, Rest of Europe), Asia Pacific (China, India, Japan, South Korea, Singapore, Australia, Rest of Asia Pacific), Middle East & Africa (UAE, Saudi Arabia, Qatar, South Africa, Rest of Middle East & Africa), Latin America (Brazil, Argentina, Rest of Latin America) |
| Company Profiles | BASF SE, Linde plc, CF Industries Holdings, Inc., Nutrien Ltd., Yara International ASA, OCI Nitrogen, Deepak Fertilisers and Petrochemicals Corporation Ltd., Dyno Nobel, Sinopec, Mitsubishi Chemical Corporation. |
Frequently Asked Questions
Ans: Asia Pacific led the Oxygenated Solvents Market in the region with the highest revenue share in 2023.
Ans: Rising demand from the paints & coatings industry drives the market growth.
Ans: Glycol Ethers will grow rapidly in the Oxygenated Solvents Market from 2024 to 2032.
Ans: The expected CAGR of the global Oxygenated Solvents Market during the forecast period is 7.76%
Ans: The Oxygenated Solvents Market was valued at USD 39.17 billion in 2024.
Get in Touch
