Busbar Trunking Market Report Scope & Overview:
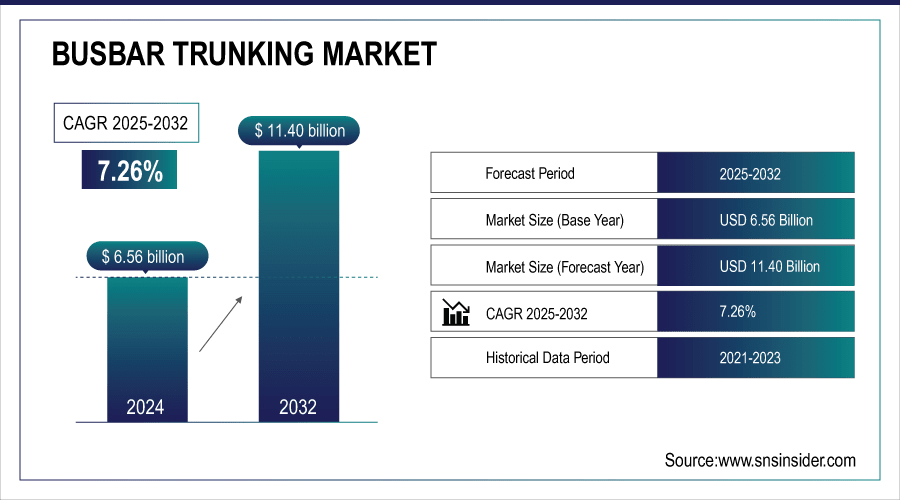
The Busbar Trunking Market size was valued at USD 6.56 Billion in 2024 and is projected to reach USD 11.40 Billion by 2032, growing at a CAGR of 7.26% during 2025-2032.
The global market growth is fueled by increasing needs for seamless power distribution in both the industrial, commercial and residential sectors. Growing demand is driven by rapid urbanization, expanding infrastructure and the shift toward electrification in emerging economies. New technologies in busbar design and materials enhance energy efficiency, reliability, and safety, making busbars a much more popular way to connect power systems than traditional wiring. This results in easy modularity and lower maintenance which is another reason behind their increasing adoption in current global electrical installations. Comprehensive busbar trunking market analysis highlights safety, efficiency and sustainable advantages.
-
Aluminum busbars provide a 40% weight reduction compared to copper, supporting lightweight designs and eco-friendly construction.
-
Over 65% of modern smart building projects now integrate busbar trunking for flexible, future-proof power distribution.

To Get More Information On Busbar Trunking Market - Request Free Sample Report
Busbar Trunking Market Trends:
-
Rapid growth in residential complexes, commercial hubs, and industrial plants is driving the adoption of efficient busbar trunking systems.
-
Busbars provide higher current-carrying capacity, lower energy loss, and compact installation, making them ideal for modern infrastructure.
-
Many industries are replacing traditional cabling with busbar systems to ensure safety, efficiency, and long-term reliability.
-
Incentives for low-loss power systems and stricter electrical safety standards encourage businesses to upgrade installations.
-
Green building certifications and eco-friendly policies promote busbar trunking adoption as part of sustainable infrastructure.
-
Busbars reduce maintenance costs, optimize space usage, and support carbon footprint reduction in industrial and commercial facilities.
Busbar Trunking Market Report Highlights:
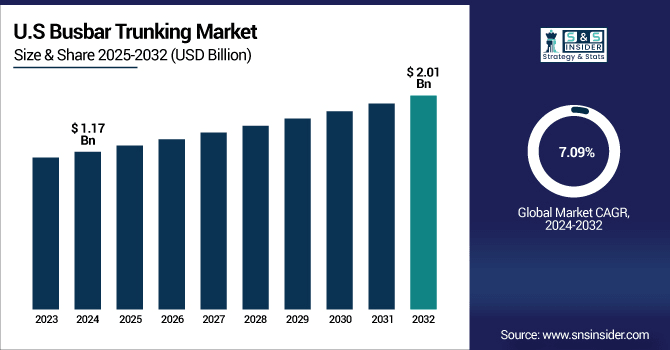
The U.S. Busbar Trunking Market size was valued at USD 1.17 Billion in 2024 and is projected to reach USD 2.01 Billion by 2032, growing at a CAGR of 7.09% during 2025-2032. The U.S. market growth can be attributed to modernizing electrical infrastructure and greater preference for energy-efficient power distribution in commercial and industrial establishments. Demand is also increasing as the governments of various countries have set strict regulations to ensure electrical safety and energy conservation. Moreover, the increasing development of smart buildings and growth of industrial automation are promoting the adoption of busbar systems to provide compact, reliable, and low-maintenance power delivery, thereby supporting efficient and sustainable electrical infrastructure development in the country.

Busbar trunking market trends register steady growth owing to the growing need for efficient power distribution, modernization of infrastructure, adoption of busbar trunking into industrial and commercial sectors, and enlargement in energy-efficient electrical solutions.
Busbar Trunking Market Segment Analysis:
-
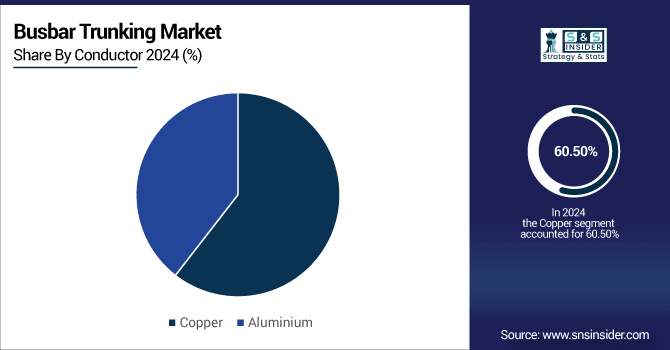
By Conductor, Copper held the largest share of around 60.50% in 2024, whereas Aluminium is projected to be the fastest-growing segment with a CAGR of 7.39%.
-
By Power Rating, the Medium segment dominated the market with approximately 36.10% share in 2024, while High segment is expected to register the highest growth with a CAGR of 7.91%.
-
By Insulation, Sandwich segment accounted for the leading share of nearly 67.40% in 2024, whereas Air segment is anticipated to be the fastest-growing segment with a CAGR of 7.12%.
-
By End-User, the Industrial segment led the market with about 39.85% share in 2024, while the Commercial segment is forecasted to grow the fastest at a CAGR of 8.02%.
By Conductor, Copper Printers Leads Market While Aluminium Registers Fastest Growth
Copper segment accounted for the highest busbar trunking market share of 60.50% in 2024 and is expected to dominate in the forecast period on account of excellent electrical conductivity, durability, and reliable operation at high current loads with low losses. The more model of copper busbar is preferred by the industries for critical applications in terms of energy and safety. One of the prominent companies utilizing copper busbars is Schneider Electric in their Industrial Solutions. The growth for aluminium segment is estimated to be the fastest with a CAGR of 7.39% during the forecast period 2024-2032, mainly due to its lightweight property, feasibility of large-scale installations, and lower cost.

By Power Rating, Medium Segment Dominate While High Segment Shows Rapid Growth
Medium power rating segment led the busbar trunking market in 2024 with a revenue share of 36.10% owing to its cost and capacity combination, and extensive applicability. ABB Ltd. supplies medium power busbar solutions extensively used in industrial facilities. Among the segments, high power rating is projected to be the fastest growing one with a CAGR of 7.91% during 2024-2032 owing to high-capacity, robust systems entrance into the market to cater to the needs of massive manufacturing plants, data centers, and high-rise commercial buildings requiring substantial power distribution.
By Insulation, Sandwich Segment Lead While Air Segment Registers Fastest Growth
Sandwich segment accounted the largest revenue share of 67.40% in 2024 in the busbar trunking market driven by the advantages, such as better protection against short circuits, durability against mechanical impact and safe operational nature during complex installations. Insulation of sandwich busbar developed by Siemens AG for industrial and commercial facilities. The air insulation segment is anticipated to grow the fastest at a CAGR of 7.12% during 2025-2032 due to demand in weight-sensitive and economically-sensitive projects as the lightweight designs, ease of installation, and low maintenance requirements attract adoption in industrial and commercial facilities with space constraints.
By End-User, Industrial Segment Lead While Commercial Grows the Fastest
The industrial segment led the busbar trunking market and accounted for 39.85% of revenue share in 2024 on account of high-power requirement, critical electrical safety, and the preference for reliable and low maintenance distribution system in manufacturing plants. Eaton Corporation supplies industrial busbar systems for these high-use applications. With the implementation of compact, modular busbar systems in office complexes, malls, and smart buildings for efficient power management and operational cost reduction, the commercial segment will be the fastest-growing type, registering a CAGR of 8.02% during 2025-2032.
Asia Pacific Busbar Trunking Market Insights:
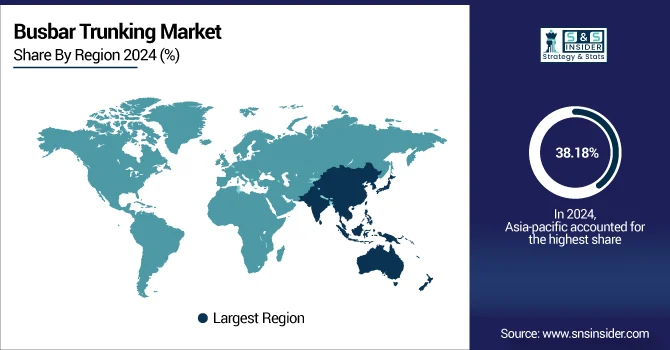
Asia Pacific led the Busbar Trunking Market, generating a revenue share of 38.18% in 2024, owing to the fast-paced industrialization, urbanization and development of electrical infrastructure in China, India, and South East Asia. The region hosts large-scale construction and manufacturing projects which have been supporting the demand for efficient power distribution in facilities in the area. Asia Pacific is anticipated to witness the highest growth at a CAGR of 7.70% over the forecast period of 2025-2032, owing to rapid investments in energy efficient infrastructure and commercial complexes and industrial automation in emerging economies for reliable and sustainable electrical solutions through busbar trunking systems.

Get Customized Report as Per Your Business Requirement - Enquiry Now
North America Busbar Trunking Market Insights:
North America market is growing with the highest CAGR in the busbar trunking market supported by electrical infrastructure modernization, swift industrial automation and energy-efficient system adaptation. As always, the U.S. remains the biggest market due to smart building initiatives and strong safety regulations, supplemented by growth in Canada's commercial and industrial projects and work in Mexico, marking the region as a growth region.
Europe Busbar Trunking Market Insights:
Europe accounts to a substantial share in the busbar trunking market due to modern infrastructure, stringent energy conservation regulations and high acceptance within industrial and commercial sectors. Key market growth is due to the increasing demand for sustainable power distribution in Germany, France and the U.K. Further, modernization of ageing grids and emphasis on green buildings propels the adoption across the region.
Latin America (LATAM) and Middle East & Africa (MEA) Busbar Trunking Market Insights:
The Middle East & Africa busbar trunking market is driven by infrastructure development, various smart city initiatives, and renewable energy investments in the UAE, Saudi Arabia, and other countries in the middle east. In Latin America, Brazil and Argentina spearhead demand owing to industrial growth, urbanization and modernization of electric power grids, which drives regional demand.
Busbar Trunking Market Growth Drivers:
-
Rapid Urbanization and Growing Industrial Infrastructure Increasing Busbar Demand Globally
The increasing demand for busbar trunking systems is being attributed to the growing urbanization and the factor of industrial infrastructure expansion. Notable urban development projects are highly reliant on power distribution for residential complexes, commercial buildings and industrial plants. The constructional merits of busbar systems namely higher current-carrying capacity, less loss of energy and lesser compact install location justify the modern construction requirement. Apart from this, busbar deployment is also rising as industries are replacing electrical networks with upgradation systems to ensure safety and efficiency. The capacity to manage high power in confined areas and a lower maintenance cost will make sure that busbar systems continue to be a vital part of industrial and commercial electrical infrastructure expansion globally.
Over 70% of newly constructed industrial plants in developed economies now prefer busbar systems over cables for main power distribution.
Modular plug-and-play installation reduces shutdown time by up to 70% compared to cable rewiring.
Busbar Trunking Market Restraints:
-
High Initial Installation Costs Limit Busbar Adoption in Cost-Sensitive Projects
The large capital investment burden of busbar trunking systems inhibits the market growth, largely over residential and small commercial projects, which are cost-sensitive. This is due to the requirement for higher performance materials, more precise manufacturing, and more expert installation, which all drive up initial costs compared to conventional cabling systems. Despite energy-saving and maintenance benefits over the long term, many organizations and developers balk at the cost. On top of that, the special solutions required for various power ratings and layouts further complicate and make it more expensive. While there are clear operational advantages with microgrids over traditional electrical distribution systems, these financial barriers can delay adoption in emerging economies and in smaller infrastructure projects, limiting market growth.
Busbar Trunking Market Opportunities:
-
Government Incentives and Energy Efficiency Regulations Encourage Busbar System Deployment
Enhanced energy efficiency, electrical safety, and sustainable infrastructure are some of the government initiatives that can provide lucrative opportunities for the busbar trunking market. To promote conversion of low-loss power distribution systems, they are offered incentives, and compliance with stringent electrical standards requires many businesses and developers to upgrade existing installations. Busbar adoption is also furthered by regions that focus on certification of green building and energy-saving technology. These policies can allow manufacturers to implement economical and eco-friendly solutions. Furthermore, increasing need to minimize carbon footprints and maximize operational efficiency supports the growth of busbar systems globally across construction applications, industrial facilities, and retrofitting applications.
Copper and aluminum used in busbars are over 95% recyclable, supporting circular economy and eco-friendly infrastructure mandates.
Low-smoke zero-halogen (LSZH) insulated busbars emit 80% less toxic gas during fire, meeting safety standards for public infrastructure.
Busbar Trunking Market Competitive Landscape
Siemens AG is a technology company based in Germany and a global leader in electrification, automation, and smart infrastructure solutions. Its SENTRON Busbar Trunking System ensures safe, reliable and modular power distribution in commercial and industrial buildings. At the same time, BD2 Busbar Trunking System provides smart and efficient compact solutions for modern buildings. Siemens continues to maintain its commitment to sustainability, innovation, and digital integration, offering high-performance busbar solutions for energy-efficient, flexible operations in a range of international applications, reinforcing a robust global footprint in the power distribution market.
-
In October 2024, Siemens introduced the SIMOCODE M-CP, a compact motor management solution with scalable communication and sustainability features, enhancing reliability and operational life in industrial switchboards.
ABB Ltd. is a Swiss technology company focused on electrification and automation and ensuring the energy efficiency. The Busway LX Low Voltage Busbar is deployed in high-reliability applications in the industrial and data center spaces. Isobar Busbar Trunking System provides safe and flexible distribution for commercial complexes. There is digital monitoring incorporated into ABB's busbar solutions and it results in lower energy losses and safer operation. ABB possesses a global footmark and is incessantly instigating smart infrastructure by latest improvements in bus-bar trunking suitable for dynamic logs.
-
In June 2024, ABB launched the ReliaGear™ Busway, a lighter, modular, and compact low-voltage busway system derived from the Spectra™ busway series, paired with SACE® Tmax® XT circuit breakers and fused switches. Designed for flexible installation, being easy to handle, install, and modify.
Schneider Electric SE is rather prominent in the energy management and automation industry which further specializes in making modular busbar systems for providing efficiency. Its Canalis Busbar Trunking System is reliable and fast installed and offers flexible solutions for industrial and commercial applications. I-Line Busway improves safety and provides flexible, scalable power distribution. Specializing in bringing digitization and sustainability into the equation, Schneider enables customers to monitor, track and lower the consumption of energy. Long term user of its Busbar solutions for smart buildings, infrastructure projects and critical industrial operations around the planet.
-
In April 2024, Schneider introduced the I-Line Track medium-power distribution busway tailored for data centers, featuring an open-track design, hot-pluggable tap-off units, real-time monitoring, 60% more compact footprint, and ten patented innovations.
Eaton Corporation plc is an Ireland-based power management company that provides energy-efficiency solutions for electrical, hydraulic, and mechanical power. Its Pow-R-Way III Busway provides high-performance, compact, and economical distribution of power to areas within the industrial facilities. The xEnergy Busbar Trunking System provides the flexibility needed in the medium-to-high capacity applications, with high performance with evolutionary safety. The company also applies sustainability in the designs it makes, as Eaton said that there was increasing demand to create modular and scalable solutions. Globally its Busbar Trunking Products are used in Commercial buildings, Data centers, and Manufacturing Plants.
-
In May 2024, Eaton will launch the XAP-J Cast Resin Busway, a durable, cast-resin insulated system rated for currents between 400 A and 6300 A at voltages up to 1000 V AC. This rugged solution boasts IP68 protection, making it ideal for harsh environments and even submerged applications, offering maintenance-free operation and high mechanical strength.
Mitsubishi Electric Corporation is a global technology company and a leader in power distribution, providing innovative electrical and electronic systems for various industries. The company has a Compact Busbar Trunking system that provides efficient space saving solutions for commercial and high-rise building applications. High capacity busbar trunking system is designed for larger industrial and infrastructure projects where high performance is necessary. Mitsubishi's focus on energy efficiency, robust durability, and longer life cycle reflected on their busbar systems. Designed for the future, it enables smart infrastructure, renewable integration, and resilient power management globally.
-
In June 2024, Mitsubishi Electric began shipping the new Unifull™ series of SBD-embedded SiC-MOSFET modules (3.3 kV, 200 A & 400 A variants) for industrial and rail applications. These modules reduce switching losses and improve efficiency in high-power environments.
Busbar Trunking Market Key Players
Some of the Busbar Trunking Market Companies are:
-
ABB Ltd.
-
Siemens AG
-
Schneider Electric SE
-
Eaton Corporation PLC
-
General Electric Company (GE)
-
Legrand SA
-
Larsen & Toubro Limited
-
C&S Electric Ltd.
-
Godrej & Boyce Manufacturing Co. Ltd.
-
Rittal GmbH & Co. KG
-
Anord Mardix Group
-
E+I Engineering Ltd.
-
Megabarre Group
-
NAXSO S.r.l.
-
Pogliano Busbar S.r.l.
-
DBTS Industries Sdn Bhd
-
EAE Elektrik
-
P&S Power Technologies Ltd.
-
Cuthbertson Laird Group
-
Mersen Property
Report Attributes | Details |
---|---|
Market Size in 2024 | USD 6.56 Billion |
Market Size by 2032 | USD 11.40 Billon |
CAGR | CAGR of 7.26% From 2025 to 2032 |
Base Year | 2024 |
Forecast Period | 2025-2032 |
Historical Data | 2021-2023 |
Report Scope & Coverage | Market Size, Segments Analysis, Competitive Landscape, Regional Analysis, DROC & SWOT Analysis, Forecast Outlook |
Key Segments | • By Conductor (Copper and Aluminium) • By Power Rating (Lighting, Low, Medium and High) • By Insulation (Air and Sandwich) • By End-User (Residential, Commercial, Industrial and Others) |
Regional Analysis/Coverage | North America (US, Canada, Mexico), Europe (Germany, France, UK, Italy, Spain, Poland, Turkey, Rest of Europe), Asia Pacific (China, India, Japan, South Korea, Singapore, Australia, Taiwan, Rest of Asia Pacific), Middle East & Africa (UAE, Saudi Arabia, Qatar, South Africa, Rest of Middle East & Africa), Latin America (Brazil, Argentina, Rest of Latin America) |
Company Profiles | ABB Ltd., Siemens AG, Schneider Electric SE, Eaton Corporation PLC, General Electric Company (GE), Legrand SA, Larsen & Toubro Limited, C&S Electric Ltd., Godrej & Boyce Manufacturing Co. Ltd., Rittal GmbH & Co. KG, Anord Mardix Group, E+I Engineering Ltd., Megabarre Group, NAXSO S.r.l., Pogliano Busbar S.r.l., DBTS Industries Sdn Bhd, EAE Elektrik, P&S Power Technologies Ltd., Cuthbertson Laird Group and Mersen Property. |
Table Of Contents
1. Introduction
1.1 Market Definition & Scope
1.2 Research Assumptions & Abbreviations
1.3 Research Methodology
2. Executive Summary
2.1 Market Snapshot
2.2 Market Absolute $ Opportunity Assessment & Y-o-Y Analysis, 2021–2032
2.3 Market Size & Forecast, By Segmentation, 2021–2032
2.3.1 Market Size By Conductor
2.3.2 Market Size By Power Rating
2.3.3 Market Size By Insulation
2.3.4 Market Size By End-User
2.4 Market Share & Bps Analysis By Region, 2024
2.5 Industry Growth Scenarios – Conservative, Likely & Optimistic
2.6 Industry CxO’s Perspective
3. Market Overview
3.1 Market Dynamics
3.1.1 Drivers
3.1.2 Restraints
3.1.3 Opportunities
3.1.4 Key Market Trends
3.2 Industry PESTLE Analysis
3.3 Key Industry Forces (Porter’s) Impacting Market Growth
3.4 Industry Supply Chain Analysis
3.4.1 Raw Material Suppliers
3.4.2 Manufacturers
3.4.3 Distributors/Suppliers
3.4.4 Customers/End-Users
3.5 Industry Life Cycle Assessment
3.6 Parent Market Overview
3.7 Market Risk Assessment
4. Statistical Insights & Trends Reporting
4.1 Pricing & Revenue Statistics
4.1.1 Average selling price (ASP) per meter of busbar trunking by type (copper, aluminum, hybrid)
4.1.2 Historical price trend over the last 5 years (%)
4.1.3 Revenue contribution by segment (industrial, commercial, data center)
4.1.4 Regional price comparison and variation (%)
4.1.5 Price impact of raw material fluctuations on final product cost
4.2 Supply Chain & Manufacturing Metrics
4.2.1 Global production capacity of busbar trunking systems (in kilometers/meters per year)
4.2.2 Manufacturing lead time per type of busbar system (weeks)
4.2.3 Utilization rate of production facilities (%)
4.2.4 Import/export volumes by major regions (metric tons or units)
4.2.5 Distribution channel share (% via direct sales, distributors, online)
4.3 Growth Drivers & Market Impact Metrics
4.3.1 Percentage of industrial and commercial buildings adopting busbar systems vs. conventional cabling
4.3.2 Energy savings achieved by using busbar trunking systems (%)
4.3.3 Cost-benefit ratio: installation cost vs. operational savings
4.3.4 Market impact of urbanization and industrialization on busbar adoption (%)
4.3.5 Contribution of renewable energy integration to market growth (%)
4.4 Forecast Metrics
4.4.1 Projected adoption rate by region and application type by 2030 (%)
4.4.2 Expected market share of different busbar types over the forecast period (%)
4.4.3 Growth in demand for smart/modular busbar systems (%)
4.4.4 Regional CAGR comparison (%)
4.4.5 Forecasted revenue contribution by segment (industrial, commercial, data center)
4.5 Operational & Performance Metrics
4.5.1 Average downtime reduction using busbar trunking vs. conventional cabling (%)
4.5.2 Reliability metrics: failure rate and mean time between failures (MTBF in years)
4.5.3 Scalability metrics: ease of network expansion (%)
4.5.4 Efficiency gains in electrical distribution (%)
4.5.5 Safety compliance rate with IEC/NEC standards (%)
5. Busbar Trunking Market Segmental Analysis & Forecast, By Conductor, 2021 – 2032, Value (Usd Billion)
5.1 Introduction
5.2 Copper
5.2.1 Key Trends
5.2.2 Market Size & Forecast, 2021 – 2032
5.3 Aluminium
5.3.1 Key Trends
5.3.2 Market Size & Forecast, 2021 – 2032
6. Busbar Trunking Market Segmental Analysis & Forecast, By Power Rating, 2021 – 2032, Value (Usd Billion)
6.1 Introduction
6.2 Lighting
6.2.1 Key Trends
6.2.2 Market Size & Forecast, 2021 – 2032
6.3 Low
6.3.1 Key Trends
6.3.2 Market Size & Forecast, 2021 – 2032
6.4 Medium
6.4.1 Key Trends
6.4.2 Market Size & Forecast, 2021 – 2032
6.5 High
6.5.1 Key Trends
6.5.2 Market Size & Forecast, 2021 – 2032
7. Busbar Trunking Market Segmental Analysis & Forecast, By Insulation, 2021 – 2032, Value (Usd Billion)
7.1 Introduction
7.2 Air
7.2.1 Key Trends
7.2.2 Market Size & Forecast, 2021 – 2032
7.3 Sandwich
7.3.1 Key Trends
7.3.2 Market Size & Forecast, 2021 – 2032
8. Busbar Trunking Market Segmental Analysis & Forecast, By End-User, 2021 – 2032, Value (Usd Billion)
8.1 Introduction
8.2 Residential
8.2.1 Key Trends
8.2.2 Market Size & Forecast, 2021 – 2032
8.3 Commercial
8.3.1 Key Trends
8.3.2 Market Size & Forecast, 2021 – 2032
8.4 Industrial
8.4.1 Key Trends
8.4.2 Market Size & Forecast, 2021 – 2032
8.5 Others
8.5.1 Key Trends
8.5.2 Market Size & Forecast, 2021 – 2032
9. Busbar Trunking Market Segmental Analysis & Forecast By Region, 2021 – 2025, Value (Usd Billion)
9.1 Introduction
9.2 North America
9.2.1 Key Trends
9.2.2 Busbar Trunking Market Size & Forecast, By Conductor, 2021 – 2032
9.2.3 Busbar Trunking Market Size & Forecast, By Power Rating, 2021 – 2032
9.2.4 Busbar Trunking Market Size & Forecast, By Insulation, 2021 – 2032
9.2.5 Busbar Trunking Market Size & Forecast, By End-User, 2021 – 2032
9.2.6 Busbar Trunking Market Size & Forecast, By Country, 2021 – 2032
9.2.6.1 USA
9.2.6.1.1 Busbar Trunking Market Size & Forecast, By Conductor, 2021 – 2032
9.2.6.1.2 Busbar Trunking Market Size & Forecast, By Power Rating, 2021 – 2032
9.2.6.1.3 Busbar Trunking Market Size & Forecast, By Insulation, 2021 – 2032
9.2.6.1.4 Busbar Trunking Market Size & Forecast, By End-User, 2021 – 2032
9.2.6.2 Canada
9.2.6.2.1 Busbar Trunking Market Size & Forecast, By Conductor, 2021 – 2032
9.2.6.2.2 Busbar Trunking Market Size & Forecast, By Power Rating, 2021 – 2032
9.2.6.2.3 Busbar Trunking Market Size & Forecast, By Insulation, 2021 – 2032
9.2.6.2.4 Busbar Trunking Market Size & Forecast, By End-User, 2021 – 2032
9.3 Europe
9.3.1 Key Trends
9.3.2 Busbar Trunking Market Size & Forecast, By Conductor, 2021 – 2032
9.3.3 Busbar Trunking Market Size & Forecast, By Power Rating, 2021 – 2032
9.3.4 Busbar Trunking Market Size & Forecast, By Insulation, 2021 – 2032
9.3.5 Busbar Trunking Market Size & Forecast, By End-User, 2021 – 2032
9.3.6 Busbar Trunking Market Size & Forecast, By Country, 2021 – 2032
9.3.6.1 Germany
9.3.6.1.1 Busbar Trunking Market Size & Forecast, By Conductor, 2021 – 2032
9.3.6.1.2 Busbar Trunking Market Size & Forecast, By Power Rating, 2021 – 2032
9.3.6.1.3 Busbar Trunking Market Size & Forecast, By Insulation, 2021 – 2032
9.3.6.1.4 Busbar Trunking Market Size & Forecast, By End-User, 2021 – 2032
9.3.6.2 UK
9.3.6.2.1 Busbar Trunking Market Size & Forecast, By Conductor, 2021 – 2032
9.3.6.2.2 Busbar Trunking Market Size & Forecast, By Power Rating, 2021 – 2032
9.3.6.2.3 Busbar Trunking Market Size & Forecast, By Insulation, 2021 – 2032
9.3.6.2.4 Busbar Trunking Market Size & Forecast, By End-User, 2021 – 2032
9.3.6.3 France
9.3.6.3.1 Busbar Trunking Market Size & Forecast, By Conductor, 2021 – 2032
9.3.6.3.2 Busbar Trunking Market Size & Forecast, By Power Rating, 2021 – 2032
9.3.6.3.3 Busbar Trunking Market Size & Forecast, By Insulation, 2021 – 2032
9.3.6.3.4 Busbar Trunking Market Size & Forecast, By End-User, 2021 – 2032
9.3.6.4 Italy
9.3.6.4.1 Busbar Trunking Market Size & Forecast, By Conductor, 2021 – 2032
9.3.6.4.2 Busbar Trunking Market Size & Forecast, By Power Rating, 2021 – 2032
9.3.6.4.3 Busbar Trunking Market Size & Forecast, By Insulation, 2021 – 2032
9.3.6.4.4 Busbar Trunking Market Size & Forecast, By End-User, 2021 – 2032
9.3.6.5 Spain
9.3.6.5.1 Busbar Trunking Market Size & Forecast, By Conductor, 2021 – 2032
9.3.6.5.2 Busbar Trunking Market Size & Forecast, By Power Rating, 2021 – 2032
9.3.6.5.3 Busbar Trunking Market Size & Forecast, By Insulation, 2021 – 2032
9.3.6.5.4 Busbar Trunking Market Size & Forecast, By End-User, 2021 – 2032
9.3.6.6 Russia
9.3.6.6.1 Busbar Trunking Market Size & Forecast, By Conductor, 2021 – 2032
9.3.6.6.2 Busbar Trunking Market Size & Forecast, By Power Rating, 2021 – 2032
9.3.6.6.3 Busbar Trunking Market Size & Forecast, By Insulation, 2021 – 2032
9.3.6.6.4 Busbar Trunking Market Size & Forecast, By End-User, 2021 – 2032
9.3.6.7 Poland
9.3.6.7.1 Busbar Trunking Market Size & Forecast, By Conductor, 2021 – 2032
9.3.6.7.2 Busbar Trunking Market Size & Forecast, By Power Rating, 2021 – 2032
9.3.6.7.3 Busbar Trunking Market Size & Forecast, By Insulation, 2021 – 2032
9.3.6.7.4 Busbar Trunking Market Size & Forecast, By End-User, 2021 – 2032
9.3.6.8 Rest of Europe
9.3.6.8.1 Busbar Trunking Market Size & Forecast, By Conductor, 2021 – 2032
9.3.6.8.2 Busbar Trunking Market Size & Forecast, By Power Rating, 2021 – 2032
9.3.6.8.3 Busbar Trunking Market Size & Forecast, By Insulation, 2021 – 2032
9.3.6.8.4 Busbar Trunking Market Size & Forecast, By End-User, 2021 – 2032
9.4 Asia-Pacific
9.4.1 Key Trends
9.4.2 Busbar Trunking Market Size & Forecast, By Conductor, 2021 – 2032
9.4.3 Busbar Trunking Market Size & Forecast, By Power Rating, 2021 – 2032
9.4.4 Busbar Trunking Market Size & Forecast, By Insulation, 2021 – 2032
9.4.5 Busbar Trunking Market Size & Forecast, By End-User, 2021 – 2032
9.4.6 Busbar Trunking Market Size & Forecast, By Country, 2021 – 2032
9.4.6.1 China
9.4.6.1.1 Busbar Trunking Market Size & Forecast, By Conductor, 2021 – 2032
9.4.6.1.2 Busbar Trunking Market Size & Forecast, By Power Rating, 2021 – 2032
9.4.6.1.3 Busbar Trunking Market Size & Forecast, By Insulation, 2021 – 2032
9.4.6.1.4 Busbar Trunking Market Size & Forecast, By End-User, 2021 – 2032
9.4.6.2 India
9.4.6.2.1 Busbar Trunking Market Size & Forecast, By Conductor, 2021 – 2032
9.4.6.2.2 Busbar Trunking Market Size & Forecast, By Power Rating, 2021 – 2032
9.4.6.2.3 Busbar Trunking Market Size & Forecast, By Insulation, 2021 – 2032
9.4.6.2.4 Busbar Trunking Market Size & Forecast, By End-User, 2021 – 2032
9.4.6.3 Japan
9.4.6.3.1 Busbar Trunking Market Size & Forecast, By Conductor, 2021 – 2032
9.4.6.3.2 Busbar Trunking Market Size & Forecast, By Power Rating, 2021 – 2032
9.4.6.3.3 Busbar Trunking Market Size & Forecast, By Insulation, 2021 – 2032
9.4.6.3.4 Busbar Trunking Market Size & Forecast, By End-User, 2021 – 2032
9.4.6.4 South Korea
9.4.6.4.1 Busbar Trunking Market Size & Forecast, By Conductor, 2021 – 2032
9.4.6.4.2 Busbar Trunking Market Size & Forecast, By Power Rating, 2021 – 2032
9.4.6.4.3 Busbar Trunking Market Size & Forecast, By Insulation, 2021 – 2032
9.4.6.4.4 Busbar Trunking Market Size & Forecast, By End-User, 2021 – 2032
9.4.6.5 Australia
9.4.6.5.1 Busbar Trunking Market Size & Forecast, By Conductor, 2021 – 2032
9.4.6.5.2 Busbar Trunking Market Size & Forecast, By Power Rating, 2021 – 2032
9.4.6.5.3 Busbar Trunking Market Size & Forecast, By Insulation, 2021 – 2032
9.4.6.5.4 Busbar Trunking Market Size & Forecast, By End-User, 2021 – 2032
9.4.6.6 ASEAN Countries
9.4.6.6.1 Busbar Trunking Market Size & Forecast, By Conductor, 2021 – 2032
9.4.6.6.2 Busbar Trunking Market Size & Forecast, By Power Rating, 2021 – 2032
9.4.6.6.3 Busbar Trunking Market Size & Forecast, By Insulation, 2021 – 2032
9.4.6.6.4 Busbar Trunking Market Size & Forecast, By End-User, 2021 – 2032
9.4.6.7 Rest of Asia-Pacific
9.4.6.7.1 Busbar Trunking Market Size & Forecast, By Conductor, 2021 – 2032
9.4.6.7.2 Busbar Trunking Market Size & Forecast, By Power Rating, 2021 – 2032
9.4.6.7.3 Busbar Trunking Market Size & Forecast, By Insulation, 2021 – 2032
9.4.6.7.4 Busbar Trunking Market Size & Forecast, By End-User, 2021 – 2032
9.5 Latin America
9.5.1 Key Trends
9.5.2 Busbar Trunking Market Size & Forecast, By Conductor, 2021 – 2032
9.5.3 Busbar Trunking Market Size & Forecast, By Power Rating, 2021 – 2032
9.5.4 Busbar Trunking Market Size & Forecast, By Insulation, 2021 – 2032
9.5.5 Busbar Trunking Market Size & Forecast, By End-User, 2021 – 2032
9.5.6 Busbar Trunking Market Size & Forecast, By Country, 2021 – 2032
9.5.6.1 Brazil
9.5.6.1.1 Busbar Trunking Market Size & Forecast, By Conductor, 2021 – 2032
9.5.6.1.2 Busbar Trunking Market Size & Forecast, By Power Rating, 2021 – 2032
9.5.6.1.3 Busbar Trunking Market Size & Forecast, By Insulation, 2021 – 2032
9.5.6.1.4 Busbar Trunking Market Size & Forecast, By End-User, 2021 – 2032
9.5.6.2 Argentina
9.5.6.2.1 Busbar Trunking Market Size & Forecast, By Conductor, 2021 – 2032
9.5.6.2.2 Busbar Trunking Market Size & Forecast, By Power Rating, 2021 – 2032
9.5.6.2.3 Busbar Trunking Market Size & Forecast, By Insulation, 2021 – 2032
9.5.6.2.4 Busbar Trunking Market Size & Forecast, By End-User, 2021 – 2032
9.5.6.3 Mexico
9.5.6.3.1 Busbar Trunking Market Size & Forecast, By Conductor, 2021 – 2032
9.5.6.3.2 Busbar Trunking Market Size & Forecast, By Power Rating, 2021 – 2032
9.5.6.3.3 Busbar Trunking Market Size & Forecast, By Insulation, 2021 – 2032
9.5.6.3.4 Busbar Trunking Market Size & Forecast, By End-User, 2021 – 2032
9.5.6.4 Colombia
9.5.6.4.1 Busbar Trunking Market Size & Forecast, By Conductor, 2021 – 2032
9.5.6.4.2 Busbar Trunking Market Size & Forecast, By Power Rating, 2021 – 2032
9.5.6.4.3 Busbar Trunking Market Size & Forecast, By Insulation, 2021 – 2032
9.5.6.4.4 Busbar Trunking Market Size & Forecast, By End-User, 2021 – 2032
9.5.6.5 Rest of Latin America
9.5.6.5.1 Busbar Trunking Market Size & Forecast, By Conductor, 2021 – 2032
9.5.6.5.2 Busbar Trunking Market Size & Forecast, By Power Rating, 2021 – 2032
9.5.6.5.3 Busbar Trunking Market Size & Forecast, By Insulation, 2021 – 2032
9.5.6.5.4 Busbar Trunking Market Size & Forecast, By End-User, 2021 – 2032
9.6 Middle East & Africa
9.6.1 Key Trends
9.6.2 Busbar Trunking Market Size & Forecast, By Conductor, 2021 – 2032
9.6.3 Busbar Trunking Market Size & Forecast, By Power Rating, 2021 – 2032
9.6.4 Busbar Trunking Market Size & Forecast, By Insulation, 2021 – 2032
9.6.5 Busbar Trunking Market Size & Forecast, By End-User, 2021 – 2032
9.6.6 Busbar Trunking Market Size & Forecast, By Country, 2021 – 2032
9.6.6.1 UAE
9.6.6.1.1 Busbar Trunking Market Size & Forecast, By Conductor, 2021 – 2032
9.6.6.1.2 Busbar Trunking Market Size & Forecast, By Power Rating, 2021 – 2032
9.6.6.1.3 Busbar Trunking Market Size & Forecast, By Insulation, 2021 – 2032
9.6.6.1.4 Busbar Trunking Market Size & Forecast, By End-User, 2021 – 2032
9.6.6.2 Saudi Arabia
9.6.6.2.1 Busbar Trunking Market Size & Forecast, By Conductor, 2021 – 2032
9.6.6.2.2 Busbar Trunking Market Size & Forecast, By Power Rating, 2021 – 2032
9.6.6.2.3 Busbar Trunking Market Size & Forecast, By Insulation, 2021 – 2032
9.6.6.2.4 Busbar Trunking Market Size & Forecast, By End-User, 2021 – 2032
9.6.6.3 Qatar
9.6.6.3.1 Busbar Trunking Market Size & Forecast, By Conductor, 2021 – 2032
9.6.6.3.2 Busbar Trunking Market Size & Forecast, By Power Rating, 2021 – 2032
9.6.6.3.3 Busbar Trunking Market Size & Forecast, By Insulation, 2021 – 2032
9.6.6.3.4 Busbar Trunking Market Size & Forecast, By End-User, 2021 – 2032
9.6.6.4 Egypt
9.6.6.4.1 Busbar Trunking Market Size & Forecast, By Conductor, 2021 – 2032
9.6.6.4.2 Busbar Trunking Market Size & Forecast, By Power Rating, 2021 – 2032
9.6.6.4.3 Busbar Trunking Market Size & Forecast, By Insulation, 2021 – 2032
9.6.6.4.4 Busbar Trunking Market Size & Forecast, By End-User, 2021 – 2032
9.6.6.5 South Africa
9.6.6.5.1 Busbar Trunking Market Size & Forecast, By Conductor, 2021 – 2032
9.6.6.5.2 Busbar Trunking Market Size & Forecast, By Power Rating, 2021 – 2032
9.6.6.5.3 Busbar Trunking Market Size & Forecast, By Insulation, 2021 – 2032
9.6.6.5.4 Busbar Trunking Market Size & Forecast, By End-User, 2021 – 2032
9.6.6.6 Rest of Middle East & Africa
9.6.6.6.1 Busbar Trunking Market Size & Forecast, By Conductor, 2021 – 2032
9.6.6.6.2 Busbar Trunking Market Size & Forecast, By Power Rating, 2021 – 2032
9.6.6.6.3 Busbar Trunking Market Size & Forecast, By Insulation, 2021 – 2032
9.6.6.6.4 Busbar Trunking Market Size & Forecast, By End-User, 2021 – 2032
10. Competitive Landscape
10.1 Key Players' Positioning
10.2 Competitive Developments
10.2.1 Key Strategies Adopted (%), By Key Players, 2024
10.2.2 Year-Wise Strategies & Development, 2021 – 2025
10.2.3 Number Of Strategies Adopted By Key Players, 2024
10.3 Market Share Analysis, 2024
10.4 Product/Service & Application Benchmarking
10.4.1 Product/Service Specifications & Features By Key Players
10.4.2 Product/Service Heatmap By Key Players
10.4.3 Application Heatmap By Key Players
10.5 Industry Start-Up & Innovation Landscape
10.6 Key Company Profiles
10.6.1 ABB Ltd.
10.6.1.1 Company Overview & Snapshot
10.6.1.2 Product/Service Portfolio
10.6.1.3 Key Company Financials
10.6.1.4 SWOT Analysis
10.6.2 Siemens AG
10.6.2.1 Company Overview & Snapshot
10.6.2.2 Product/Service Portfolio
10.6.2.3 Key Company Financials
10.6.2.4 SWOT Analysis
10.6.3 Schneider Electric SE
10.6.3.1 Company Overview & Snapshot
10.6.3.2 Product/Service Portfolio
10.6.3.3 Key Company Financials
10.6.3.4 SWOT Analysis
10.6.4 Eaton Corporation PLC
10.6.4.1 Company Overview & Snapshot
10.6.4.2 Product/Service Portfolio
10.6.4.3 Key Company Financials
10.6.4.4 SWOT Analysis
10.6.5 General Electric Company (GE)
10.6.5.1 Company Overview & Snapshot
10.6.5.2 Product/Service Portfolio
10.6.5.3 Key Company Financials
10.6.5.4 SWOT Analysis
10.6.6 Legrand SA
10.6.6.1 Company Overview & Snapshot
10.6.6.2 Product/Service Portfolio
10.6.6.3 Key Company Financials
10.6.6.4 SWOT Analysis
10.6.7 Larsen & Toubro Limited
10.6.7.1 Company Overview & Snapshot
10.6.7.2 Product/Service Portfolio
10.6.7.3 Key Company Financials
10.6.7.4 SWOT Analysis
10.6.8 C&S Electric Ltd.
10.6.8.1 Company Overview & Snapshot
10.6.8.2 Product/Service Portfolio
10.6.8.3 Key Company Financials
10.6.8.4 SWOT Analysis
10.6.9 Godrej & Boyce Manufacturing Co. Ltd.
10.6.9.1 Company Overview & Snapshot
10.6.9.2 Product/Service Portfolio
10.6.9.3 Key Company Financials
10.6.9.4 SWOT Analysis
10.6.10 Rittal GmbH & Co. KG
10.6.10.1 Company Overview & Snapshot
10.6.10.2 Product/Service Portfolio
10.6.10.3 Key Company Financials
10.6.10.4 SWOT Analysis
10.6.11 Anord Mardix Group
10.6.11.1 Company Overview & Snapshot
10.6.11.2 Product/Service Portfolio
10.6.11.3 Key Company Financials
10.6.11.4 SWOT Analysis
10.6.12 E+I Engineering Ltd.
10.6.12.1 Company Overview & Snapshot
10.6.12.2 Product/Service Portfolio
10.6.12.3 Key Company Financials
10.6.12.4 SWOT Analysis
10.6.13 Megabarre Group
10.6.13.1 Company Overview & Snapshot
10.6.13.2 Product/Service Portfolio
10.6.13.3 Key Company Financials
10.6.13.4 SWOT Analysis
10.6.14 NAXSO S.r.l.
10.6.14.1 Company Overview & Snapshot
10.6.14.2 Product/Service Portfolio
10.6.14.3 Key Company Financials
10.6.14.4 SWOT Analysis
10.6.15 Pogliano Busbar S.r.l.
10.6.15.1 Company Overview & Snapshot
10.6.15.2 Product/Service Portfolio
10.6.15.3 Key Company Financials
10.6.15.4 SWOT Analysis
10.6.16 DBTS Industries Sdn Bhd
10.6.16.1 Company Overview & Snapshot
10.6.16.2 Product/Service Portfolio
10.6.16.3 Key Company Financials
10.6.16.4 SWOT Analysis
10.6.17 EAE Elektrik
10.6.17.1 Company Overview & Snapshot
10.6.17.2 Product/Service Portfolio
10.6.17.3 Key Company Financials
10.6.17.4 SWOT Analysis
10.6.18 P&S Power Technologies Ltd.
10.6.18.1 Company Overview & Snapshot
10.6.18.2 Product/Service Portfolio
10.6.18.3 Key Company Financials
10.6.18.4 SWOT Analysis
10.6.19 Cuthbertson Laird Group
10.6.19.1 Company Overview & Snapshot
10.6.19.2 Product/Service Portfolio
10.6.19.3 Key Company Financials
10.6.19.4 SWOT Analysis
10.6.20 Mersen Property
10.6.20.1 Company Overview & Snapshot
10.6.20.2 Product/Service Portfolio
10.6.20.3 Key Company Financials
10.6.20.4 SWOT Analysis
11. Analyst Recommendations
11.1 SNS Insider Opportunity Map
11.2 Industry Low-Hanging Fruit Assessment
11.3 Market Entry & Growth Strategy
11.4 Analyst Viewpoint & Suggestions On Market Growth
12. Assumptions
13. Disclaimer
14. Appendix
14.1 List Of Tables
14.2 List Of Figures
Key Segments:
By Conductor
-
Copper
-
Aluminium
By Power Rating
-
Lighting
-
Low
-
Medium
-
High
By Insulation
-
Air
-
Sandwich
By End-User
-
Residential
-
Commercial
-
Industrial
-
Others
Request for Segment Customization as per your Business Requirement: Segment Customization Request
Regional Coverage:
North America
-
US
-
Canada
Europe
-
Germany
-
UK
-
France
-
Italy
-
Spain
-
Russia
-
Poland
-
Rest of Europe
Asia Pacific
-
China
-
India
-
Japan
-
South Korea
-
Australia
-
ASEAN Countries
-
Rest of Asia Pacific
Middle East & Africa
-
UAE
-
Saudi Arabia
-
Qatar
-
South Africa
-
Rest of Middle East & Africa
Latin America
-
Brazil
-
Argentina
-
Mexico
-
Colombia
-
Rest of Latin America
Request for Country Level Research Report: Country Level Customization Request
Available Customization
With the given market data, SNS Insider offers customization as per the company’s specific needs. The following customization options are available for the report:
-
Detailed Volume Analysis
-
Criss-Cross segment analysis (e.g. Product X Application)
-
Competitive Product Benchmarking
-
Geographic Analysis
-
Additional countries in any of the regions
-
Customized Data Representation
-
Detailed analysis and profiling of additional market players
An accurate research report requires proper strategizing as well as implementation. There are multiple factors involved in the completion of good and accurate research report and selecting the best methodology to compete the research is the toughest part. Since the research reports we provide play a crucial role in any company’s decision-making process, therefore we at SNS Insider always believe that we should choose the best method which gives us results closer to reality. This allows us to reach at a stage wherein we can provide our clients best and accurate investment to output ratio.
Each report that we prepare takes a timeframe of 350-400 business hours for production. Starting from the selection of titles through a couple of in-depth brain storming session to the final QC process before uploading our titles on our website we dedicate around 350 working hours. The titles are selected based on their current market cap and the foreseen CAGR and growth.
The 5 steps process:
Step 1: Secondary Research:
Secondary Research or Desk Research is as the name suggests is a research process wherein, we collect data through the readily available information. In this process we use various paid and unpaid databases which our team has access to and gather data through the same. This includes examining of listed companies’ annual reports, Journals, SEC filling etc. Apart from this our team has access to various associations across the globe across different industries. Lastly, we have exchange relationships with various university as well as individual libraries.

Step 2: Primary Research
When we talk about primary research, it is a type of study in which the researchers collect relevant data samples directly, rather than relying on previously collected data. This type of research is focused on gaining content specific facts that can be sued to solve specific problems. Since the collected data is fresh and first hand therefore it makes the study more accurate and genuine.
We at SNS Insider have divided Primary Research into 2 parts.
Part 1 wherein we interview the KOLs of major players as well as the upcoming ones across various geographic regions. This allows us to have their view over the market scenario and acts as an important tool to come closer to the accurate market numbers. As many as 45 paid and unpaid primary interviews are taken from both the demand and supply side of the industry to make sure we land at an accurate judgement and analysis of the market.
This step involves the triangulation of data wherein our team analyses the interview transcripts, online survey responses and observation of on filed participants. The below mentioned chart should give a better understanding of the part 1 of the primary interview.

Part 2: In this part of primary research the data collected via secondary research and the part 1 of the primary research is validated with the interviews from individual consultants and subject matter experts.
Consultants are those set of people who have at least 12 years of experience and expertise within the industry whereas Subject Matter Experts are those with at least 15 years of experience behind their back within the same space. The data with the help of two main processes i.e., FGDs (Focused Group Discussions) and IDs (Individual Discussions). This gives us a 3rd party nonbiased primary view of the market scenario making it a more dependable one while collation of the data pointers.
Step 3: Data Bank Validation
Once all the information is collected via primary and secondary sources, we run that information for data validation. At our intelligence centre our research heads track a lot of information related to the market which includes the quarterly reports, the daily stock prices, and other relevant information. Our data bank server gets updated every fortnight and that is how the information which we collected using our primary and secondary information is revalidated in real time.

Step 4: QA/QC Process
After all the data collection and validation our team does a final level of quality check and quality assurance to get rid of any unwanted or undesired mistakes. This might include but not limited to getting rid of the any typos, duplication of numbers or missing of any important information. The people involved in this process include technical content writers, research heads and graphics people. Once this process is completed the title gets uploader on our platform for our clients to read it.
Step 5: Final QC/QA Process:
This is the last process and comes when the client has ordered the study. In this process a final QA/QC is done before the study is emailed to the client. Since we believe in giving our clients a good experience of our research studies, therefore, to make sure that we do not lack at our end in any way humanly possible we do a final round of quality check and then dispatch the study to the client.