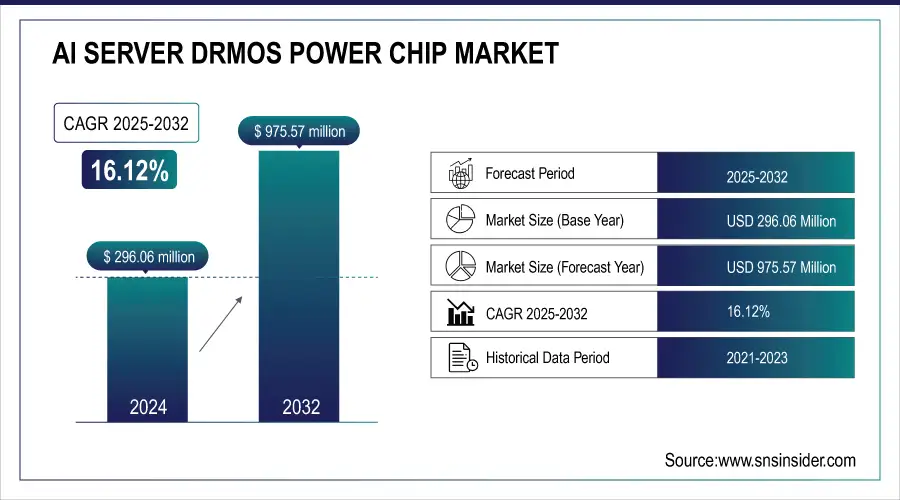
The AI Server DrMos Power Chip Market size was valued at USD 296.06 million in 2024 and is expected to reach USD 975.57 million by 2032, growing at a CAGR of 16.12% over the forecast period of 2025-2032. Factors, such as increasing adoption of AI servers, higher demand for high-efficiency power management, growing data center deployments, and greater technology development in GPU/accelerator architectures are driving DrMOS power chip market growth.
Growth of AI and machine learning workloads, coupled with the need for high-performance servers with effective power delivery solutions, drives the AI Server DrMOS Power Chip Market trends. Data centers need higher-density power management to scale up to drive new applications, such as generative AI, edge, and autonomous systems. Reserved for the AI workloads, DrMOS chips will continue to be an engine for cooling performance, higher power density, and lower heat at higher energy efficiency than conventional ISL chips and FETs, and they are best suited for the AI server architecture that integrates GPUs, FPGAs, and other maximum acceleration accelerators.
Data centers consumed approximately 460 terawatt-hours (TWh) globally in 2023 (IEA), and this is expected to nearly double by 2026, largely due to AI workloads.
Power density requirements in AI racks have exceeded 50 kW/rack in many hyperscale facilities.
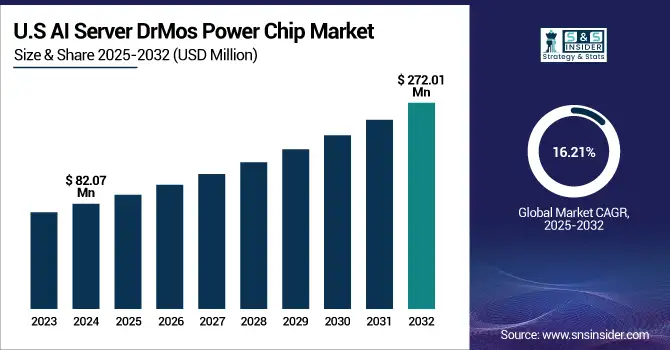
The U.S. AI Server DrMos Power Chip market size is estimated to be valued at USD 82.07 million in 2024 and is projected to grow at a CAGR of 16.21%, reaching USD 272.01 million by 2032. The U.S. AI Server DrMOS Power Chip Market growth is driven by increasing investment in AI, expansion of hyper-scale data centers, energy-efficient power delivery demand, and integration of High-End GPUs and Accelerators.
Key Drivers:
Rising Demand for Compact Thermally Optimized DrMOS Power Chips Fuels AI Server DrMos Power Chip Market Growth
Demand for highly efficient and high-density power delivery solutions for localized applications for AI and machine learning workloads is driving the AI Server DrMOS Power Chip market. To meet the growing demand for small-sized and thermally optimized DrMOS chips due to the rapid growth of hyperscale data centers and the integration of advanced GPUs, FPGAs, and AI accelerators in server architectures. In addition, DrMOS plays a significant role in AI infrastructure as the demand for server power density continues to rise due to increased utilization of generative AI, edge computing, and autonomous technologies.
For instance, DrMOS (Driver-MOSFET modules) integrate high-side/low-side FETs and drivers into a single chip, reducing power losses by 15%–20% and saving up to 30% PCB space compared to discrete solutions.
Restraints:
AI Server DrMOS Power Chip Faces Thermal Challenges Compatibility Issues and Global Supply Chain Constraints
The AI Server DrMOS Power Chip market faces technical challenges such as thermal management complexities. As AI servers require more current and power density, thermal management can be a fine line between component performance degradation and reliability. Moreover, the fast pace of innovation in AI hardware leads to compatibility issues, making DrMOS solutions have to evolve day by day to support various architectures using GPUs, FPGAs, and ASICs. Meanwhile, global supply chain constraints, from a scarcity of specialized semiconductor materials to personal components, continue to make it difficult for chips to be made and scale quickly.
Opportunities:
Emerging Markets Drive Growth for Miniaturized High Efficiency DrMOS Power Solutions in AI Servers
There is massive untapped potential in emerging economies, particularly in the Asia-Pacific and Latin America, strewn with increasing digitalization and investments in artificial intelligence infrastructure. Finally, the trend toward edge AI and on-device computing will open new markets for miniaturized and high-efficiency power solutions, such as DrMOS. Novel chip packaging, higher currents, and thermal management developments also widen opportunities for capability in advanced applications for next-generation AI server architecture.
Governments in India and Southeast Asia are investing heavily in AI. For example, India’s National AI Strategy aims to boost AI adoption across sectors with a USD 1.3 billion funding commitment
Asia-Pacific accounts for over 60% of global internet users as of 2024, driving digital transformation and AI adoption
Challenges:
Challenges in Miniaturized DrMOS Designs Include Cooling Power Delivery and Regional AI Infrastructure Gaps
The big challenge is using DrMOS in smaller and smaller server designs that offer less room to implement adequate cooling and power delivery solutions. In addition, ensuring adequate performance while maintaining low power consumption require design sophistication and testing to prevent failures in critical AI workloads. One possible reason is that the multi-phase power delivery systems required for heterogenous AI accelerators are more complicated to design and validate, which in turn, prolongs their development cycles. At last, due to the increasing growth of AI, regional inequalities exist in technological infrastructure, particularly in emerging markets, which serve as adoption hurdles.
By Type
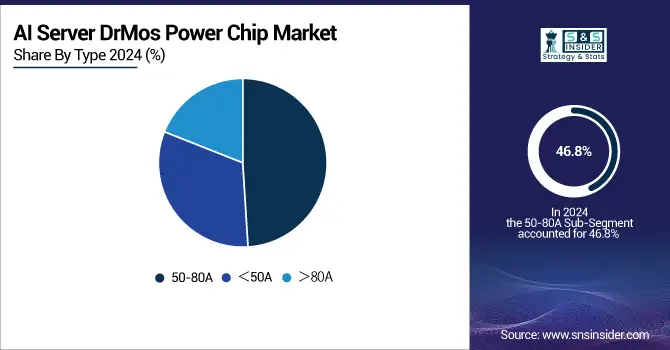
The AI Server DrMOS Power Chip market share was mainly occupied by the 50-80A DrMOS power chip segment, which contributed around 46.8% to the overall market in 2024. The reason for this dominance stems from the need for well-balanced power delivery solutions that provide an optimal combination of efficiency and current capacity needed for mainstream AI server configurations quite common nowadays.
The >80A DrMOS chip segment is expected to register the highest growth during 2025-2032. The growth is driven by the high-powered AI servers needing multiple GPUs and other accelerated workloads requiring higher current levels. With semiconductor technology and thermal solutions evolving to achieve higher power density and better energy efficiency, these chips are becoming critical components of next-generation AI infrastructure.
By Application
The CPU+GPU server segment accounted for the largest share of 51.4% in the AI Server DrMOS Power Chip market across the globe in 2024. The reason for this dominance is that AI utilizes GPUs for most of its use cases as they are designed for parallel processing required for training and inference tasks in Machine learning. CPU+GPU servers are still the backbone of most AI data centers due to their maturity in technology and ecosystem, and good performance in varied AI scenarios.
During 2025-2032, the fastest-growing segment of the market is likely to be the CPU+Multiple Accelerator Card Servers. With the complexity of AI workloads growing and their need for heterogeneous computing architecture, using GPUs, FPGAs, ASICs, and other accelerators, this growth is not only a storm in a teacup but creating massive ripples in the industry. Multi-accelerator servers require sophisticated power management solutions, such as DrMOS chips that deliver high current and efficient, stable power delivery to a variety of components.
AI Server DrMos Power Chip Market Regional Overview:
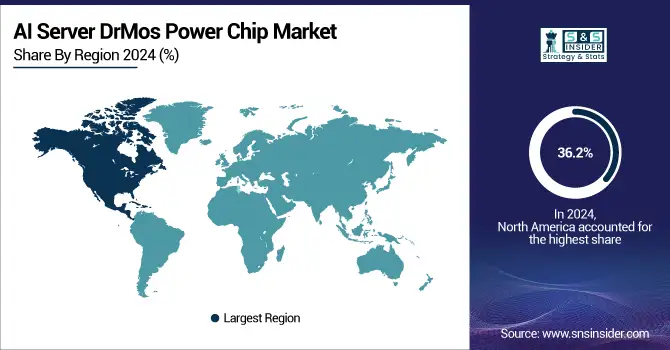
The North America AI Server DrMOS Power Chip market held the largest share at 36.2% in 2024 due to its technological advancement and interactive adoption in AI technologies. Home to many hyperscale data centres and top-tier cloud service providers who are upgrading their servers with AI, the region generates strong demand for smart power management solutions. Solid R&D capabilities and joint development between semiconductor companies and AI hardware manufacturers can speed up innovation in high-current DrMOS chips. Moreover, strict energy efficiency standards and the movement towards green data centers drive the need for power-efficient components.
With its advanced AI research, massive hyperscale data centers, and dominant semiconductor industry, the U.S. ruled North America. Increasing adoption of artificial intelligence (AI), investment in cloud infrastructure, and the growing need for high performance and energy-efficient power management solutions, such as DrMOS chips, are fueling growth.
The AI Server DrMOS Power Chip market share in Asia Pacific is expected to grow rapidly, at a CAGR of 16.7% during the forecast period of 2025-2032. The fast growth is driven by investments in AI technological infrastructure, increasing data center developments, and widespread digital transformation from verticals. With both public and private efforts aimed at enhancing AI capabilities in the region, it is quickly turning into an international hotspot for semiconductor manufacturing. The increasing proliferation of AI-powered applications, including smart cities, autonomous systems, and industrial automation, is driving demand for high-efficiency power delivery solutions, such as DrMOS.
The Asia Pacific market was led by China, on the back of its extensive AI investments, coupled with a fast-growing data center footprint and domestic semiconductor ecosystem. It is primarily driven by increasing AI adoption across various industry verticals, government initiatives, and demand for high-efficiency computing infrastructure.
The AI Server DrMos Power Chip market in Europe has principally benefited from the rising trend toward energy-efficient solutions for various applications, such as automotive electronics, industrial automation, and renewable energy. With growing sustainability efforts in the region, joined with fast-paced advancements in electric vehicles and smart grid technologies, Europe has become significant for power management, as these developments are increasing the need for energy-efficient solutions.
The impressive industrial base in Germany, the traditional AI adoption in manufacturing and automotive sectors, and heavy investment in the data center infrastructure made Germany the leader of the European market.
Latin America and the Middle East & Africa show potential for the AI server DrMOS Power Chip market, driven by the growing rate of digitalization and the rising number of investments in data centers and AI infrastructure. The rising cloud adoption along with the emergence of AI servers driven by government initiatives and smart city initiatives, is aiding AI servers’ deployment, resulting in wider adoption of power management solutions to enhance efficiency. These regions are still at an early-stage relative to mature markets, but they are opening up large opportunities as they adopt cost-effective compute architectures and AI-driven technologies.
Some of the major AI Server DrMos Power Chips companies are Infineon, Texas Instruments, Renesas, onsemi, Alpha & Omega, Vishay, ROHM, Diodes Inc., Monolithic Power Systems, and STMicroelectronics.
In May 2024, Infineon introduced 8kW and 12kW high-efficiency PSUs for AI data centers, reaching up to 97.5% efficiency. These solutions aim to cut CO₂ emissions and meet rising AI server power demands.
In January 2025, Alpha and Omega Semiconductor (AOS) launched the AOZ73004CQI, the first four-phase PWM controller optimized for NVIDIA Blackwell GPUs and DrMOS technology. This controller enhances power efficiency and ripple reduction in AI servers and graphics cards.
Report Attributes | Details |
---|---|
Market Size in 2024 | USD 296.06 Million |
Market Size by 2032 | USD 975.57 Million |
CAGR | CAGR of 16.12% From 2025 to 2032 |
Base Year | 2024 |
Forecast Period | 2025-2032 |
Historical Data | 2021-2023 |
Report Scope & Coverage | Market Size, Segments Analysis, Competitive Landscape, Regional Analysis, DROC & SWOT Analysis, Forecast Outlook |
Key Segments | • By Type (<50A, 50-80A, and >80A) • By Application (CPU+GPU Server, CPU+FPGA Server, CPU+Multiple Accelerator Card Servers, and Others) |
Regional Analysis/Coverage | North America (US, Canada, Mexico), Europe (Germany, France, UK, Italy, Spain, Poland, Turkey, Rest of Europe), Asia Pacific (China, India, Japan, South Korea, Singapore, Australia, Taiwan, Rest of Asia Pacific), Middle East & Africa (UAE, Saudi Arabia, Qatar, South Africa, Rest of Middle East & Africa), Latin America (Brazil, Argentina, Rest of Latin America) |
Company Profiles | Infineon, Texas Instruments, Renesas, onsemi, Alpha & Omega, Vishay, ROHM, Diodes Inc., Monolithic Power Systems, and STMicroelectronics. |
Ans: The AI Server DrMos Power Chip Market is expected to grow at a CAGR of 16.12% from 2025-2032.
Ans: The AI Server DrMos Power Chip Market size was USD 296.06 million in 2024 and is expected to reach USD 975.57 million by 2032.
Ans: The major growth factor of the AI Server DrMOS Power Chip market is the rising demand for high-efficiency, compact power solutions driven by the expansion of AI workloads and hyperscale data centers.
Ans: The 50-80A segment dominated the AI Server DrMos Power Chip Market in 2024.
Ans: North America dominated the AI Server DrMos Power Chip Market in 2024.
1. Introduction
1.1 Market Definition
1.2 Scope (Inclusion and Exclusions)
1.3 Research Assumptions
2. Executive Summary
2.1 Market Overview
2.2 Regional Synopsis
2.3 Competitive Summary
3. Research Methodology
3.1 Top-Down Approach
3.2 Bottom-up Approach
3.3. Data Validation
3.4 Primary Interviews
4. Market Dynamics Impact Analysis
4.1 Market Driving Factors Analysis
4.1.2 Drivers
4.1.2 Restraints
4.1.3 Opportunities
4.1.4 Challenges
4.2 PESTLE Analysis
4.3 Porter’s Five Forces Model
5. Statistical Insights and Trends Reporting
5.1 Power Consumption Trends in AI Servers
5.2 Thermal Management Statistics
5.3 AI Server Deployment Volume Growth
5.4 Integration Density and Miniaturization
6. Competitive Landscape
6.1 List of Major Companies, By Region
6.2 Market Share Analysis, By Region
6.3 Product Benchmarking
6.3.1 Product specifications and features
6.3.2 Pricing
6.4 Strategic Initiatives
6.4.1 Marketing and promotional activities
6.4.2 Distribution and supply chain strategies
6.4.3 Expansion plans and new product launches
6.4.4 Strategic partnerships and collaborations
6.5 Technological Advancements
6.6 Market Positioning and Branding
7. AI Server DrMos Power Chip Market Segmentation, by Type
7.1 Chapter Overview
7.2 <50A
7.2.1 <50A Market Trends Analysis (2021-2032)
7.2.2 <50A Market Size Estimates and Forecasts to 2032 (USD Million)
7.3 50-80A
7.3.1 50-80A Market Trends Analysis (2021-2032)
7.3.2 50-80A Market Size Estimates and Forecasts to 2032 (USD Million)
7.4 >80A
7.4.1 >80A Market Trends Analysis (2021-2032)
7.4.2 >80A Market Size Estimates and Forecasts to 2032 (USD Million)
8. AI Server DrMos Power Chip Market Segmentation, by Application
8.1 Chapter Overview
8.2 CPU+GPU Server
8.2.1 CPU+GPU Server Market Trends Analysis (2021-2032)
8.2.2 CPU+GPU Server Market Size Estimates and Forecasts to 2032 (USD Million)
8.3 CPU+FPGA Server
8.3. CPU+FPGA Server Market Trends Analysis (2021-2032)
8.3.2 CPU+FPGA Server Market Size Estimates and Forecasts to 2032 (USD Million)
8.4 CPU+Multiple Accelerator Card Servers
8.4.1 CPU+Multiple Accelerator Card Servers Market Trends Analysis (2021-2032)
8.4.2 CPU+Multiple Accelerator Card Servers Market Size Estimates and Forecasts to 2032 (USD Million)
8.5 Other End-user Industry Applications
8.5.1 Other End-user Industry Applications Market Trends Analysis (2021-2032)
8.5.2 Other End-user Industry Applications Market Size Estimates and Forecasts to 2032 (USD Million)
9. Regional Analysis
9.1 Chapter Overview
9.2 North America
9.2.1 Trends Analysis
9.2.2 North America AI Server DrMos Power Chip Market Estimates and Forecasts, by Country (2021-2032) (USD Million)
9.2.3 North America AI Server DrMos Power Chip Market Estimates and Forecasts, by Type (2021-2032) (USD Million)
9.2.4 North America AI Server DrMos Power Chip Market Estimates and Forecasts, by Application (2021-2032) (USD Million)
9.2.5 USA
9.2.5.1 USA AI Server DrMos Power Chip Market Estimates and Forecasts, by Type (2021-2032) (USD Million)
9.2.5.2 USA AI Server DrMos Power Chip Market Estimates and Forecasts, by Application (2021-2032) (USD Million)
9.2.6 Canada
9.2.6.1 Canada AI Server DrMos Power Chip Market Estimates and Forecasts, by Type (2021-2032) (USD Million)
9.2.6.2 Canada AI Server DrMos Power Chip Market Estimates and Forecasts, by Application (2021-2032) (USD Million)
9.2.7 Mexico
9.2.7.1 Mexico AI Server DrMos Power Chip Market Estimates and Forecasts, by Type (2021-2032) (USD Million)
9.2.7.2 Mexico AI Server DrMos Power Chip Market Estimates and Forecasts, by Application (2021-2032) (USD Million)
9.3 Europe
9.3.1 Trends Analysis
9.3.2 Europe AI Server DrMos Power Chip Market Estimates and Forecasts, by Country (2021-2032) (USD Million)
9.3.3 Europe AI Server DrMos Power Chip Market Estimates and Forecasts, by Type (2021-2032) (USD Million)
9.3.4 Europe AI Server DrMos Power Chip Market Estimates and Forecasts, by Application (2021-2032) (USD Million)
9.3.5 Germany
9.3.5.1 Germany AI Server DrMos Power Chip Market Estimates and Forecasts, by Type (2021-2032) (USD Million)
9.3.5.2 Germany AI Server DrMos Power Chip Market Estimates and Forecasts, by Application (2021-2032) (USD Million)
9.3.6 France
9.3.6.1 France AI Server DrMos Power Chip Market Estimates and Forecasts, by Type (2021-2032) (USD Million)
9.3.6.2 France AI Server DrMos Power Chip Market Estimates and Forecasts, by Application (2021-2032) (USD Million)
9.3.7 UK
9.3.7.1 UK AI Server DrMos Power Chip Market Estimates and Forecasts, by Type (2021-2032) (USD Million)
9.3.7.2 UK AI Server DrMos Power Chip Market Estimates and Forecasts, by Application (2021-2032) (USD Million)
9.3.8 Italy
9.3.8.1 Italy AI Server DrMos Power Chip Market Estimates and Forecasts, by Type (2021-2032) (USD Million)
9.3.8.2 Italy AI Server DrMos Power Chip Market Estimates and Forecasts, by Application (2021-2032) (USD Million)
9.3.9 Spain
9.3.9.1 Spain AI Server DrMos Power Chip Market Estimates and Forecasts, by Type (2021-2032) (USD Million)
9.3.9.2 Spain AI Server DrMos Power Chip Market Estimates and Forecasts, by Application (2021-2032) (USD Million)
9.3.10 Poland
9.3.10.1 Poland AI Server DrMos Power Chip Market Estimates and Forecasts, by Type (2021-2032) (USD Million)
9.3.10.2 Poland AI Server DrMos Power Chip Market Estimates and Forecasts, by Application (2021-2032) (USD Million)
9.3.11 Turkey
9.3.11.1 France AI Server DrMos Power Chip Market Estimates and Forecasts, by Type (2021-2032) (USD Million)
9.3.11.2 France AI Server DrMos Power Chip Market Estimates and Forecasts, by Application (2021-2032) (USD Million)
9.3.12 Rest of Europe
9.3.12.1 UK AI Server DrMos Power Chip Market Estimates and Forecasts, by Type (2021-2032) (USD Million)
9.3.12.2 UK AI Server DrMos Power Chip Market Estimates and Forecasts, by Application (2021-2032) (USD Million)
9.4 Asia-Pacific
9.4.1 Trends Analysis
9.4.2 Asia-Pacific AI Server DrMos Power Chip Market Estimates and Forecasts, by Country (2021-2032) (USD Million)
9.4.3 Asia-Pacific AI Server DrMos Power Chip Market Estimates and Forecasts, by Type (2021-2032) (USD Million)
9.4.4 Asia-Pacific AI Server DrMos Power Chip Market Estimates and Forecasts, by Application (2021-2032) (USD Million)
9.4.5 China
9.4.5.1 China AI Server DrMos Power Chip Market Estimates and Forecasts, by Type (2021-2032) (USD Million)
9.4.5.2 China AI Server DrMos Power Chip Market Estimates and Forecasts, by Application (2021-2032) (USD Million)
9.4.6 India
9.4.5.1 India AI Server DrMos Power Chip Market Estimates and Forecasts, by Type (2021-2032) (USD Million)
9.4.5.2 India AI Server DrMos Power Chip Market Estimates and Forecasts, by Application (2021-2032) (USD Million)
9.4.5 Japan
9.4.5.1 Japan AI Server DrMos Power Chip Market Estimates and Forecasts, by Type (2021-2032) (USD Million)
9.4.5.2 Japan AI Server DrMos Power Chip Market Estimates and Forecasts, by Application (2021-2032) (USD Million)
9.4.6 South Korea
9.4.6.1 South Korea AI Server DrMos Power Chip Market Estimates and Forecasts, by Type (2021-2032) (USD Million)
9.4.6.2 South Korea AI Server DrMos Power Chip Market Estimates and Forecasts, by Application (2021-2032) (USD Million)
9.4.7 Singapore
9.4.7.1 Singapore AI Server DrMos Power Chip Market Estimates and Forecasts, by Type (2021-2032) (USD Million)
9.4.7.2 Singapore AI Server DrMos Power Chip Market Estimates and Forecasts, by Application (2021-2032) (USD Million)
9.4.8 Australia
9.4.8.1 Australia AI Server DrMos Power Chip Market Estimates and Forecasts, by Type (2021-2032) (USD Million)
9.4.8.2 Australia AI Server DrMos Power Chip Market Estimates and Forecasts, by Application (2021-2032) (USD Million)
9.4.9 Taiwan
9.4.9.1 Taiwan AI Server DrMos Power Chip Market Estimates and Forecasts, by Type (2021-2032) (USD Million)
9.4.9.2 Taiwan AI Server DrMos Power Chip Market Estimates and Forecasts, by Application (2021-2032) (USD Million)
9.4.10 Rest of Asia-Pacific
9.4.10.1 Rest of Asia-Pacific AI Server DrMos Power Chip Market Estimates and Forecasts, by Type (2021-2032) (USD Million)
9.4.10.2 Rest of Asia-Pacific AI Server DrMos Power Chip Market Estimates and Forecasts, by Application (2021-2032) (USD Million)
9.5 Middle East and Africa
9.5.1 Trends Analysis
9.5.2 Middle East and Africa AI Server DrMos Power Chip Market Estimates and Forecasts, by Country (2021-2032) (USD Million)
9.5.3 Middle East and Africa AI Server DrMos Power Chip Market Estimates and Forecasts, by Type (2021-2032) (USD Million)
9.5.4 Middle East and Africa AI Server DrMos Power Chip Market Estimates and Forecasts, by Application (2021-2032) (USD Million)
9.5.5 UAE
9.5.5.1 UAE AI Server DrMos Power Chip Market Estimates and Forecasts, by Type (2021-2032) (USD Million)
9.5.5.2 UAE AI Server DrMos Power Chip Market Estimates and Forecasts, by Application (2021-2032) (USD Million)
9.5.6 Saudi Arabia
9.5.6.1 Saudi Arabia AI Server DrMos Power Chip Market Estimates and Forecasts, by Type (2021-2032) (USD Million)
9.5.6.2 Saudi Arabia AI Server DrMos Power Chip Market Estimates and Forecasts, by Application (2021-2032) (USD Million)
9.5.7 Qatar
9.5.7.1 Qatar AI Server DrMos Power Chip Market Estimates and Forecasts, by Type (2021-2032) (USD Million)
9.5.7.2 Qatar AI Server DrMos Power Chip Market Estimates and Forecasts, by Application (2021-2032) (USD Million)
9.5.8 South Africa
9.5.8.1 South Africa AI Server DrMos Power Chip Market Estimates and Forecasts, by Type (2021-2032) (USD Million)
9.5.8.2 South Africa AI Server DrMos Power Chip Market Estimates and Forecasts, by Application (2021-2032) (USD Million)
9.5.9 Rest of Middle East & Africa
9.5.9.1 Rest of Middle East & Africa AI Server DrMos Power Chip Market Estimates and Forecasts, by Type (2021-2032) (USD Million)
9.5.9.2 Rest of Middle East & Africa AI Server DrMos Power Chip Market Estimates and Forecasts, by Application (2021-2032) (USD Million)
9.6 Latin America
9.6.1 Trends Analysis
9.6.2 Latin America AI Server DrMos Power Chip Market Estimates and Forecasts, by Country (2021-2032) (USD Million)
9.6.3 Latin America AI Server DrMos Power Chip Market Estimates and Forecasts, by Type (2021-2032) (USD Million)
9.6.4 Latin America AI Server DrMos Power Chip Market Estimates and Forecasts, by Application (2021-2032) (USD Million)
9.6.5 Brazil
9.6.5.1 Brazil AI Server DrMos Power Chip Market Estimates and Forecasts, by Type (2021-2032) (USD Million)
9.6.5.2 Brazil AI Server DrMos Power Chip Market Estimates and Forecasts, by Application (2021-2032) (USD Million)
9.6.6 Argentina
9.6.6.1 Argentina AI Server DrMos Power Chip Market Estimates and Forecasts, by Type (2021-2032) (USD Million)
9.6.6.2 Argentina AI Server DrMos Power Chip Market Estimates and Forecasts, by Application (2021-2032) (USD Million)
9.6.7 Rest of Latin America
9.6.7.1 Rest of Latin America AI Server DrMos Power Chip Market Estimates and Forecasts, by Type (2021-2032) (USD Million)
9.6.7.2 Rest of Latin America AI Server DrMos Power Chip Market Estimates and Forecasts, by Application (2021-2032) (USD Million)
10. Company Profiles
10.1 Infineon Technologies AG
10.1.1 Company Overview
10.1.2 Financial
10.1.3 Products/ Services Offered
10.1.4 SWOT Analysis
10.2 Texas Instruments Incorporated.
10.2.1 Company Overview
10.2.2 Financial
10.2.3 Products/ Services Offered
10.2.4 SWOT Analysis
10.3 Renesas Electronics Corporation
10.3.1 Company Overview
10.3.2 Financial
10.3.3 Products/ Services Offered
10.3.4 SWOT Analysis
10.4 ON Semiconductor.
10.4.1 Company Overview
10.4.2 Financial
10.4.3 Products/ Services Offered
10.4.4 SWOT Analysis
10.5 Alpha & Omega Semiconductor
10.5.1 Company Overview
10.5.2 Financial
10.5.3 Products/ Services Offered
10.5.4 SWOT Analysis
10.6 Vishay Intertechnology, Inc.
10.6.1 Company Overview
10.6.2 Financial
10.6.3 Products/ Services Offered
10.6.4 SWOT Analysis
10.7 ROHM Semiconductor.
10.7.1 Company Overview
10.7.2 Financial
10.7.3 Products/ Services Offered
10.7.4 SWOT Analysis
10.8 Diodes Incorporated
10.8.1 Company Overview
10.8.2 Financial
10.8.3 Products/ Services Offered
10.8.4 SWOT Analysis
10.9 Monolithic Power Systems
10.9.1 Company Overview
10.9.2 Financial
10.9.3 Products/ Services Offered
10.9.4 SWOT Analysis
10.10 STMicroelectronics.
10.10.1 Company Overview
10.10.2 Financial
10.10.3 Products/ Services Offered
10.10.4 SWOT Analysis
11. Use Cases and Best Practices
12. Conclusion
An accurate research report requires proper strategizing as well as implementation. There are multiple factors involved in the completion of good and accurate research report and selecting the best methodology to compete the research is the toughest part. Since the research reports we provide play a crucial role in any company’s decision-making process, therefore we at SNS Insider always believe that we should choose the best method which gives us results closer to reality. This allows us to reach at a stage wherein we can provide our clients best and accurate investment to output ratio.
Each report that we prepare takes a timeframe of 350-400 business hours for production. Starting from the selection of titles through a couple of in-depth brain storming session to the final QC process before uploading our titles on our website we dedicate around 350 working hours. The titles are selected based on their current market cap and the foreseen CAGR and growth.
The 5 steps process:
Step 1: Secondary Research:
Secondary Research or Desk Research is as the name suggests is a research process wherein, we collect data through the readily available information. In this process we use various paid and unpaid databases which our team has access to and gather data through the same. This includes examining of listed companies’ annual reports, Journals, SEC filling etc. Apart from this our team has access to various associations across the globe across different industries. Lastly, we have exchange relationships with various university as well as individual libraries.
Step 2: Primary Research
When we talk about primary research, it is a type of study in which the researchers collect relevant data samples directly, rather than relying on previously collected data. This type of research is focused on gaining content specific facts that can be sued to solve specific problems. Since the collected data is fresh and first hand therefore it makes the study more accurate and genuine.
We at SNS Insider have divided Primary Research into 2 parts.
Part 1 wherein we interview the KOLs of major players as well as the upcoming ones across various geographic regions. This allows us to have their view over the market scenario and acts as an important tool to come closer to the accurate market numbers. As many as 45 paid and unpaid primary interviews are taken from both the demand and supply side of the industry to make sure we land at an accurate judgement and analysis of the market.
This step involves the triangulation of data wherein our team analyses the interview transcripts, online survey responses and observation of on filed participants. The below mentioned chart should give a better understanding of the part 1 of the primary interview.
Part 2: In this part of primary research the data collected via secondary research and the part 1 of the primary research is validated with the interviews from individual consultants and subject matter experts.
Consultants are those set of people who have at least 12 years of experience and expertise within the industry whereas Subject Matter Experts are those with at least 15 years of experience behind their back within the same space. The data with the help of two main processes i.e., FGDs (Focused Group Discussions) and IDs (Individual Discussions). This gives us a 3rd party nonbiased primary view of the market scenario making it a more dependable one while collation of the data pointers.
Step 3: Data Bank Validation
Once all the information is collected via primary and secondary sources, we run that information for data validation. At our intelligence centre our research heads track a lot of information related to the market which includes the quarterly reports, the daily stock prices, and other relevant information. Our data bank server gets updated every fortnight and that is how the information which we collected using our primary and secondary information is revalidated in real time.
Step 4: QA/QC Process
After all the data collection and validation our team does a final level of quality check and quality assurance to get rid of any unwanted or undesired mistakes. This might include but not limited to getting rid of the any typos, duplication of numbers or missing of any important information. The people involved in this process include technical content writers, research heads and graphics people. Once this process is completed the title gets uploader on our platform for our clients to read it.
Step 5: Final QC/QA Process:
This is the last process and comes when the client has ordered the study. In this process a final QA/QC is done before the study is emailed to the client. Since we believe in giving our clients a good experience of our research studies, therefore, to make sure that we do not lack at our end in any way humanly possible we do a final round of quality check and then dispatch the study to the client.
By Type
<50A
50-80A
>80A
By Application
CPU+GPU Server
CPU+FPGA Server
CPU+Multiple Accelerator Card Servers
Others
Request for Segment Customization as per your Business Requirement: Segment Customization Request
Regional Coverage:
North America
US
Canada
Mexico
Europe
Germany
France
UK
Italy
Spain
Poland
Turkey
Rest of Europe
Asia Pacific
China
India
Japan
South Korea
Singapore
Australia
Taiwan
Rest of Asia Pacific
Middle East & Africa
UAE
Saudi Arabia
Qatar
South Africa
Rest of Middle East & Africa
Latin America
Brazil
Argentina
Rest of Latin America
Request for Country Level Research Report: Country Level Customization Request
Available Customization
With the given market data, SNS Insider offers customization as per the company’s specific needs. The following customization options are available for the report:
Detailed Volume Analysis
Criss-Cross segment analysis (e.g. Product X Application)
Competitive Product Benchmarking
Geographic Analysis
Additional countries in any of the regions
Customized Data Representation
Detailed analysis and profiling of additional market players