Carbon Capture, Utilization, and Storage (CCUS) Market Report Scope & Overview:
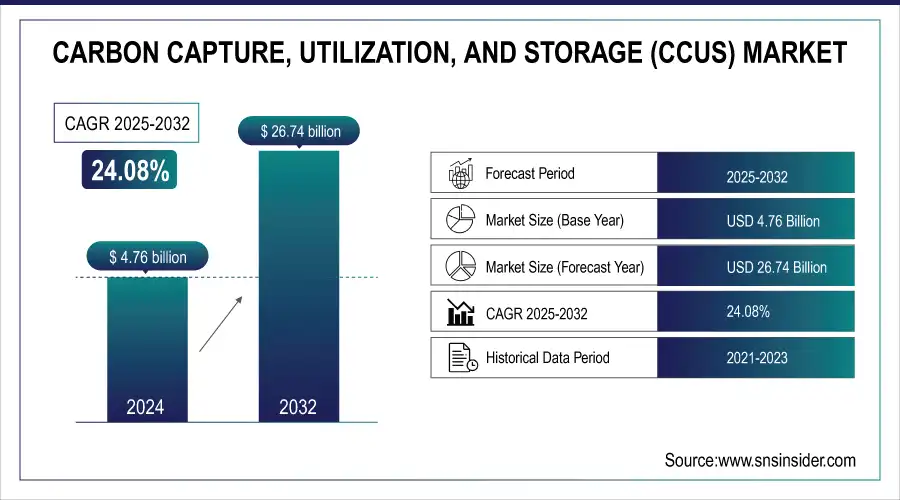
The Carbon Capture, Utilization, and Storage (CCUS) Market size was valued at USD 4.76 Billion in 2024 and is projected to reach USD 26.74 Billion by 2032, growing at a CAGR of 24.08% during 2025-2032.
The Carbon Capture, Utilization, and Storage (CCUS) market is set for significant growth with increasing demand for comprehensive carbon emission reduction solutions from industries and governments. Carbon Capture Usage and Storage (CCUS) removes CO₂ from industrial or energy sources for permanent geological storage or use in fuels, chemicals, and building materials. Rising demand for decarbonization across power generation, cement, steel, and oil & gas drives the market. Innovative approaches to direct air capture, mineralization and biological fixation are creating new methods of using captured CO2. Besides, enabling regulatory environment, economic cost benefits and investments in low carbon infrastructure further support market penetration. With the onset of global carbon neutrality plans gaining momentum, CCUS is proving to be a vital part in the quest for energy transition and emissions abatement.
To Get more information on Carbon Capture, Utilization, and Storage (CCUS) Market - Request Free Sample Report
IRA Boosts CCUS Incentives via Section 45Q Tax Credit Reform
The Inflation Reduction Act revamped Section 45Q, offering up to $180/ton in tax credits for direct air capture and storage, incentivizing cost-intensive CCUS methods and expanding commercial carbon utilization pathways.
Market Size and Forecast:
-
Market Size in 2024 USD 4.76 Billion
-
Market Size by 2032 USD 26.74 Billion
-
CAGR of 24.08 percent from 2024 to 2032
-
Base Year 2024
-
Forecast Period 2025-2032
-
Historical Data 2021-2023
Carbon Capture, Utilization, and Storage (CCUS) Market Highlights:
-
Market growth is driven by rising demand to reduce industrial CO₂ emissions, technological advancements in capture, utilization, and storage, supportive policies, increasing energy consumption, and investments in low-carbon infrastructure.
-
Key trends include the deployment of direct air capture technologies, expanding carbon utilization into fuels, chemicals, and building materials, and enhanced geological storage through advanced monitoring and modeling.
-
Policy support such as the Inflation Reduction Act revamped Section 45Q tax credit offering up to USD 180 per ton for direct air capture and storage incentivizes commercial CCUS adoption.
-
The cement, steel, power generation, and oil and gas sectors are the primary adopters of CCUS solutions due to regulatory pressure and net-zero commitments.
-
CarbonCure Technologies achieved over 500,000 metric tons of CO₂ reduction by injecting captured carbon into 7.5 million concrete truckloads, demonstrating scalable low-carbon concrete solutions.
-
Market restraints include high capital and operational costs, infrastructure deficits, complex permitting, fragmented regulatory frameworks, and technical integration challenges across industrial systems.
-
Opportunities arise from rising industrial emissions, energy security needs, stricter climate regulations, net-zero commitments, enhanced oil recovery, and long-term CO₂ storage potential, with global expansion such as China CNOOC’s offshore CCS project targeting over 1 million tonnes of CO₂ storage.
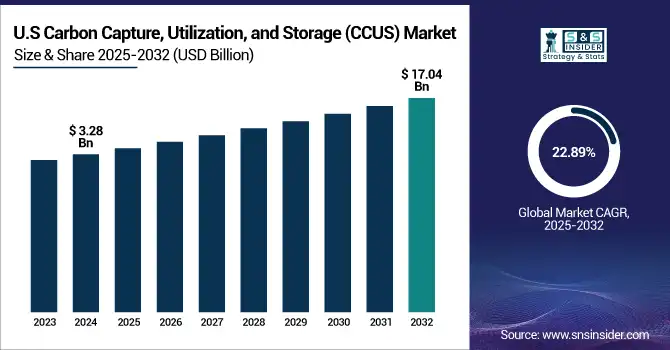
The U.S Carbon Capture, Utilization, and Storage (CCUS) market size was valued at USD 3.28 Billion in 2024 and is projected to reach USD 17.04 Billion by 2032, growing at a CAGR of 22.89% during 2025-2032. This increase in the of Carbon Capture, Utilization and Storage Market Volume is largely due to factors such as growing demand to reduce industrial CO₂ emissions, improvement in policy support, advancement for CO₂ capture, utilization & storage technology. Rapid energy consumption trends and growing demand for investment on low-carbon infrastructures, along with new segments in the commercial End Use Industry contribute substantially to market proliferation.
The Carbon Capture, Utilization, and Storage (CCUS) market trends is witnessing transformative driven by climate goals and technological progress. Key developments include the rising deployment of direct air capture (DAC) technologies, expanding carbon utilization pathways into fuels, chemicals, and building materials, and enhanced geological storage through advanced monitoring and modeling. Strong policy support, including tax incentives and emission mandates, is accelerating adoption, particularly in hard-to-abate sectors like cement and steel. Meanwhile, ongoing cost reductions and growing public-private partnerships are paving the way for scalable, commercial CCUS infrastructure.
Carbon Capture, Utilization, and Storage (CCUS) Market Drivers:
-
Growing Demand for Sustainable Construction Fuels CO₂ Utilization in Concrete
The rising emphasis on sustainable construction practices is driving the integration of CO₂ utilization technologies in the concrete industry. The regulatory pressures, corporate ESG pledges and the drive to net zero emissions have engendered a move towards carbon mineralization during the production of concrete as they include a process which fixes the CO₂ permanently. This not only decreases the carbon footprint of concrete, but also saves cement costs and no high energy content is lost as the performance will not be reduced. That there is also the added carrot of carbon credits, again solidifying financial rationale for adoption. While the construction sector is searching for large-scale, low-carbon solutions, CO₂-utilization in concrete will play a critical role to enable decarbonization and dominate the growth of CCUS market.
Carbon Cure Hits 500,000 Metric Tons CO₂ Savings Milestone Carbon Cure Technologies has reduced over 500,000 metric tons of CO₂ by injecting captured carbon into 7.5 million concrete truckloads, establishing itself as a global leader in scalable, low-carbon concrete solutions.
Carbon Capture, Utilization, and Storage (CCUS) Market Restraints:
-
High Implementation Costs and Infrastructure Deficits Restrict CCUS Market Expansion
The growth of the Carbon Capture, Utilization, and Storage (CCUS) market is restrained by high capital and operational costs, particularly for advanced technologies like direct air capture and large-scale CO₂ transportation. Construction of the necessary infrastructure, including pipelines and storage that must be developed or maintained in order to sustain production on a continual basis, is capital-intensive gray locks. Many operators have found themselves priced out of this business without substantial government backing as there is so much investment required. There are also logistical hurdles, including fragmented regulatory frameworks and complex permitting processes as well as access to storage sites that have been peer-reviewed and verified. Integrating across different industrial systems is still a technical challenge. This creates a set of factors that collectively serve to slow down the rate of adoption and inhibit private sector investment, particularly in developing countries, resulting in the lack of scalability and growth of commercial CCUS solutions despite increasing environmental urgency.
Carbon Capture, Utilization, and Storage (CCUS) Market Opportunities:
-
Rising Industrial Emissions and Energy Security Needs Drive Growth in the CCUS Market
As global industrial emissions continue to rise and nations seek greater energy security, the demand for Carbon Capture, Utilization, and Storage (CCUS) technologies is accelerating. Stricter climate regulations, net-zero commitments, and the urgent need to decarbonize hard-to-abate sectors such as cement, steel, and oil & gas are compelling industries to adopt CCUS solutions. Simultaneously, the ability of CCUS to enhance oil recovery and provide long-term CO₂ storage is positioning it as a dual-purpose tool for environmental compliance and resource optimization. These converging factors are driving investment in capture technologies, transportation networks, and sequestration infrastructure—unlocking new revenue opportunities for technology vendors, EPC players, and regional governments aiming to scale low-carbon industrial ecosystems.
China's CNOOC Launches First Offshore CCS Project to Cut Emissions and Boost Oil Output
China National Offshore Oil Corporation (CNOOC) has launched the country’s first offshore carbon capture and storage (CCS) facility at Enping 15-1 in the Pearl River Mouth Basin, aiming to inject over 1 million tonnes of CO₂ over the next decade while enhancing oil output and supporting national carbon neutrality goals.
Carbon Capture, Utilization, and Storage (CCUS) Market Segment Analysis:
By Services
In 2024, the Capture segment dominated the Carbon Capture, Utilization, and Storage (CCUS) market with around 61% share, driven by rising deployment across industrial, power generation, and direct air capture facilities. The increasing demand for efficient carbon mitigation technologies, coupled with supportive policy incentives and advancements in capture efficiency, is reinforcing this segment’s growth. As capture remains the critical first step in the CCUS value chain, continued innovation and investment are expected to sustain its leading market position.
The Utilization segment is projected to witness the fastest growth in the Carbon Capture, Utilization, and Storage (CCUS) market from 2025 to 2032, registering a CAGR of 31.96%. The growth is stimulated by the increasing deployment of captured CO₂ for fuel, chemicals and value added products like concrete. With circular carbon economy solutions in higher demand, more opportunities for earning carbon credits, and technological advancements in converting CO2 to materials or chemicals further driving adoption, utilization will be a significant market driver for the future growth of the CCUS landscape.
By Technology
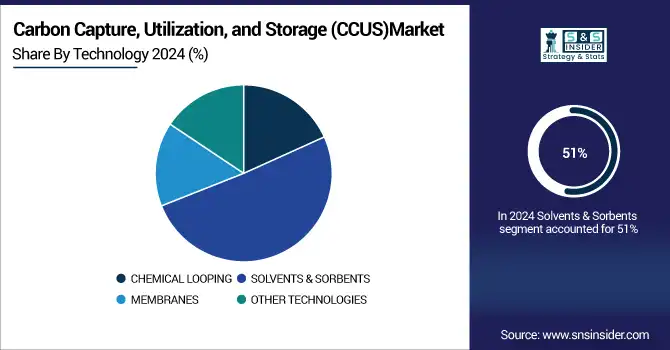
In 2024, the Solvents & Sorbents segment accounted for around 51% of the Carbon Capture, Utilization, and Storage (CCUS) market, emerging as the leading material type. Its dominance is driven by the broad End Use Industry of chemical solvents and solid sorbents in CO₂ capture across power plants and industrial facilities. Ongoing advancements in capture efficiency, energy savings, and material reusability continue to strengthen this segment’s position as a vital component in scalable and cost-effective CCUS deployment.
The Membranes segment is projected to grow at the fastest rate in the Carbon Capture, Utilization, and Storage (CCUS) market from 2025 to 2032, with a CAGR of 30.72%. The growth of this segment can be attributed to the increasing requirement for energy-efficient, small-scale and modular CO₂ separation technologies. With significantly Commensurate operating costs and easy adaptability into existing infrastructures, membrane systems are being increasingly adopted in industrial as well as decentralized End Use Industry’s especially in regions where the focus is more on low-footprint carbon capture solutions.
By Deployment Mode
In 2024, the Point Source Capture segment held around 60% of the Carbon Capture, Utilization, and Storage (CCUS) market share, driven by the growing need to reduce emissions from high-volume industrial sources such as power plants, refineries, and cement facilities. Its dominance is supported by technological maturity, cost-effectiveness, and regulatory incentives targeting large stationary emitters for immediate climate impact.
The Direct Air Capture (DAC) segment is expected to grow at the fastest rate in the Carbon Capture, Utilization, and Storage (CCUS) market from 2025 to 2032, with a CAGR of 25.45%. This growth is driven by rising demand for negative emissions solutions, supportive policy incentives, and technological advancements that are improving cost efficiency and scalability of DAC systems worldwide.
By End Use Industry
In 2024, the Oil & Gas segment accounted for approximately 31% of the Carbon Capture, Utilization, and Storage (CCUS) market share, on account of growing environment-friendly measures implemented within upstream and midstream activities. Growing investments in enhanced oil recovery (EOR) along with the rising use of CCS in refineries as well as gas processing applications are further spurring the adoption especially across the fossil rich regions.
The Chemical & Petrochemical segment is projected to grow at the fastest CAGR of 27.61% from 2025 to 2032 in the CCUS market, driven by stringent emissions regulations and increasing demand for low-carbon feedstocks. Rising integration of carbon capture units in ammonia, methanol, and ethylene plants is supporting decarbonization, especially as companies prioritize ESG goals and transition toward circular carbon solutions.
Carbon Capture, Utilization, and Storage (CCUS) Market Regional Analysis:
North America Carbon Capture, Utilization, and Storage (CCUS) Market Trends:
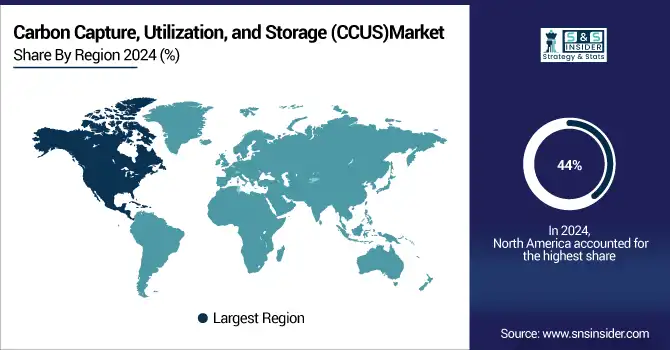
In 2024, North America led the Carbon Capture, Utilization, and Storage (CCUS) market, accounting for 44% of the total revenue share. The dominance of North America can be accredited to well defined policy support, large government funding and the implementation of CCUS technologies in both industrial as well as energy related sectors EARLY. The decarbonisation movement and carbon credit markets in the region are also increasingly focusing on deployments at a significant project scale.
Get Customized Report as per Your Business Requirement - Enquiry Now
Asia-Pacific Carbon Capture, Utilization, and Storage (CCUS) Market Trends:
Asia-Pacific is projected to witness the fastest growth in the Carbon Capture, Utilization, and Storage (CCUS) market from 2025 to 2032, with a CAGR of 26.02%. This rapid expansion is driven by rising industrial emissions, increasing government commitments to net-zero targets, and growing investments in clean technologies. Emerging economies are accelerating CCUS adoption to balance economic growth with environmental sustainability.
Europe Carbon Capture, Utilization, and Storage (CCUS) Market Trends:
In 2024, Europe emerged as a promising region in the Carbon Capture, Utilization, and Storage (CCUS) market, due to stringent climate regulations, carbon pricing mechanisms, and favorable clean energy innovation policies in Europe_CUBE_SUMMIT-2 European offshore projects are leading the way in sustainable decarbonization strategies by fast-forwarding project development facilitated by cross-border CO₂ transport infrastructure and large-scale storage initiatives already underway across the North Sea.
Latin America and Middle East & Africa Carbon Capture, Utilization, and Storage (CCUS) Market Trends:
Latin America (LATAM) and the Middle East & Africa (MEA) regions are witnessing steady growth in the Carbon Capture, Utilization, and Storage (CCUS) market, due to the growing consciousness about climate change, mounting emissions from oil and gas operations, and surging government-led sustainability initiatives in Latin America (LATAM) & Middle East & Africa (MEA) regions. These areas are considering CCUS as a clean pathway to decarbonize heavy industry and exploit the existing industrial base infrastructure, natural CO2 storage capacity, as well as international collaboration for project implementation.
Carbon Capture, Utilization, and Storage (CCUS) Market Key Players:
-
Royal Dutch Shell
-
Fluor Corporation
-
Mitsubishi Heavy Industries Ltd.
-
Exxon Mobil Corporation
-
Linde Plc
-
JGC Holdings Corporation
-
Schlumberger Ltd.
-
Aker Solutions
-
Honeywell International Inc.
-
Equinor ASA
-
TotalEnergies SE
-
Chevron Corporation
-
Siemens Energy
-
Occidental Petroleum Corporation
-
Air Liquide
-
BASF SE
-
Hitachi Zosen Corporation
-
Carbon Clean Solutions
-
Climeworks AG
-
Svante Technologies Inc.
-
Others
Recent Developments:
ExxonMobil is a global energy leader engaged in the exploration, production, refining, and distribution of oil, natural gas, and petrochemicals. Headquartered in the United States, the company focuses on sustainable energy solutions, advanced technologies, and large-scale projects to meet global energy demand while reducing environmental impact.
-
In April 30, ExxonMobil is developing the Hummingbird and Mockingbird CO₂ storage projects in Allen Parish, Louisiana, aiming for safe, permanent underground sequestration. These initiatives support local decarbonization, economic growth, and job creation, with public hearings underway for exploratory well permits.
JGC Corporation is a leading global engineering and construction company headquartered in Japan. Specializing in EPC and EPCI projects, it delivers large-scale energy, chemical, and infrastructure solutions. The company focuses on innovation, sustainable development, and advanced technologies to support energy transition, environmental initiatives, and industrial growth worldwide.
-
In Nov 2024, JGC Wins $2.4B EPCI Contract for Tangguh CCUS Project in Indonesia JGC Holdings, via P.T. JGC Indonesia, will execute onshore compression facilities for BP's Tangguh LNG EGR/CCUS project, integrating CO₂ reinjection for enhanced gas recovery and decarbonization.
| Report Attributes | Details |
| Market Size in 2024 | USD 4.76 Billion |
| Market Size by 2032 | USD 26.74 Billion |
| CAGR | CAGR of 24.08% From 2024 to 2032 |
| Base Year | 2024 |
| Forecast Period | 2025-2032 |
| Historical Data | 2021-2023 |
| Report Scope & Coverage | Market Size, Segments Analysis, Competitive Landscape, Regional Analysis, DROC & SWOT Analysis, Forecast Outlook |
| Key Segments | • By Services (Capture, Transportation, Utilization and Storage) • By Technology (Chemical Looping, Solvents & Sorbents, Membranes and Other Technologies) • By Deployment Mode (Point Source Capture and Direct Air Capture (Dac)) • By End Use Industry(Oil & Gas, Power Generation, Chemical & Petrochemical Cement, Iron & Steel and Other End-Use Industries) |
| Regional Analysis/Coverage | North America (US, Canada), Europe (Germany, UK, France, Italy, Spain, Russia, Poland, Rest of Europe), Asia Pacific (China, India, Japan, South Korea, Australia, ASEAN Countries, Rest of Asia Pacific), Middle East & Africa (UAE, Saudi Arabia, Qatar, South Africa, Rest of Middle East & Africa), Latin America (Brazil, Argentina, Mexico, Colombia, Rest of Latin America). |
| Company Profiles | The Carbon Capture, Utilization, and Storage (CCUS) market Companies are Royal Dutch Shell, Fluor Corporation, Mitsubishi Heavy Industries Ltd., Exxon Mobil Corporation, Linde Plc, JGC Holdings Corporation, Schlumberger Ltd., Aker Solutions, Honeywell International Inc., Equinor ASA, TotalEnergies SE, Chevron Corporation, Siemens Energy, Occidental Petroleum Corporation, Air Liquide, BASF SE, Hitachi Zosen Corporation, Carbon Clean Solutions, Climeworks AG, Svante Technologies Inc. and Others |
Frequently Asked Questions
Ans: North America dominated the Carbon Capture, Utilization, and Storage (CCUS)Market in 2024.
Ans: The “< 1,500 mAh” segment dominated the Carbon Capture, Utilization, and Storage (CCUS)Market
Ans: Stringent emissions regulations, industrial decarbonization goals, and supportive government incentives are key drivers of the CCUS market.n.
Ans: The Carbon Capture, Utilization, and Storage (CCUS)Market size was valued at USD 4.76 Billion in 2024 and is projected to reach USD 26.74 Billion by 2032
Ans: The Carbon Capture, Utilization, and Storage (CCUS)Market is expected to grow at a CAGR of 24.08% during 2025-2032.
Get in Touch
