Carbon Credit Trading Platform Market Report Scope & Overview:
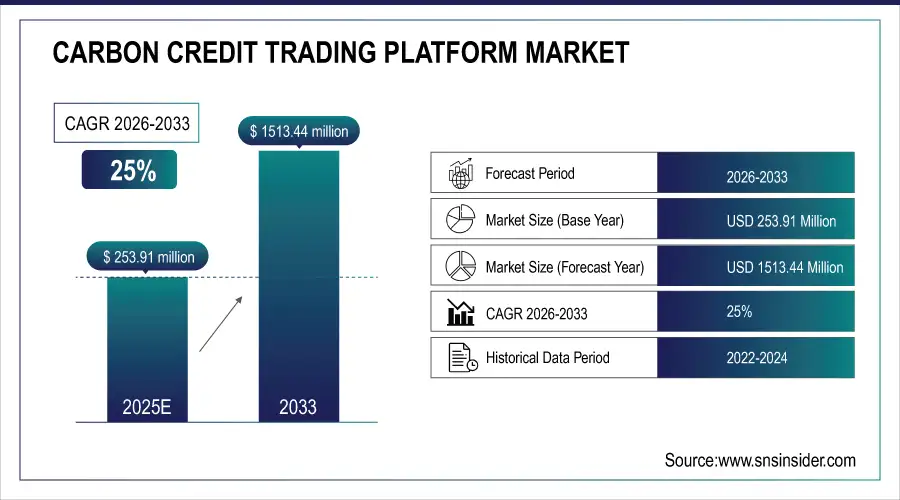
The Carbon Credit Trading Platform Market size was valued at USD 203.13 million in 2024 and is expected to reach USD 1210.72 million by 2032 with a growing CAGR of 25% over the forecast period of 2025-2032.

Get More Information on Carbon Credit Trading Platform Market - Request Sample Report
The carbon credit trading platform is a system that allows companies to buy and sell carbon credits. Carbon credits provide companies with a way to offset their carbon emissions by investing in projects that help to reduce carbon emissions. The platform provides a transparent and efficient way for companies to participate in the carbon market and contribute to the fight against climate change.

Carbon Credit Trading Platform Market Size and Forecast:
-
Market Size in 2024 -USD 203.13 Million
-
Market Size by 2032 -USD 1,210.72 Million
-
CAGR (2025–2032) -25%
-
Base Year -2024
-
Forecast Period -2025–2032
-
Historical Data -2021–2023
Carbon Credit Trading Platform Market Highlights:
-
Expansion of markets permitting partial carbon offset usage is fueling platform adoption and driving emission reduction initiatives.
-
Partial offset frameworks allow industries to balance sustainability targets with operational constraints.
-
Lack of transparency and absence of standardized protocols create pricing inconsistencies and limit market trust.
-
Fragmented regulations and reporting challenges hinder global scalability and increase risks of fraudulent practices.
-
Rapid adoption of renewable energy sources, including solar, wind, and bioenergy, is boosting demand for carbon credits.
-
Advances in carbon capture and storage (CCS) technologies support long-term emission reduction strategies.
-
Strong government incentives, corporate net-zero goals, and global climate commitments foster significant market growth.
With the increasing awareness of the impact of climate change, the demand for carbon credits has grown significantly. The carbon credit trading platform provides a marketplace for buyers and sellers to trade carbon credits, ensuring that the credits are priced fairly and accurately. This helps to incentivize companies to reduce their carbon emissions and invest in sustainable practices. The platform is designed to be user-friendly and accessible to companies of all sizes. It provides real-time data and analytics, allowing companies to track their carbon emissions and make informed decisions about their carbon offsetting strategies. The platform also offers a range of tools and resources to help companies navigate the complex world of carbon trading.
Carbon Credit Trading Platform Market Drivers:
-
Growing number of markets allowing partial use of carbon offsets
The number of markets allowing partial use of carbon offsets is on the rise. This trend is gaining momentum as more and more companies seek to reduce their carbon footprint and meet sustainability goals. Carbon offsets are a way for companies to offset their carbon emissions by investing in projects that reduce greenhouse gas emissions elsewhere. However, some markets only allow a portion of a company's emissions to be offset through carbon credits. This is where the partial use of carbon offsets comes into play. Companies can still invest in carbon reduction projects, but only a portion of their emissions can be offset through these projects. This approach has its advantages and disadvantages. On the one hand, it allows companies to take steps towards reducing their carbon footprint, even if they cannot completely eliminate it. On the other hand, it may not be enough to meet the ambitious sustainability goals that many companies have set for themselves. But these factors propel the growth of the carbon credit trading platform market.
Carbon Credit Trading Platform Market Restraints:
-
Absence of transparency and standardization in the market
The absence of transparency and standardization in the market creates significant challenges for stakeholders, leading to inconsistencies in pricing, verification, and reporting practices. Without clear guidelines and standardized protocols, buyers and sellers face uncertainty regarding the authenticity and credibility of transactions. This lack of uniformity often results in fragmented market structures, limited trust among participants, and barriers to scaling operations effectively. It also increases the risk of fraud, misinformation, and discrepancies in data reporting, making it difficult for investors and organizations to assess the true value or impact of their participation. Establishing robust frameworks, clear regulatory standards, and transparent mechanisms is essential to enhance market credibility, encourage broader adoption, and support the sustainable growth of the industry.
Carbon Credit Trading Platform Market Opportunities:
-
Increasing adoption of renewable energy sources and the emergence of new technologies for carbon capture and storage present significant opportunities for market growth
The increasing adoption of renewable energy sources, such as solar, wind, and bioenergy, along with the rapid emergence of carbon capture and storage (CCS) technologies, is creating substantial opportunities for market growth. Renewable energy reduces reliance on fossil fuels, lowering overall carbon emissions, while CCS technologies enable the capture, utilization, and long-term storage of greenhouse gases from industrial and energy-related processes. Together, these advancements are driving the transition toward a low-carbon economy, attracting significant investments, and encouraging innovation across industries. Government support, corporate sustainability initiatives, and rising global awareness of climate change further amplify this growth potential.
Carbon Credit Trading Platform Market Segment Analysis:
By Type
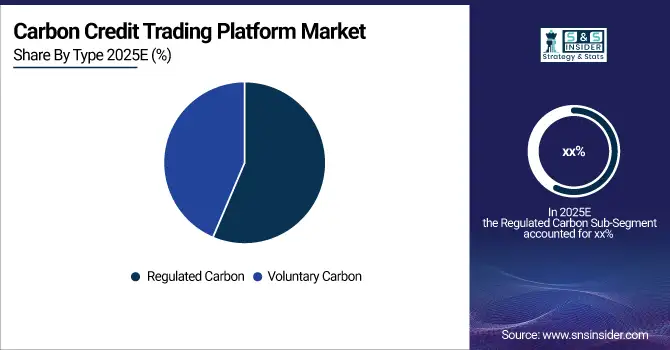
The Regulated Carbon Market is currently dominating due to strong government policies, compliance requirements, and mandatory emission reduction targets across major economies. It accounts for the largest share, driven by stringent regulations in regions like the EU, North America, and Asia-Pacific. However, the Voluntary Carbon Market is witnessing the fastest growth, fueled by increasing corporate sustainability commitments, net-zero pledges, and rising awareness among organizations and consumers to offset emissions beyond regulatory obligations, creating significant future expansion opportunities.

By System Type
The Cap & Trade system dominates the market due to its widespread implementation in regulated carbon markets, particularly across North America, Europe, and parts of Asia-Pacific. It offers clear emission caps, tradable allowances, and strong regulatory backing, making it the primary choice for compliance-driven initiatives. However, the Baseline & Credit system is witnessing faster growth, driven by voluntary carbon markets, corporate sustainability programs, and project-based initiatives that reward emission reductions beyond set baselines, supporting flexible participation and expansion in emerging economies.
By End-use:
The Utilities segment dominates the carbon credit trading market as it accounts for the largest share due to high emission levels, strict compliance requirements, and widespread participation in regulated markets. It plays a crucial role in meeting national and international carbon reduction targets. However, the Aviation segment is growing the fastest, driven by global carbon offsetting programs, rising air travel demand, and industry commitments toward achieving net-zero emissions through voluntary and compliance-based carbon credit initiatives.
Carbon Credit Trading Platform Market Regional Analysis:
Europe Carbon Credit Trading Platform Market Trends:
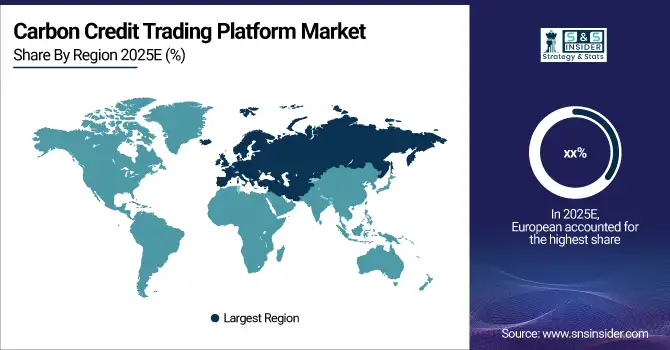
The European market is expected to hold the largest share of the global carbon credit trading platform market. This growth can be attributed to investments in clean power generation and electrification, as well as the replacement of aging infrastructure to achieve higher efficiency. Investments in clean power generation and electrification have become increasingly important as the world seeks to reduce its carbon footprint. The replacement of aging infrastructure is also crucial in achieving higher efficiency and reducing emissions. These factors have contributed to the growth of the carbon credit trading platform market in Europe.
Furthermore, the region's rapid industrial growth has created a need for carbon credit trading platforms. As industries expand, they often require more energy and resources, which can lead to increased emissions. Carbon credit trading platforms provide a solution by allowing companies to offset their emissions by purchasing credits from other companies that have reduced their emissions.

Need any customization research on Carbon Credit Trading Platform Market - Enquiry Now
Asia-Pacific Carbon Credit Trading Platform Market Trends:
The Asia Pacific region is expected to grow with the highest CAGR during the forecast period attributed to several factors, including the region's robust economic growth, increasing awareness of environmental issues, and favorable government policies. One of the key drivers of the Asia Pacific market's growth is its strong economic growth. As countries in the region continue to develop and industrialize, there is a growing demand for carbon credits to offset emissions. This has led to the emergence of a vibrant carbon credit trading platform market, with many companies and organizations seeking to buy and sell carbon credits to meet their emissions targets.
North America Carbon Credit Trading Platform Market Trends:
North America holds a significant share of the carbon credit trading platform market, driven by stringent environmental regulations, corporate sustainability commitments, and robust participation in compliance markets such as the Regional Greenhouse Gas Initiative (RGGI) and California’s Cap-and-Trade Program. The presence of advanced technological infrastructure supports seamless carbon trading operations. Moreover, increasing investments in renewable energy and carbon capture projects further boost market growth. Corporations in the U.S. and Canada are actively purchasing carbon credits to meet net-zero targets, making the region one of the most mature and structured carbon markets globally.
Latin America Carbon Credit Trading Platform Market Trends:
Latin America is witnessing growing adoption of carbon credit trading platforms fueled by its abundant natural resources, especially forest-based carbon offsets. Countries like Brazil, Chile, and Colombia are actively developing frameworks to monetize carbon sequestration projects linked to forestry, agriculture, and renewable energy. Government support and international collaborations are encouraging participation in voluntary carbon markets. The region is also benefiting from rising corporate and investor interest in nature-based solutions to offset emissions, contributing to steady market expansion.
Middle East & Africa Carbon Credit Trading Platform Market Trends:
The Middle East & Africa region is emerging as a potential growth hub for carbon credit trading platforms, primarily driven by diversification efforts in oil-rich nations and increasing renewable energy investments. Countries such as the UAE and Saudi Arabia are launching carbon market initiatives to support their climate pledges, while African nations leverage forest conservation and clean energy projects to generate carbon credits. However, challenges like limited infrastructure, policy gaps, and low awareness in rural areas slow large-scale adoption, though growing international cooperation is expected to accelerate market development.
Carbon Credit Trading Platform Market Key Players:
-
Carbon Trade Exchange
-
Air Carbon Exchange (ACX)
-
CME Group
-
Xpansiv
-
Climate Trade
-
Planetly
-
Toucan
-
Carbon Credit Capital
-
Likvidi
-
Carbonex
-
Betacarbon
-
Carbon Streaming Corporation
-
Verra
-
South Pole
-
EcoAct
-
Cloverly
Carbon Credit Trading Platform Market Competitive Landscape:
Shiftcarbon is a leading provider of carbon offset solutions and sustainability services, helping organizations measure, reduce, and offset their carbon emissions. The company offers technology-driven platforms for carbon credit verification, trading, and management across various industries. With a focus on transparency and innovation, Shiftcarbon supports businesses in achieving their net-zero goals and complying with evolving environmental regulations globally.
-
In 2023, Shiftcarbon, a global leader in IoT platforms and an innovator in end-to-end decarbonization solutions, announces the beta launch of its highly anticipated carbon credit trading platform. This release is now available to all customers, providing a more resilient and flexible infrastructure to list, buy, sell, and verify voluntary carbon offsets.
Shiftcarbon is a leading provider of carbon offset solutions and sustainability services, helping organizations measure, reduce, and offset their carbon emissions. The company offers technology-driven platforms for carbon credit verification, trading, and management across various industries. With a focus on transparency and innovation, Shiftcarbon supports businesses in achieving their net-zero goals and complying with evolving environmental regulations globally.
-
According to Nasdaq, the demand for carbon offsets is projected to surge by at least 15 times by 2030 and potentially up to 100 times by 2050. This exponential growth in demand is indicative of the pressing need for businesses to reduce their carbon footprint and offset their emissions. The market for carbon credits could be worth upward of $50 billion by 2030, making it a lucrative opportunity for businesses to invest in sustainable practices.
Report Attributes | Details |
Market Size in 2024 | USD 203.13 Million |
Market Size by 2032 | USD 1210.72 Million |
CAGR | CAGR of 25% From 2025 to 2032 |
Base Year | 2024 |
Forecast Period | 2025-2032 |
Historical Data | 2021-2023 |
Report Scope & Coverage | Market Size, Segments Analysis, Competitive Landscape, Regional Analysis, DROC & SWOT Analysis, Forecast Outlook |
Key Segments | • By Type (Voluntary Carbon Market and Regulated Carbon Market) • By System Type (Cap & Trade and Baseline & Credit) • By End-use (Utilities, Industrial, Aviation, petrochemical, Energy, and Others) |
Regional Analysis/Coverage | North America (US, Canada), Europe (Germany, UK, France, Italy, Spain, Russia, Poland, Rest of Europe), Asia Pacific (China, India, Japan, South Korea, Australia, ASEAN Countries, Rest of Asia Pacific), Middle East & Africa (UAE, Saudi Arabia, Qatar, South Africa, Rest of Middle East & Africa), Latin America (Brazil, Argentina, Mexico, Colombia, Rest of Latin America). |
Company Profiles | Nasdaq, Inc., EEX Group, Carbon Trade Exchange, Air Carbon Exchange (ACX), Carbonplace, CME Group, Xpansiv, Climate Trade, Planetly, Toucan, Carbon Credit Capital, Flowcarbon, Likvidi, Carbonex, Betacarbon, Carbon Streaming Corporation, Verra, South Pole, EcoAct, Cloverly |
Table Of Contents
1. Introduction
1.1 Market Definition & Scope
1.2 Research Assumptions & Abbreviations
1.3 Research Methodology
2. Executive Summary
2.1 Market Snapshot
2.2 Market Absolute $ Opportunity Assessment & Y-o-Y Analysis, 2021–2032
2.3 Market Size & Forecast, By Segmentation, 2021–2032
2.3.1 Market Size By Type
2.3.2 Market Size By System Type
2.3.3 Market Size By End-use
2.4 Market Share & Bps Analysis By Region, 2024
2.5 Industry Growth Scenarios – Conservative, Likely & Optimistic
2.6 Industry CxO’s Perspective
3. Market Overview
3.1 Market Dynamics
3.1.1 Drivers
3.1.2 Restraints
3.1.3 Opportunities
3.1.4 Key Market Trends
3.2 Industry PESTLE Analysis
3.3 Key Industry Forces (Porter’s) Impacting Market Growth
3.4 Industry Supply Chain Analysis
3.4.1 Raw Material Suppliers
3.4.2 Manufacturers
3.4.3 Distributors/Suppliers
3.4.4 Customers/End-Users
3.5 Industry Life Cycle Assessment
3.6 Parent Market Overview
3.7 Market Risk Assessment
4. Statistical Insights & Trends Reporting
4.1 Transaction & Trading Metrics
4.1.1 Total carbon credits traded annually (metric tons CO₂e)
4.1.2 Average transaction value (USD per ton of CO₂e)
4.1.3 Average trading volume (number of transactions) per platform
4.1.4 Share (%) of spot vs. forward/futures trading of carbon credits
4.2 Cost & Economic Metrics
4.2.1 Average cost reduction (%) for organizations participating in carbon trading
4.2.2 ROI (%) from investment in carbon credit trading platforms
4.2.3 Average platform usage fees or subscription cost (USD per organization per year)
4.2.4 Savings (%) in regulatory compliance costs through carbon trading
4.3 Regulatory & Compliance Metrics
4.3.1 Share (%) of carbon credits verified under international standards (e.g., VCS, Gold Standard)
4.3.2 Average approval time (days/weeks) for carbon credit validation
4.3.3 Adoption (%) of ESG and sustainability reporting integration
4.3.4 Number of regulatory bodies adopting platform-based carbon trading solutions per region
5. Carbon Credit Trading Platform Market Segmental Analysis & Forecast, By Type, 2021 – 2032, Value (USD Billion)
5.1 Introduction
5.2 Voluntary Carbon Market
5.2.1 Key Trends
5.2.2 Market Size & Forecast, 2021 – 2032
5.3 Regulated Carbon Market
6. Carbon Credit Trading Platform Market Segmental Analysis & Forecast, By System Type, 2021 – 2032, Value (USD Billion)
6.1 Introduction
6.2 Cap & Trade
6.2.1 Key Trends
6.2.2 Market Size & Forecast, 2021 – 2032
6.3 Baseline & Credit
7. Carbon Credit Trading Platform Market Segmental Analysis & Forecast, By End-use, 2021 – 2032, Value (USD Billion)
7.1 Introduction
7.2 Utilities
7.2.1 Key Trends
7.2.2 Market Size & Forecast, 2021 – 2032
7.3 Industrial
7.4 Aviation
7.5 Petrochemical
7.6 Energy
7.7 Others
8. Carbon Credit Trading Platform Market Segmental Analysis & Forecast By Region, 2021 – 2025, Value (USD Billion)
8.1 Introduction
8.2 North America
8.2.1 Key Trends
8.2.2 Carbon Credit Trading Platform Market Size & Forecast, By Type, 2021 – 2032
8.2.3 Carbon Credit Trading Platform Market Size & Forecast, By System Type, 2021 – 2032
8.2.4 Carbon Credit Trading Platform Market Size & Forecast, By End-use, 2021 – 2032
8.2.5 Carbon Credit Trading Platform Market Size & Forecast, By Country, 2021 – 2032
8.2.5.1 USA
8.2.5.1.1 Carbon Credit Trading Platform Market Size & Forecast, By Type, 2021 – 2032
8.2.5.1.2 Carbon Credit Trading Platform Market Size & Forecast, By System Type, 2021 – 2032
8.2.5.1.3 Carbon Credit Trading Platform Market Size & Forecast, By End-use, 2021 – 2032
8.2.5.2 Canada
8.2.5.2.1 Carbon Credit Trading Platform Market Size & Forecast, By Type, 2021 – 2032
8.2.5.2.2 Carbon Credit Trading Platform Market Size & Forecast, By System Type, 2021 – 2032
8.2.5.2.3 Carbon Credit Trading Platform Market Size & Forecast, By End-use, 2021 – 2032
8.3 Europe
8.3.1 Key Trends
8.3.2 Carbon Credit Trading Platform Market Size & Forecast, By Type, 2021 – 2032
8.3.3 Carbon Credit Trading Platform Market Size & Forecast, By System Type, 2021 – 2032
8.3.4 Carbon Credit Trading Platform Market Size & Forecast, By End-use, 2021 – 2032
8.3.5 Carbon Credit Trading Platform Market Size & Forecast, By Country, 2021 – 2032
8.3.5.1 Germany
8.3.5.1.1 Carbon Credit Trading Platform Market Size & Forecast, By Type, 2021 – 2032
8.3.5.1.2 Carbon Credit Trading Platform Market Size & Forecast, By System Type, 2021 – 2032
8.3.5.1.3 Carbon Credit Trading Platform Market Size & Forecast, By End-use, 2021 – 2032
8.3.5.2 UK
8.3.5.2.1 Carbon Credit Trading Platform Market Size & Forecast, By Type, 2021 – 2032
8.3.5.2.2 Carbon Credit Trading Platform Market Size & Forecast, By System Type, 2021 – 2032
8.3.5.2.3 Carbon Credit Trading Platform Market Size & Forecast, By End-use, 2021 – 2032
8.3.5.3 France
8.3.5.3.1 Carbon Credit Trading Platform Market Size & Forecast, By Type, 2021 – 2032
8.3.5.3.2 Carbon Credit Trading Platform Market Size & Forecast, By System Type, 2021 – 2032
8.3.5.3.3 Carbon Credit Trading Platform Market Size & Forecast, By End-use, 2021 – 2032
8.3.5.4 Italy
8.3.5.4.1 Carbon Credit Trading Platform Market Size & Forecast, By Type, 2021 – 2032
8.3.5.4.2 Carbon Credit Trading Platform Market Size & Forecast, By System Type, 2021 – 2032
8.3.5.4.3 Carbon Credit Trading Platform Market Size & Forecast, By End-use, 2021 – 2032
8.3.5.5 Spain
8.3.5.5.1 Carbon Credit Trading Platform Market Size & Forecast, By Type, 2021 – 2032
8.3.5.5.2 Carbon Credit Trading Platform Market Size & Forecast, By System Type, 2021 – 2032
8.3.5.5.3 Carbon Credit Trading Platform Market Size & Forecast, By End-use, 2021 – 2032
8.3.5.6 Russia
8.3.5.6.1 Carbon Credit Trading Platform Market Size & Forecast, By Type, 2021 – 2032
8.3.5.6.2 Carbon Credit Trading Platform Market Size & Forecast, By System Type, 2021 – 2032
8.3.5.6.3 Carbon Credit Trading Platform Market Size & Forecast, By End-use, 2021 – 2032
8.3.5.7 Poland
8.3.5.7.1 Carbon Credit Trading Platform Market Size & Forecast, By Type, 2021 – 2032
8.3.5.7.2 Carbon Credit Trading Platform Market Size & Forecast, By System Type, 2021 – 2032
8.3.5.7.3 Carbon Credit Trading Platform Market Size & Forecast, By End-use, 2021 – 2032
8.3.5.8 Rest of Europe
8.3.5.8.1 Carbon Credit Trading Platform Market Size & Forecast, By Type, 2021 – 2032
8.3.5.8.2 Carbon Credit Trading Platform Market Size & Forecast, By System Type, 2021 – 2032
8.3.5.8.3 Carbon Credit Trading Platform Market Size & Forecast, By End-use, 2021 – 2032
8.4 Asia-Pacific
8.4.1 Key Trends
8.4.2 Carbon Credit Trading Platform Market Size & Forecast, By Type, 2021 – 2032
8.4.3 Carbon Credit Trading Platform Market Size & Forecast, By System Type, 2021 – 2032
8.4.4 Carbon Credit Trading Platform Market Size & Forecast, By End-use, 2021 – 2032
8.4.5 Carbon Credit Trading Platform Market Size & Forecast, By Country, 2021 – 2032
8.4.5.1 China
8.4.5.1.1 Carbon Credit Trading Platform Market Size & Forecast, By Type, 2021 – 2032
8.4.5.1.2 Carbon Credit Trading Platform Market Size & Forecast, By System Type, 2021 – 2032
8.4.5.1.3 Carbon Credit Trading Platform Market Size & Forecast, By End-use, 2021 – 2032
8.4.5.2 India
8.4.5.2.1 Carbon Credit Trading Platform Market Size & Forecast, By Type, 2021 – 2032
8.4.5.2.2 Carbon Credit Trading Platform Market Size & Forecast, By System Type, 2021 – 2032
8.4.5.2.3 Carbon Credit Trading Platform Market Size & Forecast, By End-use, 2021 – 2032
8.4.5.3 Japan
8.4.5.3.1 Carbon Credit Trading Platform Market Size & Forecast, By Type, 2021 – 2032
8.4.5.3.2 Carbon Credit Trading Platform Market Size & Forecast, By System Type, 2021 – 2032
8.4.5.3.3 Carbon Credit Trading Platform Market Size & Forecast, By End-use, 2021 – 2032
8.4.5.4 South Korea
8.4.5.4.1 Carbon Credit Trading Platform Market Size & Forecast, By Type, 2021 – 2032
8.4.5.4.2 Carbon Credit Trading Platform Market Size & Forecast, By System Type, 2021 – 2032
8.4.5.4.3 Carbon Credit Trading Platform Market Size & Forecast, By End-use, 2021 – 2032
8.4.5.5 Australia
8.4.5.5.1 Carbon Credit Trading Platform Market Size & Forecast, By Type, 2021 – 2032
8.4.5.5.2 Carbon Credit Trading Platform Market Size & Forecast, By System Type, 2021 – 2032
8.4.5.5.3 Carbon Credit Trading Platform Market Size & Forecast, By End-use, 2021 – 2032
8.4.5.6 ASEAN Countries
8.4.5.6.1 Carbon Credit Trading Platform Market Size & Forecast, By Type, 2021 – 2032
8.4.5.6.2 Carbon Credit Trading Platform Market Size & Forecast, By System Type, 2021 – 2032
8.4.5.6.3 Carbon Credit Trading Platform Market Size & Forecast, By End-use, 2021 – 2032
8.4.5.7 Rest of Asia-Pacific
8.4.5.7.1 Carbon Credit Trading Platform Market Size & Forecast, By Type, 2021 – 2032
8.4.5.7.2 Carbon Credit Trading Platform Market Size & Forecast, By System Type, 2021 – 2032
8.4.5.7.3 Carbon Credit Trading Platform Market Size & Forecast, By End-use, 2021 – 2032
8.5 Latin America
8.5.1 Key Trends
8.5.2 Carbon Credit Trading Platform Market Size & Forecast, By Type, 2021 – 2032
8.5.3 Carbon Credit Trading Platform Market Size & Forecast, By System Type, 2021 – 2032
8.5.4 Carbon Credit Trading Platform Market Size & Forecast, By End-use, 2021 – 2032
8.5.5 Carbon Credit Trading Platform Market Size & Forecast, By Country, 2021 – 2032
8.5.5.1 Brazil
8.5.5.1.1 Carbon Credit Trading Platform Market Size & Forecast, By Type, 2021 – 2032
8.5.5.1.2 Carbon Credit Trading Platform Market Size & Forecast, By System Type, 2021 – 2032
8.5.5.1.3 Carbon Credit Trading Platform Market Size & Forecast, By End-use, 2021 – 2032
8.5.5.2 Argentina
8.5.5.2.1 Carbon Credit Trading Platform Market Size & Forecast, By Type, 2021 – 2032
8.5.5.2.2 Carbon Credit Trading Platform Market Size & Forecast, By System Type, 2021 – 2032
8.5.5.2.3 Carbon Credit Trading Platform Market Size & Forecast, By End-use, 2021 – 2032
8.5.5.3 Mexico
8.5.5.3.1 Carbon Credit Trading Platform Market Size & Forecast, By Type, 2021 – 2032
8.5.5.3.2 Carbon Credit Trading Platform Market Size & Forecast, By System Type, 2021 – 2032
8.5.5.3.3 Carbon Credit Trading Platform Market Size & Forecast, By End-use, 2021 – 2032
8.5.5.4 Colombia
8.5.5.4.1 Carbon Credit Trading Platform Market Size & Forecast, By Type, 2021 – 2032
8.5.5.4.2 Carbon Credit Trading Platform Market Size & Forecast, By System Type, 2021 – 2032
8.5.5.4.3 Carbon Credit Trading Platform Market Size & Forecast, By End-use, 2021 – 2032
8.5.5.5 Rest of Latin America
8.5.5.5.1 Carbon Credit Trading Platform Market Size & Forecast, By Type, 2021 – 2032
8.5.5.5.2 Carbon Credit Trading Platform Market Size & Forecast, By System Type, 2021 – 2032
8.5.5.5.3 Carbon Credit Trading Platform Market Size & Forecast, By End-use, 2021 – 2032
8.6 Middle East & Africa
8.6.1 Key Trends
8.6.2 Carbon Credit Trading Platform Market Size & Forecast, By Type, 2021 – 2032
8.6.3 Carbon Credit Trading Platform Market Size & Forecast, By System Type, 2021 – 2032
8.6.4 Carbon Credit Trading Platform Market Size & Forecast, By End-use, 2021 – 2032
8.6.5 Carbon Credit Trading Platform Market Size & Forecast, By Country, 2021 – 2032
8.6.5.1 UAE
8.6.5.1.1 Carbon Credit Trading Platform Market Size & Forecast, By Type, 2021 – 2032
8.6.5.1.2 Carbon Credit Trading Platform Market Size & Forecast, By System Type, 2021 – 2032
8.6.5.1.3 Carbon Credit Trading Platform Market Size & Forecast, By End-use, 2021 – 2032
8.6.5.2 Saudi Arabia
8.6.5.2.1 Carbon Credit Trading Platform Market Size & Forecast, By Type, 2021 – 2032
8.6.5.2.2 Carbon Credit Trading Platform Market Size & Forecast, By System Type, 2021 – 2032
8.6.5.2.3 Carbon Credit Trading Platform Market Size & Forecast, By End-use, 2021 – 2032
8.6.5.3 Qatar
8.6.5.3.1 Carbon Credit Trading Platform Market Size & Forecast, By Type, 2021 – 2032
8.6.5.3.2 Carbon Credit Trading Platform Market Size & Forecast, By System Type, 2021 – 2032
8.6.5.3.3 Carbon Credit Trading Platform Market Size & Forecast, By End-use, 2021 – 2032
8.6.5.4 Egypt
8.6.5.4.1 Carbon Credit Trading Platform Market Size & Forecast, By Type, 2021 – 2032
8.6.5.4.2 Carbon Credit Trading Platform Market Size & Forecast, By System Type, 2021 – 2032
8.6.5.4.3 Carbon Credit Trading Platform Market Size & Forecast, By End-use, 2021 – 2032
8.6.5.5 South Africa
8.6.5.5.1 Carbon Credit Trading Platform Market Size & Forecast, By Type, 2021 – 2032
8.6.5.5.2 Carbon Credit Trading Platform Market Size & Forecast, By System Type, 2021 – 2032
8.6.5.5.3 Carbon Credit Trading Platform Market Size & Forecast, By End-use, 2021 – 2032
8.6.5.6 Rest of Middle East & Africa
8.6.5.6.1 Carbon Credit Trading Platform Market Size & Forecast, By Type, 2021 – 2032
8.6.5.6.2 Carbon Credit Trading Platform Market Size & Forecast, By System Type, 2021 – 2032
8.6.5.6.3 Carbon Credit Trading Platform Market Size & Forecast, By End-use, 2021 – 2032
9. Competitive Landscape
9.1 Key Players' Positioning
9.2 Competitive Developments
9.2.1 Key Strategies Adopted (%), By Key Players, 2024
9.2.2 Year-Wise Strategies & Development, 2021 – 2025
9.2.3 Number Of Strategies Adopted By Key Players, 2024
9.3 Market Share Analysis, 2024
9.4 Product/Service & Application Benchmarking
9.4.1 Product/Service Specifications & Features By Key Players
9.4.2 Product/Service Heatmap By Key Players
9.4.3 Application Heatmap By Key Players
9.5 Industry Start-Up & Innovation Landscape
9.6 Key Company Profiles
9.6.1 Nasdaq, Inc.
9.6.1.1 Company Overview & Snapshot
9.6.1.2 Product/Service Portfolio
9.6.1.3 Key Company Financials
9.6.1.4 SWOT Analysis
9.6.2 EEX Group
9.6.3 Carbon Trade Exchange
9.6.4 Air Carbon Exchange (ACX)
9.6.5 Carbonplace
9.6.6 CME Group
9.6.7 Xpansiv
9.6.8 Climate Trade
9.6.9 Planetly
9.6.10 Toucan
9.6.11 Carbon Credit Capital
9.6.12 Flowcarbon
9.6.13 Likvidi
9.6.14 Carbonex
9.6.15 Betacarbon
9.6.16 Carbon Streaming Corporation
9.6.17 Verra
9.6.18 South Pole
9.6.19 EcoAct
9.6.20 Cloverly
10. Analyst Recommendations
10.1 SNS Insider Opportunity Map
10.2 Industry Low-Hanging Fruit Assessment
10.3 Market Entry & Growth Strategy
10.4 Analyst Viewpoint & Suggestions On Market Growth
11. Assumptions
12. Disclaimer
13. Appendix
13.1 List Of Tables
13.2 List Of Figures
Key Segments:
By Type
-
Voluntary Carbon Market
-
Regulated Carbon Market
By System Type
-
Cap & Trade
-
Baseline & Credit
By End-use
-
Utilities
-
Industrial
-
Aviation
-
Petrochemical
-
Energy
-
Others
Request for Segment Customization as per your Business Requirement: Segment Customization Request
Regional Coverage:
North America
-
US
-
Canada
Europe
-
Germany
-
UK
-
France
-
Italy
-
Spain
-
Russia
-
Poland
-
Rest of Europe
Asia Pacific
-
China
-
India
-
Japan
-
South Korea
-
Australia
-
ASEAN Countries
-
Rest of Asia Pacific
Middle East & Africa
-
UAE
-
Saudi Arabia
-
Qatar
-
South Africa
-
Rest of Middle East & Africa
Latin America
-
Brazil
-
Argentina
-
Mexico
-
Colombia
-
Rest of Latin America
Request for Country Level Research Report: Country Level Customization Request
Available Customization
With the given market data, SNS Insider offers customization as per the company’s specific needs. The following customization options are available for the report:
-
Detailed Volume Analysis
-
Criss-Cross segment analysis (e.g. Product X Application)
-
Competitive Product Benchmarking
-
Geographic Analysis
-
Additional countries in any of the regions
-
Customized Data Representation
-
Detailed analysis and profiling of additional market players
An accurate research report requires proper strategizing as well as implementation. There are multiple factors involved in the completion of good and accurate research report and selecting the best methodology to compete the research is the toughest part. Since the research reports we provide play a crucial role in any company’s decision-making process, therefore we at SNS Insider always believe that we should choose the best method which gives us results closer to reality. This allows us to reach at a stage wherein we can provide our clients best and accurate investment to output ratio.
Each report that we prepare takes a timeframe of 350-400 business hours for production. Starting from the selection of titles through a couple of in-depth brain storming session to the final QC process before uploading our titles on our website we dedicate around 350 working hours. The titles are selected based on their current market cap and the foreseen CAGR and growth.
The 5 steps process:
Step 1: Secondary Research:
Secondary Research or Desk Research is as the name suggests is a research process wherein, we collect data through the readily available information. In this process we use various paid and unpaid databases which our team has access to and gather data through the same. This includes examining of listed companies’ annual reports, Journals, SEC filling etc. Apart from this our team has access to various associations across the globe across different industries. Lastly, we have exchange relationships with various university as well as individual libraries.

Step 2: Primary Research
When we talk about primary research, it is a type of study in which the researchers collect relevant data samples directly, rather than relying on previously collected data. This type of research is focused on gaining content specific facts that can be sued to solve specific problems. Since the collected data is fresh and first hand therefore it makes the study more accurate and genuine.
We at SNS Insider have divided Primary Research into 2 parts.
Part 1 wherein we interview the KOLs of major players as well as the upcoming ones across various geographic regions. This allows us to have their view over the market scenario and acts as an important tool to come closer to the accurate market numbers. As many as 45 paid and unpaid primary interviews are taken from both the demand and supply side of the industry to make sure we land at an accurate judgement and analysis of the market.
This step involves the triangulation of data wherein our team analyses the interview transcripts, online survey responses and observation of on filed participants. The below mentioned chart should give a better understanding of the part 1 of the primary interview.

Part 2: In this part of primary research the data collected via secondary research and the part 1 of the primary research is validated with the interviews from individual consultants and subject matter experts.
Consultants are those set of people who have at least 12 years of experience and expertise within the industry whereas Subject Matter Experts are those with at least 15 years of experience behind their back within the same space. The data with the help of two main processes i.e., FGDs (Focused Group Discussions) and IDs (Individual Discussions). This gives us a 3rd party nonbiased primary view of the market scenario making it a more dependable one while collation of the data pointers.
Step 3: Data Bank Validation
Once all the information is collected via primary and secondary sources, we run that information for data validation. At our intelligence centre our research heads track a lot of information related to the market which includes the quarterly reports, the daily stock prices, and other relevant information. Our data bank server gets updated every fortnight and that is how the information which we collected using our primary and secondary information is revalidated in real time.

Step 4: QA/QC Process
After all the data collection and validation our team does a final level of quality check and quality assurance to get rid of any unwanted or undesired mistakes. This might include but not limited to getting rid of the any typos, duplication of numbers or missing of any important information. The people involved in this process include technical content writers, research heads and graphics people. Once this process is completed the title gets uploader on our platform for our clients to read it.
Step 5: Final QC/QA Process:
This is the last process and comes when the client has ordered the study. In this process a final QA/QC is done before the study is emailed to the client. Since we believe in giving our clients a good experience of our research studies, therefore, to make sure that we do not lack at our end in any way humanly possible we do a final round of quality check and then dispatch the study to the client.