Carrageenan Market Analysis & Overview:

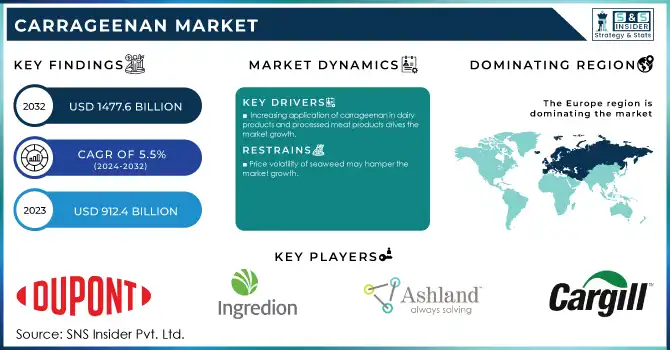
The Carrageenan Market size was USD 975.20 Million in 2024 and is expected to reach USD 1477.60 Million by 2032 and grow at a CAGR of 6.12% over the forecast period of 2025-2032.

The growing consumer influence for natural and clean-label ingredients is the key driver for the global carrageenan market. Today's consumers tend to be more health-conscious and look for food made from natural and minimally processed ingredients that contribute to their health and wellness goals. Carrageenan, a natural, plant-based ingredient from red seaweed, perfectly meets this demand. It does so as of its capacity to act as a stabilizer, thickener, and a gelling agent when no synthetic additives are required. It is gaining the favor of many manufacturers making all efforts to meet the clean-label standards.

For instance, the U.S. Food and Drug Administration (FDA) has updated the criteria for foods labeled as "healthy," limiting added sugars, saturated fats, and sodium to ensure alignment with dietary recommendations.

Carrageenan Market Revenue Analysis

Get E-PDF Sample Report on Carrageenan Market - Request Sample Report

Key Carrageenan Market Trends

  • Rising demand for clean-label and plant-based ingredients

  • Growth in functional foods and nutraceuticals

  • Expansion in the pharmaceutical and personal care sectors

  • Sustainability and ethical sourcing focus

  • Innovation in processed food formulations

  • Regulatory scrutiny and safety debates

Carrageenan Market Growth Drivers

  • Growing Use of Carrageenan in Dairy and Processed Meat Products Fuels Market Growth

One of the major driving factors of the market is the rising usage of carrageenan in dairy products and processed meat products. Carrageenan Market Trends highlight its widespread use in dairy products, where it is added as a stabilizer and thickener in chocolate milk, cream, yogurt, and other dairy desserts. The ingredient allows the product texture to be more stable, avoids the separation of ingredients, and increases the overall shelf life. In processed meat products, carrageenan is used to improve water binding, juiciness, and firm texture. Its water-binding and gelling properties make it highly valuable in items such as sausages, hams, and deli meats.

The increasing use of carrageenan in these applications is aligned with the accelerating demand for convenience foods and high-quality products, which continues to drive demand in the market. Furthermore, the expressive natural and clean-label nature of carrageenan supports changing consumer preferences, further enhancing its adoption in food formulations.

In April 2022, Bang & Bonsomer, based in Finland, acquired all shares of Eurogum A/S (Denmark) and Eurogum Polska Sp Zoo (Poland). Eurogum specializes in the production of carrageenan and alginate for the food industry.

Carrageenan Market Restraints

  • Price Volatility of Seaweed May Hamper the Market Growth

Price fluctuation of seaweed is one of the crucial restraining factors for global Carrageenan Market growth. As carrageenan is sourced from red seaweed, any variations in the supply and price of seaweed automatically impact the production costs of carrageenan. Weather conditions, natural disasters, and over-harvesting all create uncertainty around seaweed supply. Furthermore, the price volatility can be raised by variations in seaweed farming practices and the quantity harvested in specific regions. This volatility in raw material costs may lead to increased production expenses for carrageenan, affecting the overall Carrageenan Market analysis by contributing to higher product prices. Manufacturers might have to absorb these costs, reducing profit margins, or pass them on to consumers, potentially decreasing demand for carrageenan-based products especially in price-sensitive or low-margin markets

Carrageenan Market Segmentation Analysis:

By Product Type

The Kappa segment held the largest market share around 65% in 2023. It is owing to significant application across the food and beverage industry coupled with high demand. Kappa carrageenan is prized for its gelling ability and is commonly used in several products including dairy desserts, puddings, and jams. In meat products, it is also used to provide texture and help bind water. The excellent gel strength of kappa carrageenan makes it the first choice of many manufacturers when formulating for consistency. This property of forming stable gels with low concentrations and being compatible with other ingredients has led to its leading position in the market. At the same time, its status as a natural and clean-label product meets increased consumer interest in health-promoting minimally processed foods. All these factors contribute to the largest market share of kappa carrageenan, thus establishing it as a leading variant of the market of carrageenan.

By Processing Technology  

The semi-refined carrageenan segment held the largest market share, around 48%, in 2023. This is owing to its low price and wide application scope. Carrageenan companies looking to satisfy consumer demand for natural, clean-label products have increasingly turned to semi-refined carrageenan, which is less processed than fully refined carrageenan and thus retains more of its natural components. This type of carrageenan is frequently found in dairy, non-dairy drinks, and processed meats, where it acts as a thickener, stabilizer, and gelling agent. It displays excellent gelling properties and texture at a lower cost compared to fully refined carrageenan, making it ideal for industries with tighter budgets. Moreover, the shifting preference toward natural ingredients in food products continues to propel demand for semi-refined carrageenan, which is viewed by many as an eco-friendlier and more natural alternative factor driving innovation among carrageenan companies

By Function

Thickening agents held the largest market share, around 35%, in 2023. This is due to their significant functional contribution to a variety of industrial applications, especially in food and beverage. A key factor driving carrageenan market growth is its widespread use as a common thickener, owing to its ability to enhance a product's viscosity without altering the taste or appearance of liquid-based products. In the food industry, its value is particularly evident in sauces, soups, dairy products, and beverages, where achieving the right texture and consistency is crucial. The gelation and smooth, creamy textural properties of carrageenan make it attractive for numerous applications, including dairy desserts, non-dairy beverages, and plant-based alternatives. Its versatility and efficiency at low concentrations also contribute to its appeal as a cost-effective option for manufacturers.

By Application

Food & Beverage held the largest market share around 65% in 2023. It is used in food and beverage products, carrageenan effectively functions as a thickener, gelling agent, stabilizer, and emulsifier. Frequently used in ice cream, yogurt, and dairy-based goods, it improves a product's texture, keeps ingredients from separating, and enhances shelf life. In processed meats, plant-based substitutes, sauces, soups, and drinks for example, carrageenan is an important texturizing agent that functions to improve body and mouthfeel. Carrageenan is a natural ingredient derived from seaweed and is best suited to meet these consumer demands for clean-label, natural ingredients. Due to its high-quality texture and economic value, it has become a favored food manufacturing option.

Carrageenan Market Regional Outlook

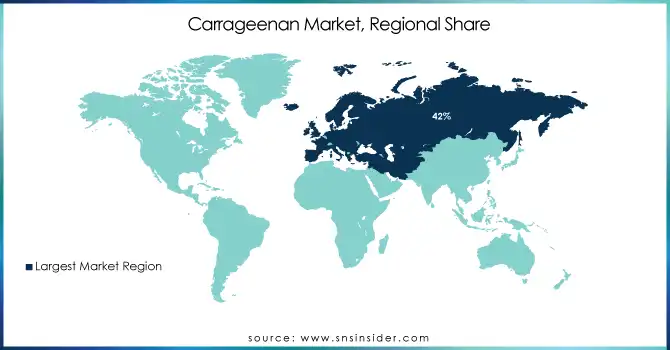
Europe Carrageenan Market Insights

Europe held the largest market share around 42% in 2024. This is due to increased consumption of high functionality in food and beverage industries, pharmaceutical, and cosmetic products in the region, owing to the clean-label and natural product trend. In the European market, carrageenan, a gelling, thickening, and stabilizing agent, is one of the most widely used ingredients in the food and beverage industry, made with a well-established, modern industry in place, covering retail products including dairy, meat, sauces and plant-based foods.

In addition, Europe sets very high regulatory standards, so the increasing emphasis on natural and safe ingredients has led to a rise in the Carrageenan Market share as it becomes a preferred food additive. Its market position is also bolstered by the regional growth of plant-based food that requires carrageenan for texture and consistency. Apart from food applications, it is also used in pharmaceuticals and personal care products across Europe, further enhancing its revenue-generation potential. Consequently, the regional market is expected to grow, owing to the increasing preference of manufacturers in Europe for carrageenan (a renewable and biodegradable product), as consumers are highly aware of sustainability.

Asia Pacific Carrageenan Market Insights

Asia Pacific will be leading the global carrageenan market in 2024 on account of large-scale seaweed production across its countries, such as the Philippines, Indonesia, and China, which are key raw material suppliers. Growing applications from the food & beverage industry, including dairy, confectionery, and meat, are expected to drive growth, with increasing acceptance in pharmaceutical and personal care applications also offering opportunities. Low-cost manufacturing cost structure and significant investments in processing capacity are the key factors that propel Asia Pacific into a global player in terms of carrageenan production and export.

North America Carrageenan Market Insights

The North American market will grow steadily through 2024 due to increasing consumption of clean-label, plant-based, and natural food additives. The U.S. is the largest user the seaweed on a large scale for processed food and dairy alternatives, and in beverages to gel and stabilize products. Rigorous food safety standards and consumer demand for organic and non-genetically modified organism (GMO) ingredients are driving food and personal care manufacturing to a broader product offering, thereby driving the adoption of carrageenan in food and personal care applications.

Latin America (LATAM) Carrageenan Market Insights

Promising Market for Carrageenan in LATAM From 2019-2024 The LATAM carrageenan market is witnessing demand, due to the growth in this region is favored by a rise in demand in the food processing, dairy, and confectionery industries. Brazil and Mexico, which have high consumption of processed food and an increasing interest in plant-derived additives, are the two leading markets, driving adoption. Besides, shore-based investments in seaweed farming and processing by the locals would enhance the significance of the region in the international carrageenan supply chain.

Middle East & Africa (MEA) Carrageenan Market Insights

The MEA Carrageenan market has been witnessing moderate growth currently. The demand for carrageenan-based products is largely emerging from the food & beverage industry, particularly in dairy, confectionery, and halal-certified food products. Countries such as Saudi Arabia, UAE, and South Africa are inclining their preference towards carrageenan as a stabilizer and thickening agent in processed and packaged food, the popularity of which is escalating. Furthermore, the booming pharmaceutical industry and cosmetics industry along with increasing consumer focus towards natural additives, is also boosting the carrageenan demand in the region.

Carrageenan-Market-Regional-Share

Get Customized Report as Per Your Business Requirement - Request For Customized Report

Competitive Landscape for Carrageenan Market

  • DuPont
    DuPont is a global science and innovation leader, providing specialty ingredients, materials, and sustainable solutions across industries, including food, beverages, and healthcare.

    • In 2023, DuPont expanded its range of natural and clean-label ingredients, introducing new bio-based solutions derived from sustainable sources. This expansion included carrageenan as a key component in its clean-label offerings, targeting the growing demand from the food and beverage sector.

  • Ingredion
    Ingredion is a leading global provider of ingredient solutions for the food, beverage, and industrial markets, with a focus on clean-label, plant-based, and functional formulations.

    • In 2022, Ingredion launched its Clearblend line of carrageenan products designed for plant-based food applications. The launch aimed to address the rising demand for vegan and vegetarian alternatives by offering carrageenan solutions that enhance texture and mouthfeel in dairy alternatives and other plant-based foods.

Carrageenan Market Companies are:

  • DuPont (Genencare, Cholecalciferol)
  • Ingredion Incorporated (Clearblend, Viscosity Control)
  • Ashland (Keltrol, Polysaccharides)
  • CP Kelco U.S., Inc. (Gellan Gum, Keltrol)
  • Cargill, Inc. (Stabilizer, Texturizing Agent)
  • Ceamsa (Kappa, Iota Carrageenan)
  • W Hydrocolloids, Inc. (LBG, Seaweed Extracts)
  • Gelymar (CarraLact VPD, CarraLact VFL)
  • Caldic B.V. (Gellan Gum, Alginate)
  • Ina Food Industry Co. Ltd. (Carrageenan Powder, Gel)
  • PT. Gumindo Perkasa Industries (Semi-Refined Carrageenan, Refined Carrageenan)
  • TBK Manufacturing Corporation (TBK-20, TBK-25)
  • FMC Corporation (Alginate, Agar)
  • Marinochem (Marin Carrageenan, Seaweed Extracts)
  • Eurogum (Carrageenan, Seaweed Derivatives)
  • TIC Gums (Ticaloid, Ticaloid Ultra)
  • Gum Technology Corporation (Xanthan Gum, Guar Gum)
  • Neogalen (Natural Gels, Gelatin)
  • Hongmao (Kappa Carrageenan, Iota Carrageenan)
  • Seaweed Solutions (Seaweed Gel, Hydrosol Carrageenan)

Carrageenan Market Report Scope:

Report Attributes Details
Market Size in 2024  US$ 975.20 Mn
Market Size by 2032  US$ 1477.60 Mn
CAGR   CAGR of 6.12% From 2025 to 2032
Base Year  2024
Forecast Period  2025-2032
Historical Data  2021-2023
Report Scope & Coverage Market Size, Segments Analysis, Competitive  Landscape, Regional Analysis, DROC & SWOT Analysis, Forecast Outlook
Key Segments

• By Processing Technology (Alcohol Precipitation, Gel Press, and Semi-refined)
• By Function (Thickening Agent, Gelling Agent, Stabilizer, and Others)
• By Product Type (Kappa, Iota, and Lambda), By Application (Food & Beverage, Pharmaceutical, Personal Care & Cosmetics, Others)

Regional Analysis/Coverage North America (US, Canada), Europe (Germany, France, UK, Italy, Spain, Poland, Russsia, Rest of Europe), Asia Pacific (China, India, Japan, South Korea, Australia,ASEAN Countries, Rest of Asia Pacific), Middle East & Africa (UAE, Saudi Arabia, Qatar, Egypt, South Africa, Rest of Middle East & Africa), Latin America (Brazil, Argentina,    Mexico,     Colombia Rest of Latin America)
Company Profiles DuPont, Ingredion Incorporated, Ashland, CP Kelco U.S., Inc., Cargill, Inc., Ceamsa, W Hydrocolloids, Inc., Gelymar, Caldic B.V., Ina Food Industry Co. Ltd., PT. Gumindo Perkasa Industries, TBK Manufacturing Corporation, and other

Table Of Contents

1. Introduction

1.1 Market Definition & Scope

 1.2 Research Assumptions & Abbreviations

 1.3 Research Methodology

2. Executive Summary

2.1 Market Snapshot

 2.2 Market Absolute $ Opportunity Assessment & Y-o-Y Analysis, 2021–2032

 2.3 Market Size & Forecast, By Segmentation, 2021–2032

  2.3.1 Market Size By Product Type

  2.3.2 Market Size By Processing Technology

         2.3.3 Market Size By Function

         2.3.4 Market Size By Application

 2.4 Market Share & BPS Analysis By Region, 2024

 2.5 Industry Growth Scenarios – Conservative, Likely & Optimistic

 2.6 Industry CxO’s Perspective

3. Market Overview

3.1 Market Dynamics

  3.1.1 Drivers

  3.1.2 Restraints

  3.1.3 Opportunities

  3.1.4 Key Market Trends

 3.2 Industry PESTLE Analysis

 3.3 Key Industry Forces (Porter’s) Impacting Market Growth

 3.4 Industry Life Cycle Assessment

 3.5 Parent Market Overview

 3.6 Market Risk Assessment

4. Statistical Insights & Trends Reporting

4.1 Value Chain & Profit Pool Analysis

     4.2 Raw Material Sustainability & Seaweed Farming Economics

4.3 Technology & Process Innovation Roadmap

    4.4 Regulatory & Policy Outlook

    4.5 End-User Industry Case Studies & Benchmarking

    4.6 Scenario Forecasting & Disruption Analysis

    5. Carrageenan Market Segmental Analysis & Forecast, By Product Type, 2021 – 2032, Value (USD Million)

5.1 Introduction

 5.2 Kappa

  5.2.1 Key Trends

  5.2.2 Market Size & Forecast, 2021 – 2032

 5.3 Iota

  5.3.1 Key Trends

  5.3.2 Market Size & Forecast, 2021 – 2032

    5.4 Lambda

  5.4.1 Key Trends

  6. Carrageenan Market Segmental Analysis & Forecast, By Processing Technology, 2021 – 2032, Value (USD Million)

    6.1 Introduction

 6.2 Alcohol Precipitation

  6.2.1 Key Trends

  6.2.2 Market Size & Forecast, 2021 – 2032

 6.3 Gel Press

  6.3.1 Key Trends

  6.3.2 Market Size & Forecast, 2021 – 2032

    6.4 Semi-refined

  6.4.1 Key Trends

  6.4.2 Market Size & Forecast, 2021 – 2032

7. Carrageenan Market Segmental Analysis & Forecast, By Function, 2021 – 2032, Value (USD Million)

    7.1 Introduction

 7.2 Thickening Agents

  7.2.1 Key Trends

  7.2.2 Market Size & Forecast, 2021 – 2032

 7.3 Gelling Agents

  7.3.1 Key Trends

  7.3.2 Market Size & Forecast, 2021 – 2032

7.4 Stabilizers

  7.4.1 Key Trends

  7.4.2 Market Size & Forecast, 2021 – 2032

7.5 Others

  7.5.1 Key Trends

  7.5.2 Market Size & Forecast, 2021 – 2032

8. Carrageenan Market Segmental Analysis & Forecast, By Application, 2021 – 2032, Value (USD Million)

    8.1 Introduction

 8.2 Food & Beverage

  8.2.1 Key Trends

  8.2.2 Market Size & Forecast, 2021 – 2032

 8.3 Pharmaceutical

  8.3.1 Key Trends

  8.3.2 Market Size & Forecast, 2021 – 2032

 8.4 Personal Care & Cosmetics

  8.4.1 Key Trends

  8.4.2 Market Size & Forecast, 2021 – 2032

 8.5 Others

  8.5.1 Key Trends

  8.5.2 Market Size & Forecast, 2021 – 2032

 9. Carrageenan Market Segmental Analysis & Forecast by Region, 2021 – 2025, Value (USD Million)

9.1 Introduction

9.2 North America

 9.2.1 Key Trends

 9.2.2 Carrageenan Market Size & Forecast, By Product Type, 2021 – 2032

 9.2.3 Carrageenan Market Size & Forecast, By Processing Technology, 2021 – 2032

 9.2.4 Carrageenan Market Size & Forecast, By Function, 2021 – 2032

 9.2.5 Carrageenan Market Size & Forecast, By Application, 2021 – 2032

 9.2.6 Carrageenan Market Size & Forecast, By Country, 2021 – 2032

  9.2.6.1 USA

   9.2.6.1.1 Carrageenan Market Size & Forecast, By Product Type, 2021 – 2032

   9.2.6.1.2 Carrageenan Market Size & Forecast, By Processing Technology, 2021 – 2032

   9.2.6.1.3 Carrageenan Market Size & Forecast, By Function, 2021 – 2032

   9.2.6.1.4 Carrageenan Market Size & Forecast, By Application, 2021 – 2032

  9.2.6.2 Canada

   9.2.6.2.1 Carrageenan Market Size & Forecast, By Product Type, 2021 – 2032

   9.2.6.2.2 Carrageenan Market Size & Forecast, By Processing Technology, 2021 – 2032

   9.2.6.2.3 Carrageenan Market Size & Forecast, By Function, 2021 – 2032

   9.2.6.2.4 Carrageenan Market Size & Forecast, By Application, 2021 – 2032

9.3 Europe

 9.3.1 Key Trends

 9.3.2 Carrageenan Market Size & Forecast, By Product Type, 2021 – 2032

 9.3.3 Carrageenan Market Size & Forecast, By Processing Technology, 2021 – 2032

 9.3.4 Carrageenan Market Size & Forecast, By Function, 2021 – 2032

 9.3.5 Carrageenan Market Size & Forecast, By Application, 2021 – 2032

 9.3.6 Carrageenan Market Size & Forecast, By Country, 2021 – 2032

  9.3.6.1 Germany

   9.3.6.1.1 Carrageenan Market Size & Forecast, By Product Type, 2021 – 2032

   9.3.6.1.2 Carrageenan Market Size & Forecast, By Processing Technology, 2021 – 2032

   9.3.6.1.3 Carrageenan Market Size & Forecast, By Function, 2021 – 2032

   9.3.6.1.4 Carrageenan Market Size & Forecast, By Application, 2021 – 2032

  9.3.6.2 UK

   9.3.6.2.1 Carrageenan Market Size & Forecast, By Product Type, 2021 – 2032

   9.3.6.2.2 Carrageenan Market Size & Forecast, By Processing Technology, 2021 – 2032

   9.3.6.2.3 Carrageenan Market Size & Forecast, By Function, 2021 – 2032

   9.3.6.2.4 Carrageenan Market Size & Forecast, By Application, 2021 – 2032

  9.3.6.3 France

   9.3.6.3.1 Carrageenan Market Size & Forecast, By Product Type, 2021 – 2032

   9.3.6.3.2 Carrageenan Market Size & Forecast, By Processing Technology, 2021 – 2032

   9.3.6.3.3 Carrageenan Market Size & Forecast, By Function, 2021 – 2032

   9.3.6.3.4 Carrageenan Market Size & Forecast, By Application, 2021 – 2032

  9.3.6.4 Italy

   9.3.6.4.1 Carrageenan Market Size & Forecast, By Product Type, 2021 – 2032

   9.3.6.4.2 Carrageenan Market Size & Forecast, By Processing Technology, 2021 – 2032

   9.3.6.4.3 Carrageenan Market Size & Forecast, By Function, 2021 – 2032

   9.3.6.4.4 Carrageenan Market Size & Forecast, By Application, 2021 – 2032

  9.3.6.5 Spain

   9.3.6.5.1 Carrageenan Market Size & Forecast, By Product Type, 2021 – 2032

   9.3.6.5.2 Carrageenan Market Size & Forecast, By Processing Technology, 2021 – 2032

   9.3.6.5.3 Carrageenan Market Size & Forecast, By Function, 2021 – 2032

   9.3.6.5.4 Carrageenan Market Size & Forecast, By Application, 2021 – 2032

  9.3.6.6 Russia

   9.3.6.6.1 Carrageenan Market Size & Forecast, By Product Type, 2021 – 2032

   9.3.6.6.2 Carrageenan Market Size & Forecast, By Processing Technology, 2021 – 2032

   9.3.6.6.3 Carrageenan Market Size & Forecast, By Function, 2021 – 2032

   9.3.6.6.4 Carrageenan Market Size & Forecast, By Application, 2021 – 2032

  9.3.6.7 Poland

   9.3.6.7.1 Carrageenan Market Size & Forecast, By Product Type, 2021 – 2032

   9.3.6.7.2 Carrageenan Market Size & Forecast, By Processing Technology, 2021 – 2032

   9.3.6.7.3 Carrageenan Market Size & Forecast, By Function, 2021 – 2032

   9.3.6.7.4 Carrageenan Market Size & Forecast, By Application, 2021 – 2032

  9.3.6.8 Rest of Europe

   9.3.6.8.1 Carrageenan Market Size & Forecast, By Product Type, 2021 – 2032

   9.3.6.8.2 Carrageenan Market Size & Forecast, By Processing Technology, 2021 – 2032

   9.3.6.8.3 Carrageenan Market Size & Forecast, By Function, 2021 – 2032

   9.3.6.8.4 Carrageenan Market Size & Forecast, By Application, 2021 – 2032   

9.4 Asia-Pacific

 9.4.1 Key Trends

 9.4.2 Carrageenan Market Size & Forecast, By Product Type, 2021 – 2032

 9.4.3 Carrageenan Market Size & Forecast, By Processing Technology, 2021 – 2032

 9.4.4 Carrageenan Market Size & Forecast, By Function, 2021 – 2032

 9.4.5 Carrageenan Market Size & Forecast, By Application, 2021 – 2032

 9.4.6 Carrageenan Market Size & Forecast, By Country, 2021 – 2032

  9.4.6.1 China

   9.4.6.1.1 Carrageenan Market Size & Forecast, By Product Type, 2021 – 2032

   9.4.6.1.2 Carrageenan Market Size & Forecast, By Processing Technology, 2021 – 2032

   9.4.6.1.3 Carrageenan Market Size & Forecast, By Function, 2021 – 2032

   9.4.6.1.4 Carrageenan Market Size & Forecast, By Application, 2021 – 2032

  9.4.6.2 India

   9.4.6.2.1 Carrageenan Market Size & Forecast, By Product Type, 2021 – 2032

   9.4.6.2.2 Carrageenan Market Size & Forecast, By Processing Technology, 2021 – 2032

   9.4.6.2.3 Carrageenan Market Size & Forecast, By Function, 2021 – 2032

   9.4.6.2.4 Carrageenan Market Size & Forecast, By Application, 2021 – 2032

  9.4.6.3 Japan

   9.4.6.3.1 Carrageenan Market Size & Forecast, By Product Type, 2021 – 2032

   9.4.6.3.2 Carrageenan Market Size & Forecast, By Processing Technology, 2021 – 2032

   9.4.6.3.3 Carrageenan Market Size & Forecast, By Function, 2021 – 2032

   9.4.6.3.4 Carrageenan Market Size & Forecast, By Application, 2021 – 2032

  9.4.6.4 South Korea

   9.4.6.4.1 Carrageenan Market Size & Forecast, By Product Type, 2021 – 2032

   9.4.6.4.2 Carrageenan Market Size & Forecast, By Processing Technology, 2021 – 2032

   9.4.6.4.3 Carrageenan Market Size & Forecast, By Function, 2021 – 2032

   9.4.6.4.4 Carrageenan Market Size & Forecast, By Application, 2021 – 2032

  9.4.6.5 Australia

   9.4.6.5.1 Carrageenan Market Size & Forecast, By Product Type, 2021 – 2032

   9.4.6.5.2 Carrageenan Market Size & Forecast, By Processing Technology, 2021 – 2032

   9.4.6.5.3 Carrageenan Market Size & Forecast, By Function, 2021 – 2032

   9.4.6.5.4 Carrageenan Market Size & Forecast, By Application, 2021 – 2032

  9.4.6.6 ASEAN Countries

   9.4.6.6.1 Carrageenan Market Size & Forecast, By Product Type, 2021 – 2032

   9.4.6.6.2 Carrageenan Market Size & Forecast, By Processing Technology, 2021 – 2032

   9.4.6.6.3 Carrageenan Market Size & Forecast, By Function, 2021 – 2032

   9.4.6.6.4 Carrageenan Market Size & Forecast, By Application, 2021 – 2032

  9.4.6.7 Rest of Asia-Pacific

   9.4.6.7.1 Carrageenan Market Size & Forecast, By Product Type, 2021 – 2032

   9.4.6.7.2 Carrageenan Market Size & Forecast, By Processing Technology, 2021 – 2032

   9.4.6.7.3 Carrageenan Market Size & Forecast, By Function, 2021 – 2032

   9.4.6.7.4 Carrageenan Market Size & Forecast, By Application, 2021 – 2032

9.5 Latin America

 9.5.1 Key Trends

 9.5.2 Carrageenan Market Size & Forecast, By Product Type, 2021 – 2032

 9.5.3 Carrageenan Market Size & Forecast, By Processing Technology, 2021 – 2032

 9.5.4 Carrageenan Market Size & Forecast, By Function, 2021 – 2032

 9.5.5 Carrageenan Market Size & Forecast, By Application, 2021 – 2032

 9.5.6 Carrageenan Market Size & Forecast, By Country, 2021 – 2032

  9.5.6.1 Brazil

   9.5.6.1.1 Carrageenan Market Size & Forecast, By Product Type, 2021 – 2032

   9.5.6.1.2 Carrageenan Market Size & Forecast, By Processing Technology, 2021 – 2032

   9.5.6.1.3 Carrageenan Market Size & Forecast, By Function, 2021 – 2032

   9.5.6.1.4 Carrageenan Market Size & Forecast, By Application, 2021 – 2032

  9.5.6.2 Argentina

   9.5.6.2.1 Carrageenan Market Size & Forecast, By Product Type, 2021 – 2032

   9.5.6.2.2 Carrageenan Market Size & Forecast, By Processing Technology, 2021 – 2032

   9.5.6.2.3 Carrageenan Market Size & Forecast, By Function, 2021 – 2032

   9.5.6.2.4 Carrageenan Market Size & Forecast, By Application, 2021 – 2032

  9.5.6.3 Mexico

   9.5.6.3.1 Carrageenan Market Size & Forecast, By Product Type, 2021 – 2032

   9.5.6.3.2 Carrageenan Market Size & Forecast, By Processing Technology, 2021 – 2032

   9.5.6.3.3 Carrageenan Market Size & Forecast, By Function, 2021 – 2032

   9.5.6.3.4 Carrageenan Market Size & Forecast, By Application, 2021 – 2032

  9.5.6.4 Colombia

   9.5.6.4.1 Carrageenan Market Size & Forecast, By Product Type, 2021 – 2032

   9.5.6.4.2 Carrageenan Market Size & Forecast, By Processing Technology, 2021 – 2032

   9.5.6.4.3 Carrageenan Market Size & Forecast, By Function, 2021 – 2032

   9.5.6.4.4 Carrageenan Market Size & Forecast, By Application, 2021 – 2032

  9.5.6.5 Rest of Latin America

   9.5.6.5.1 Carrageenan Market Size & Forecast, By Product Type, 2021 – 2032

   9.5.6.5.2 Carrageenan Market Size & Forecast, By Processing Technology, 2021 – 2032

   9.5.6.5.3 Carrageenan Market Size & Forecast, By Function, 2021 – 2032

   9.5.6.5.4 Carrageenan Market Size & Forecast, By Application, 2021 – 2032

9.6 Middle East & Africa

 9.6.1 Key Trends

 9.6.2 Carrageenan Market Size & Forecast, By Product Type, 2021 – 2032

 9.6.3 Carrageenan Market Size & Forecast, By Processing Technology, 2021 – 2032

 9.6.4 Carrageenan Market Size & Forecast, By Function, 2021 – 2032

 9.6.5 Carrageenan Market Size & Forecast, By Application, 2021 – 2032

 9.6.6 Carrageenan Market Size & Forecast, By Country, 2021 – 2032

  9.6.6.1 UAE

   9.6.6.1.1 Carrageenan Market Size & Forecast, By Product Type, 2021 – 2032

   9.6.6.1.2 Carrageenan Market Size & Forecast, By Processing Technology, 2021 – 2032

   9.6.6.1.3 Carrageenan Market Size & Forecast, By Function, 2021 – 2032

   9.6.6.1.4 Carrageenan Market Size & Forecast, By Application, 2021 – 2032

  9.6.6.2 Saudi Arabia

   9.6.6.2.1 Carrageenan Market Size & Forecast, By Product Type, 2021 – 2032

   9.6.6.2.2 Carrageenan Market Size & Forecast, By Processing Technology, 2021 – 2032

   9.6.6.2.3 Carrageenan Market Size & Forecast, By Function, 2021 – 2032

   9.6.6.2.4 Carrageenan Market Size & Forecast, By Application, 2021 – 2032

  9.6.6.3 Qatar

   9.6.6.3.1 Carrageenan Market Size & Forecast, By Product Type, 2021 – 2032

   9.6.6.3.2 Carrageenan Market Size & Forecast, By Processing Technology, 2021 – 2032

   9.6.6.3.3 Carrageenan Market Size & Forecast, By Function, 2021 – 2032

   9.6.6.3.4 Carrageenan Market Size & Forecast, By Application, 2021 – 2032

  9.6.6.4 Egypt

   9.6.6.4.1 Carrageenan Market Size & Forecast, By Product Type, 2021 – 2032

   9.6.6.4.2 Carrageenan Market Size & Forecast, By Processing Technology, 2021 – 2032

   9.6.6.4.3 Carrageenan Market Size & Forecast, By Function, 2021 – 2032

   9.6.6.4.4 Carrageenan Market Size & Forecast, By Application, 2021 – 2032

  9.6.6.5 South Africa

   9.6.6.5.1 Carrageenan Market Size & Forecast, By Product Type, 2021 – 2032

   9.6.6.5.2 Carrageenan Market Size & Forecast, By Processing Technology, 2021 – 2032

   9.6.6.5.3 Carrageenan Market Size & Forecast, By Function, 2021 – 2032

   9.6.6.5.4 Carrageenan Market Size & Forecast, By Application, 2021 – 2032

  9.6.6.6 Rest of Middle East & Africa

   9.6.6.6.1 Carrageenan Market Size & Forecast, By Product Type, 2021 – 2032

   9.6.6.6.2 Carrageenan Market Size & Forecast, By Processing Technology, 2021 – 2032

   9.6.6.6.3 Carrageenan Market Size & Forecast, By Function, 2021 – 2032

   9.6.6.6.4 Carrageenan Market Size & Forecast, By Application, 2021 – 2032

10. Competitive Landscape

 10.1 Key Players' Positioning

 10.2 Competitive Developments

  10.2.1 Key Strategies Adopted (%), By Key Players, 2024

  10.2.2 Year-Wise Strategies & Development, 2021 – 2025

  10.2.3 Number of Strategies Adopted by Key Players, 2024

 10.3 Market Share Analysis, 2024

 10.4 Product/Service & End-Use Industry Benchmarking

  10.4.1 Product/Service Specifications & Features By Key Players

  10.4.2 Product/Service Heatmap By Key Players

  10.4.3 End-Use Industry Heatmap By Key Players

 10.5 Industry Start-Up & Innovation Landscape

10.6 Key Company Profiles

 10.6.1 DuPont

  10.6.1.1 Company Overview & Snapshot

  10.6.1.2 Product/Service Portfolio

  10.6.1.3 Key Company Financials

  10.6.1.4 SWOT Analysis

 10.6.2 Ingredion Incorporated

  10.6.2.1 Company Overview & Snapshot

  10.6.2.2 Product/Service Portfolio

  10.6.2.3 Key Company Financials

  10.6.2.4 SWOT Analysis

 10.6.3 Ashland

  10.6.3.1 Company Overview & Snapshot

  10.6.3.2 Product/Service Portfolio

  10.6.3.3 Key Company Financials

  10.6.3.4 SWOT Analysis

 10.6.4 CP Kelco U.S., Inc.

  10.6.4.1 Company Overview & Snapshot

  10.6.4.2 Product/Service Portfolio

  10.6.4.3 Key Company Financials

  10.6.4.4 SWOT Analysis

 10.6.5 Cargill, Inc.

  10.6.5.1 Company Overview & Snapshot

  10.6.5.2 Product/Service Portfolio

  10.6.5.3 Key Company Financials

  10.6.5.4 SWOT Analysis

 10.6.6 Ceamsa

  10.6.6.1 Company Overview & Snapshot

  10.6.6.2 Product/Service Portfolio

  10.6.6.3 Key Company Financials

  10.6.6.4 SWOT Analysis

 10.6.7 W Hydrocolloids, Inc.

  10.6.7.1 Company Overview & Snapshot

  10.6.7.2 Product/Service Portfolio

  10.6.7.3 Key Company Financials

  10.6.7.4 SWOT Analysis

 10.6.8 Gelymar

  10.6.8.1 Company Overview & Snapshot

  10.6.8.2 Product/Service Portfolio

  10.6.8.3 Key Company Financials

  10.6.8.4 SWOT Analysis

 10.6.9 Caldic B.V.

  10.6.9.1 Company Overview & Snapshot

  10.6.9.2 Product/Service Portfolio

  10.6.9.3 Key Company Financials

  10.6.9.4 SWOT Analysis

 10.6.10 Ina Food Industry Co. Ltd.

  10.6.10.1 Company Overview & Snapshot

  10.6.10.2 Product/Service Portfolio

  10.6.10.3 Key Company Financials

  10.6.10.4 SWOT Analysis

 10.6.11 PT. Gumindo Perkasa Industries

  10.6.11.1 Company Overview & Snapshot

  10.6.11.2 Product/Service Portfolio

  10.6.11.3 Key Company Financials

  10.6.11.4 SWOT Analysis

 10.6.12 TBK Manufacturing Corporation

  10.6.12.1 Company Overview & Snapshot

  10.6.12.2 Product/Service Portfolio

  10.6.12.3 Key Company Financials

  10.6.12.4 SWOT Analysis

 10.6.13 FMC Corporation

  10.6.13.1 Company Overview & Snapshot

  10.6.13.2 Product/Service Portfolio

  10.6.13.3 Key Company Financials

  10.6.13.4 SWOT Analysis

10.6.14 Marinochem

  10.6.14.1 Company Overview & Snapshot

  10.6.14.2 Product/Service Portfolio

  10.6.14.3 Key Company Financials

  10.6.14.4 SWOT Analysis

 10.6.15 Eurogum

  10.6.15.1 Company Overview & Snapshot

  10.6.15.2 Product/Service Portfolio

  10.6.15.3 Key Company Financials

  10.6.15.4 SWOT Analysis

 10.6.16 TIC Gums

  10.6.16.1 Company Overview & Snapshot

  10.6.16.2 Product/Service Portfolio

  10.6.16.3 Key Company Financials

  10.6.16.4 SWOT Analysis

 10.6.17 Gum Technology Corporation

  10.6.17.1 Company Overview & Snapshot

  10.6.17.2 Product/Service Portfolio

  10.6.17.3 Key Company Financials

  10.6.17.4 SWOT Analysis

 10.6.18 Neogalen

  10.6.18.1 Company Overview & Snapshot

  10.6.18.2 Product/Service Portfolio

  10.6.18.3 Key Company Financials

  10.6.18.4 SWOT Analysis

 10.6.19 Hongmao

  10.6.19.1 Company Overview & Snapshot

  10.6.19.2 Product/Service Portfolio

  10.6.19.3 Key Company Financials

  10.6.19.4 SWOT Analysis

 10.6.20 Seaweed Solutions

  10.6.20.1 Company Overview & Snapshot

  10.6.20.2 Product/Service Portfolio

  10.6.20.3 Key Company Financials

  10.6.20.4 SWOT Analysis

11. Analyst Recommendations

 11.1 SNS Insider Opportunity Map

 11.2 Industry Low-Hanging Fruit Assessment

 11.3 Market Entry & Growth Strategy

 11.4 Analyst Viewpoint & Suggestions On Market Growth

12. Assumptions

13. Disclaimer

14. Appendix

 14.1 List Of Tables

 14.2 List Of Figures

Key Segments:

By Product Type

  • Kappa

  • Iota

  • Lambda

By Processing Technology

  • Alcohol Precipitation

  • Gel Press

  • Semi-refined

By Function

  • Thickening Agents

  • Gelling Agents

  • Stabilizers

  • Others

By Application

  • Food & Beverage

  • Pharmaceutical

  • Personal Care & Cosmetics

  • Others

Request for Segment Customization as per your Business Requirement: Segment Customization Request

Regional Coverage: 

North America

  • US

  • Canada

Europe

  • Germany

  • UK

  • France

  • Italy

  • Spain

  • Russia

  • Poland

  • Rest of Europe

Asia Pacific

  • China

  • India

  • Japan

  • South Korea

  • ASEAN Countries

  • Australia

  • Rest of Asia Pacific

Latin America

  • Brazil

  • Argentina

  • Mexico

  • Colombia

  • Rest of Latin America

Middle East & Africa

  • UAE

  • Saudi Arabia

  • Qatar

  • Egypt

  • South Africa

  • Rest of Middle East & Africa

Request for Country Level Research Report: Country Level Customization Request

Available Customization 

With the given market data, SNS Insider offers customization as per the company’s specific needs. The following customization options are available for the report: 

  • Detailed Volume Analysis 

  • Criss-Cross segment analysis (e.g. Product X Application) 

  • Competitive Product Benchmarking 

  • Geographic Analysis 

  • Additional countries in any of the regions 

  • Customized Data Representation 

  • Detailed analysis and profiling of additional market players

An accurate research report requires proper strategizing as well as implementation. There are multiple factors involved in the completion of good and accurate research report and selecting the best methodology to compete the research is the toughest part. Since the research reports we provide play a crucial role in any company’s decision-making process, therefore we at SNS Insider always believe that we should choose the best method which gives us results closer to reality. This allows us to reach at a stage wherein we can provide our clients best and accurate investment to output ratio.

Each report that we prepare takes a timeframe of 350-400 business hours for production. Starting from the selection of titles through a couple of in-depth brain storming session to the final QC process before uploading our titles on our website we dedicate around 350 working hours. The titles are selected based on their current market cap and the foreseen CAGR and growth.


The 5 steps process:

Step 1: Secondary Research:

Secondary Research or Desk Research is as the name suggests is a research process wherein, we collect data through the readily available information. In this process we use various paid and unpaid databases which our team has access to and gather data through the same. This includes examining of listed companies’ annual reports, Journals, SEC filling etc. Apart from this our team has access to various associations across the globe across different industries. Lastly, we have exchange relationships with various university as well as individual libraries.

Secondary Research

Step 2: Primary Research

When we talk about primary research, it is a type of study in which the researchers collect relevant data samples directly, rather than relying on previously collected data.  This type of research is focused on gaining content specific facts that can be sued to solve specific problems. Since the collected data is fresh and first hand therefore it makes the study more accurate and genuine.

We at SNS Insider have divided Primary Research into 2 parts.

Part 1 wherein we interview the KOLs of major players as well as the upcoming ones across various geographic regions. This allows us to have their view over the market scenario and acts as an important tool to come closer to the accurate market numbers. As many as 45 paid and unpaid primary interviews are taken from both the demand and supply side of the industry to make sure we land at an accurate judgement and analysis of the market.

This step involves the triangulation of data wherein our team analyses the interview transcripts, online survey responses and observation of on filed participants. The below mentioned chart should give a better understanding of the part 1 of the primary interview.

Primary Research

Part 2: In this part of primary research the data collected via secondary research and the part 1 of the primary research is validated with the interviews from individual consultants and subject matter experts.

Consultants are those set of people who have at least 12 years of experience and expertise within the industry whereas Subject Matter Experts are those with at least 15 years of experience behind their back within the same space. The data with the help of two main processes i.e., FGDs (Focused Group Discussions) and IDs (Individual Discussions). This gives us a 3rd party nonbiased primary view of the market scenario making it a more dependable one while collation of the data pointers.

Step 3: Data Bank Validation

Once all the information is collected via primary and secondary sources, we run that information for data validation. At our intelligence centre our research heads track a lot of information related to the market which includes the quarterly reports, the daily stock prices, and other relevant information. Our data bank server gets updated every fortnight and that is how the information which we collected using our primary and secondary information is revalidated in real time.

Data Bank Validation

Step 4: QA/QC Process

After all the data collection and validation our team does a final level of quality check and quality assurance to get rid of any unwanted or undesired mistakes. This might include but not limited to getting rid of the any typos, duplication of numbers or missing of any important information. The people involved in this process include technical content writers, research heads and graphics people. Once this process is completed the title gets uploader on our platform for our clients to read it.

Step 5: Final QC/QA Process:

This is the last process and comes when the client has ordered the study. In this process a final QA/QC is done before the study is emailed to the client. Since we believe in giving our clients a good experience of our research studies, therefore, to make sure that we do not lack at our end in any way humanly possible we do a final round of quality check and then dispatch the study to the client.