Technical Textile Market Key Insights:
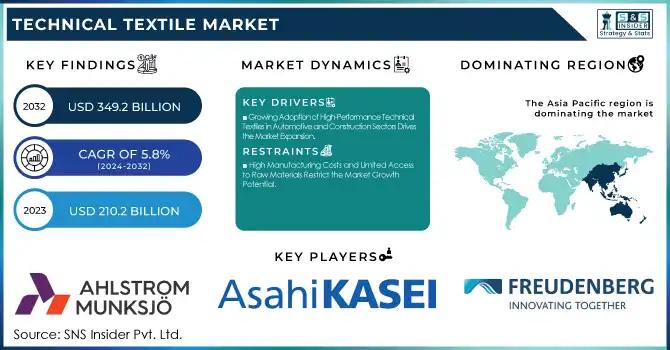
The Technical Textile Market size was valued at USD 210.2 billion in 2023 and is expected to reach USD 349.2 billion by 2032, growing at a CAGR of 5.8% over the forecast period 2024-2032.
Get More Information on Technical Textile Market - Request Sample Report
The technical textile market is experiencing significant growth, driven by increasing demand across various automotive, construction, medical, and defense industries. Innovation and sustainability are emerging as key market drivers, with companies and governments focusing on environmentally friendly and technologically advanced solutions. Recent efforts emphasize the development of high-performance textiles, including protective fabrics, medical textiles, and geotextiles. The January 2025 event in India showcased a diverse range of innovations, highlighting the importance of sustainability in the industry. Major players are adopting cutting-edge technologies to improve the efficiency and functionality of textiles. Additionally, governmental initiatives and collaborations are playing a vital role in boosting research and manufacturing capabilities. In August 2024, the government approved grants of INR 50 lakh each for four technical textile startups, showcasing a commitment to fostering innovation and entrepreneurship in this sector.
Global developments further illustrate the dynamic nature of the technical textile market. In November 2024, Tamil Nadu announced plans to establish a technical textile hub, reflecting the growing emphasis on regional specialization. Meanwhile, the US textile sector received a boost through the National Defense Authorization Act in December 2024, aimed at supporting domestic production for defense and other critical applications. Trade dynamics also reveal interesting trends; US textile and apparel imports rose by 8.7% in November 2024, while exports saw a slight decline of 3%, indicating shifting global demand. Exports from India are expected to exceed $10 billion by 2030, as noted in September 2024, underscoring the country's potential as a global leader. Companies are capitalizing on these opportunities by scaling operations and expanding their product portfolios, ensuring robust growth for the technical textile market.
Technical Textile Market Dynamics:
Drivers:
-
Growing Adoption of High-Performance Technical Textiles in Automotive and Construction Sectors Drives the Market Expansion
The increasing adoption of high-performance technical textiles in automotive and construction sectors is driving significant growth in the market. In the automotive industry, technical textiles are used in airbags, seat belts, upholstery, and soundproofing materials due to their lightweight, durability, and safety features. These materials contribute to vehicle weight reduction, enhancing fuel efficiency and performance while adhering to stringent environmental regulations. Similarly, in the construction sector, geotextiles are being increasingly utilized for soil reinforcement, erosion control, and drainage systems. These materials offer superior strength, durability, and cost efficiency, making them indispensable in modern infrastructure projects. Emerging economies, especially in Asia-Pacific, are witnessing rapid urbanization and infrastructure development, further fueling demand. For example, large-scale road construction and water management projects in countries like India and China are creating significant growth opportunities for technical textiles. Technological advancements, such as innovations in woven and nonwoven fabrics, are also enabling manufacturers to develop customized solutions for various applications, broadening the scope of these materials.
-
Rising Use of Technical Textiles in Medical Applications Boosts the Industry Growth Significantly
-
Increased Investments in Research and Development for Sustainable and Innovative Technical Textiles Support Market Growth
Restraint:
-
High Manufacturing Costs and Limited Access to Raw Materials Restrict the Market Growth Potential
The high cost of manufacturing technical textiles remains a major restraint for the market's growth. Producing advanced technical textiles often involves sophisticated machinery, skilled labor, and high energy consumption, which collectively driveup production costs. Additionally, raw material availability, particularly for synthetic fibers derived from petrochemicals, is subject to price volatility, adding to the challenge. Manufacturers in emerging economies face significant hurdles in managing these costs, as they may lack the financial resources and technological expertise to scale production efficiently. This issue is particularly pronounced in small and medium enterprises, which struggle to compete with established players. The high costs also impact end-user adoption, especially in price-sensitive markets, where affordability remains a critical factor. These challenges necessitate continuous innovation to develop cost-effective manufacturing processes and explore alternative raw materials, such as bio-based fibers, to mitigate the cost burden.
Opportunity:
-
Expanding Applications of Smart Textiles in Wearable Devices Create New Avenues for Market Growth
-
Increasing Demand for Bio-Based Technical Textiles Aligns with Rising Consumer Preference for Sustainable Products
The shift toward sustainability has opened up significant opportunities in the bio-based technical textiles market. Consumers are increasingly prioritizing environmentally friendly products, encouraging manufacturers to explore renewable raw materials. Bio-based textiles, derived from natural sources such as corn, sugarcane, and bamboo, offer a viable alternative to conventional synthetic fibers. These materials find applications in agriculture, packaging, and construction, where their biodegradability adds value to eco-conscious consumers. Leading players are investing in research and development to produce high-performance bio-based textiles that meet industry standards while addressing environmental concerns. Regulatory support for sustainable practices is further propelling this trend, providing a favorable growth environment for bio-based solutions.
Challenge:
-
Lack of Standardization and Regulatory Framework Hampers the Global Technical Textile Market Growth
The absence of uniform standards and regulations across regions poses a significant challenge to the global technical textile market. Variations in safety, performance, and quality standards create barriers to international trade, complicating market entry for manufacturers. Companies often need to comply with multiple certifications, which increases production costs and delays market launches. This lack of standardization also affects consumer trust, as inconsistent quality undermines the credibility of technical textiles. Moreover, manufacturers face difficulties in scaling innovative products globally due to the absence of a cohesive regulatory framework. Addressing this challenge requires industry-wide collaboration to establish universal standards that ensure product consistency and facilitate smoother trade.
Technical Textile Market Segments
By Fibre
In 2023, Synthetic Polymer dominated the Technical Textile Market, holding a substantial market share of 66.2%. Among its subsegments, Polyester emerged as the leading material, accounting for around 35% of the synthetic polymer segment. Synthetic polymers, particularly polyester, are favored due to their durability, versatility, and cost-effectiveness, making them the material of choice for a wide range of technical textile applications. Polyester's resistance to moisture, chemicals, and UV degradation makes it ideal for use in industrial textiles, such as geotextiles, filtration fabrics, and protective clothing. The robust demand for synthetic polymer textiles can be attributed to their ability to meet the specific performance requirements of various sectors, including automotive, medical, and agriculture. For instance, polyester is widely used in automotive applications such as seat belts, airbags, and headliners, where its strength and lightweight properties are critical. Additionally, polyester’s eco-friendly recycling potential and sustainability features are driving growth in the technical textile sector, particularly in the context of increasing environmental awareness and demand for recyclable materials.
By Type
In 2023, the Mobiltech segment dominated the Technical Textile Market with a significant market share of 19.1%. This segment’s dominance can be attributed to the growing demand for technical textiles in the automotive sector. Mobiltech includes a wide range of applications such as airbags, seat belts, and automotive upholstery, all of which require high-performance materials for safety and comfort. As global automotive production continues to increase, so does the need for advanced textiles that contribute to the durability, efficiency, and safety of vehicles. The shift toward electric vehicles (EVs) has also fueled the demand for lightweight, energy-efficient materials, boosting the adoption of technical textiles in vehicles. In addition, the automotive industry’s focus on reducing the environmental impact of manufacturing processes has driven innovation in textile production, with companies developing more sustainable materials. Mobiltech’s growth is further supported by the increasing integration of technical textiles in automotive thermal management, noise reduction, and interior decor, where these textiles offer superior performance compared to traditional materials.
By Technology
In 2023, Woven technology dominated the Technical Textile Market with a share of 57.5%. Woven textiles are characterized by their structure, where two sets of yarns or threads are interlaced at right angles to form a fabric. This technology is particularly valued for its strength, stability, and durability, making it ideal for industrial applications that require high performance and resistance to wear and tear. Woven textiles are widely used in industries such as construction, automotive, agriculture, and geotextiles. Their ability to withstand heavy loads and resist environmental factors like moisture and UV rays makes them suitable for use in geosynthetics, filtration, and reinforcing materials. For example, woven fabrics are commonly used in construction for reinforcement materials and in agriculture for weed control fabrics. Furthermore, woven textiles are increasingly being used in protective clothing, such as flame-resistant suits, and in automotive textiles like seat coverings and airbags. The continuous advancements in weaving technology, including the development of complex patterns and hybrid materials, have further driven the growth and adoption of woven textiles in the technical textile market.
By End-Use Industry
In 2023, the Automotive industry dominated the end-use sector in the Technical Textile Market, holding a market share of 22.8%. This is largely driven by the increasing use of advanced materials in the design and production of vehicles. Technical textiles play a crucial role in improving the performance, safety, and comfort of automotive components. For example, materials like airbags, seat belts, headliners, and flooring are made from technical textiles, where high strength, durability, and lightweight properties are required. As the automotive industry shifts towards electric vehicles (EVs), the demand for innovative materials has increased, further boosting the adoption of technical textiles. These textiles contribute to the lightweight design of EVs, improving their efficiency and range. Additionally, technical textiles are used in thermal management systems in vehicles, including battery and engine insulation, which is critical in electric and hybrid vehicles. The automotive sector's push for sustainability has also driven the use of recyclable and eco-friendly technical textiles, such as those made from recycled polyester, contributing to reduced environmental impact in automotive manufacturing.
Technical Textile Market Regional Analysis
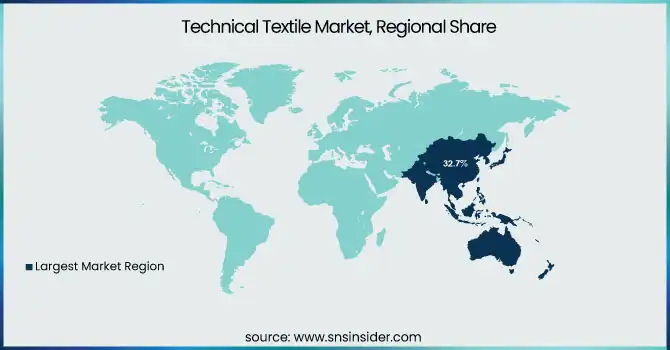
In 2023, the Asia Pacific region dominated the Technical Textile Market, holding a market share of 32.7%. The region's dominance is primarily attributed to the rapid industrialization and manufacturing capabilities of countries like China, India, and Japan, where technical textiles are extensively used across various sectors such as automotive, agriculture, construction, and medical industries. China, being the largest producer and consumer of technical textiles, accounted for a substantial portion of the region's share, driven by its massive automotive and construction sectors. The demand for technical textiles in China surged with increased investments in infrastructure, automotive manufacturing, and the growing popularity of electric vehicles (EVs), which require high-performance materials like lightweight textiles for insulation and interior components. India is another key player in the region, where the demand for technical textiles has been rising due to its burgeoning automotive industry, agricultural sector, and healthcare applications. India’s initiatives, such as the introduction of a National Technical Textiles Mission, have accelerated the growth of the market by focusing on technology development, innovation, and sustainability. Japan, with its advanced manufacturing and technology sector, also contributes significantly to the region’s dominance, particularly in specialized applications like medical textiles, protective wear, and filtration materials. The region benefits from a combination of low production costs, strong government support for the technical textiles industry, and a growing middle class, driving an increase in demand for products like protective clothing, automotive textiles, and personal protective equipment (PPE).
Get Customized Report as per Your Business Requirement - Request For Customized Report
Recent Developments
-
January 2025: Techtextil India 2025 highlighted innovations in technical textiles, focusing on eco-friendly materials and smart textiles. It brought together industry leaders to discuss advancements and sustainability in production processes, aiming to boost the Indian market.
-
September 2024: Technical textiles exports were expected to exceed $10 billion by 2030, driven by increased demand and government support. India’s focus on high-performance and sustainable materials positioned it as a major player in the global market.
-
November 2024: Tamil Nadu announced plans to create a technical textile hub to enhance its global market presence. Supported by Union Minister Giriraj Singh, the hub aims to foster innovation, create jobs, and boost the state’s textile industry.
Key Players
-
Ahlstrom-Munksjo (Ahlstrom-Munksjo Filtration Materials, Ahlstrom-Munksjo Nonwoven Fabrics)
-
Asahi Kasei Advance Corp (Bemberg Nonwoven Fabrics, Asahi Kasei Technical Textiles)
-
Berry Global Group Inc (Spunbond Nonwoven Fabrics, Medical & Hygiene Nonwovens)
-
Freudenberg Group (Freudenberg Filtration Media, Freudenberg Nonwovens)
-
Huntsman International LLC (Huntsman Nylon, Huntsman Polyester)
-
Kimberly-Clark Corp (Huggies Nonwoven, Kimberly-Clark Technical Textiles)
-
Low & Bonar PLC (Bontec Nonwoven Fabrics, Geotextiles)
-
Milliken & Company (Milliken Nonwoven Fabrics, Milliken Medical Textiles)
-
Mitsui Chemicals Inc (Mitsui Nonwoven Fabrics, Mitsui Technical Textiles)
-
Toray Industries Inc (Toray Filtration Materials, Toray Nonwoven Fabrics)
-
AdvanSix Inc (Nylon 6, AdvanSix Textile Materials)
-
BASF SE (BASF Nonwoven Fibers, BASF Functional Textiles)
-
DuPont de Nemours Inc (DuPont Tyvek, DuPont Kevlar)
-
Eastman Chemical Company (Eastman Nonwoven Fabrics, Eastman Fiber Solutions)
-
H.B. Fuller Company (H.B. Fuller Adhesive Products, H.B. Fuller Nonwoven Materials)
-
Johnspun Ltd (Johnspun Spunbond Nonwovens, Johnspun Medical Textiles)
-
Schmerber S.A.S (Schmerber Technical Fabrics, Schmerber Protective Textiles)
-
Sioen Industries NV (Sioen Coated Fabrics, Sioen Geotextiles)
-
Teijin Limited (Teijin Fibers, Teijin Nonwoven Fabrics)
-
W. Barnet GmbH & Co. KG (Barnet Nonwoven Fabrics, Barnet Fiber Textiles)
| Report Attributes | Details |
|---|---|
| Market Size in 2023 | US$ 210.2 Billion |
| Market Size by 2032 | US$ 349.2 Billion |
| CAGR | CAGR of 5.8% From 2024 to 2032 |
| Base Year | 2023 |
| Forecast Period | 2024-2032 |
| Historical Data | 2020-2022 |
| Report Scope & Coverage | Market Size, Segments Analysis, Competitive Landscape, Regional Analysis, DROC & SWOT Analysis, Forecast Outlook |
| Key Segments | •By Fibre (Natural Fibre [Cotton, Wool, Others], Synthetic Polymer [Polyethersulfone (PES), Polyamide (PA), Polyacrylonitrile (PAN), Polypropylene (PP), Polyester, Others], Others) •By Type (Mobiltech, Sportech, Buildtech, Hometech, Clothtech, Meditech, Agrotech, Others) •By Technology (Woven, Knitted, Non-Woven, Others) •By End-Use Industry (Automotive, Construction, Medical, Agriculture, Apparel, Sports, Others) |
| Regional Analysis/Coverage | North America (US, Canada, Mexico), Europe (Eastern Europe [Poland, Romania, Hungary, Turkey, Rest of Eastern Europe] Western Europe] Germany, France, UK, Italy, Spain, Netherlands, Switzerland, Austria, Rest of Western Europe]), Asia Pacific (China, India, Japan, South Korea, Vietnam, Singapore, Australia, Rest of Asia Pacific), Middle East & Africa (Middle East [UAE, Egypt, Saudi Arabia, Qatar, Rest of Middle East], Africa [Nigeria, South Africa, Rest of Africa], Latin America (Brazil, Argentina, Colombia, Rest of Latin America) |
| Company Profiles | Toray Industries Inc, Low & Bonar PLC, Kimberly-Clark Corp, Freudenberg Group, Huntsman International LLC, Ahlstrom-Munksjo, Mitsui Chemicals Inc, Berry Global Group Inc, Asahi Kasei Advance Corp, Milliken & Company and other key players |
| Key Drivers | •Rising Use of Technical Textiles in Medical Applications Boosts the Industry Growth Significantly •Increased Investments in Research and Development for Sustainable and Innovative Technical Textiles Support Market Growth |
| RESTRAINTS | •High Manufacturing Costs and Limited Access to Raw Materials Restrict the Market Growth Potential |
Frequently Asked Questions
Ans: Asia Pacific region dominated the Technical Textile Market with a 45% share, driven by rapid industrialization in China, India, and Japan, which are major consumers and producers of technical textiles across sectors like automotive, agriculture, and healthcare.
Ans: The lack of standardization and regulatory frameworks across regions hinders global technical textile market growth by increasing costs, delaying market launches, and undermining consumer trust.
Ans: The expanding use of smart textiles in wearable devices, increasing demand for bio-based textiles, and rising export potential in emerging economies are driving significant growth in the technical textile market.
Ans: The Technical Textile Market size was valued at USD 210.2 billion in 2023 and is expected to reach USD 349.2 billion by 2032
Ans: The Technical Textile Market is expected to grow at a CAGR of 5.8%
Get in Touch
