Causal AI Market Report Scope & Overview:
The Causal AI Market size was valued at USD 47.68 billion in 2024 and is projected to reach USD 736.54 billion by 2032, growing at a CAGR of 40.8% from 2025 to 2032.

To Get more information on Causal AI Market - Request Free Sample Report
The casual AI market is expanding rapidly, fueled by mounting demand for AI-driven applications in consumer services, retail, gaming, and entertainment. Such solutions improve user experience with intuitive, personalized, and interactive features, such as recommendation systems and virtual assistants. North America dominates the market with robust tech players and heavy consumer demand, whereas Europe is observing growing adoption with an emphasis on the ethical development of AI. The Middle East & Africa and Latin America are emerging regions in the market, with the UAE and Brazil leading the AI adoption due to the government-supported initiatives.
According to research, 70% of entertainment users preferred AI-driven content recommendations, while 35% of gamers used AI for adaptive storylines boosting engagement by 30% and projected to rise 50%.
The U.S causal AI market was valued at USD 12.47 billion in 2024 and is projected to reach USD 177.95 billion by 2032 with a CAGR of 39.41% during the forecast period of 2025-2032.
This massive growth is fueled by the technological backbone of the country, high demand for AI-enabled apps, and some of the top names in AI innovation. Favourable environment for AI in the U.S., relatively well-established tech ecosystem, better access to venture capital, lack of public concerns, and high consumer engagement with AI solutions in the entertainment, gaming, and retail sectors. This also increases its own monopoly in the Casual AI as the country is also investing heavily in research and development, and relevant education.
Causal AI Market Dynamics
Drivers:
-
Growing Demand for Explainable AI in Regulated Industries Drives Adoption of Causal Inference Solutions
Increasing needs for transparency and accountability across sectors including healthcare, finance, and life sciences are driving the adoption of Causal AI. Traditional machine learning models are black boxes, which are not very understandable. This is where Causal AI explains the causal relationships that allow decision-making to improve. If you are providing an AI solution in a regulated industry, it is important to highlight that the explanation of the decision rendered is essential to compliance and establishing confidence.
Restraints:
-
Effectiveness of Causal AI Implementations is Limited by Dependence on the Availability of High-quality, Unbiased Data
Intentionally designed high-caliber datasets are required for causal models so that it can effectively map fixed or dynamic cause-effect linkages. Nevertheless, inconsistent, incomplete, or biased data can lead to inaccurate deductions, which in turn can jeopardize the reliability of these models. This dependency-area is extremely difficult to fall into, especially in industries facing data silo or not sharing same data sets. And, there may be a lack of resources and expertise to develop these types of quality datasets that may prevent organizations from building Causal AI solutions.
Opportunities:
-
Integration of Causal AI into Supply Chain Systems Enhances Predictive Decision-Making and Operational Efficiency
Supply chain causal AI is the hidden potential to become more operationally efficient and more resilient. Causal Graph to model the complex interdependencies of the supply networks and make predictions about future disruptions, trade-off optimizations, and pro-active business planning. This skill is becoming very valuable in an unstable and warming world. Additionally, there has been a trend around combining Causal AI with IoT to improve real-time decision-making that further increases supply chain responsiveness and agility.
Challenges:
-
Shortage of Skilled Professionals and Complexity of Causal Modelling Hinder Widespread Adoption of Causal AI Technologies
As a result, applying causal AI solutions requires extensive knowledge of statistical modelling as well as of the domain itself, both of which are scarce in the general workforce today. The sharpness of causal models is very high, and it is the biggest obstacle for small and medium-sized enterprises that do not have the expertise and resources to develop and interpret these platforms. The combination of this talent shortage and the complexity of causal inference makes Causal AI harder to scale up and adapt to multiple sectors.
Causal AI Market Segmentation Analysis:
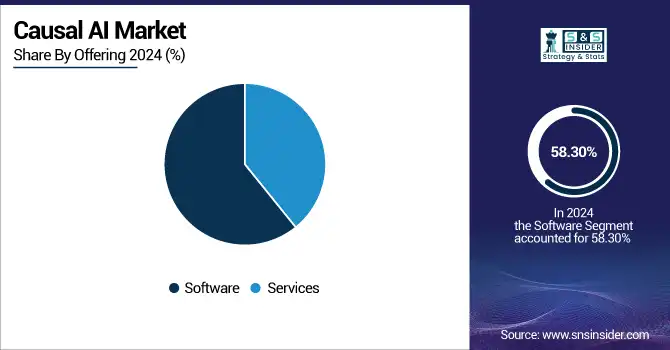
By Offering
The software segment held the largest market revenue share of 58.30% of the overall revenue within the causal AI market in 2024. The dominance is attributed to the growing demand for explainable AI platforms, which can explain cause and effect, and the decision-making process in various industries. New product enhancements including recent updates to CausaLens's AI agent platform and Google Cloud's integration with causal AI technology to power their generative AI applications are also adding to the strength of software here. These help to enable more effective decision-making using causal reasoning over large language models to reason about complex data in a way that draws more accurate conclusions.
The services segment is expected to have the fastest CAGR of 41.65% during the forecast period. The growth can be credited to the rising need for expert advice, consultation, and help in implementing causal inference tools and techniques. Services such as consulting, deployment, integration, training, support, and maintenance help organizations without internal resources or expertise. Causal AI market companies, such as IBM and Causely have facilitated and delivered these services by helping organizations in successfully identifying and analyzing causal relationships from their data. The services segment is expanding due to factors, such as high prediction accuracy, data-driven decision-making, and growing recognition of causal AI, all of which are expected to boost the causal AI market growth.
By Application
The financial management application segment accounted for Causal AI market share of over 39.34% of the revenue in 2024. Such prominence is because of causal AIs, the hidden causal factors in the financial market, to provide better investment strategies and improved risk assessment. In an unpredictable financial environment, the use of causal AI in finance leads to precise forecasting and well-informed strategic decisions.
For instance, financial organizations, such as JPMorgan Chase and Citibank, are using causal models to assess the impact of various credit risk strategies to develop more efficient loan approval processes and a lower rate of defaults.
The marketing and pricing management segment is expected to grow at the fastest CAGR value of 42.40%. The growth is attributed to the increasing adoption of causal AI by marketers to better understand customer behavior and predict campaign effectiveness, resulting in focused and efficient advertising. Causal AI enables organizations to understand the underlying reasons for customer behaviour, refine marketing strategies, and anticipate the impact of operational decisions. Causal AI lingers in marketing strategies, helping you personalize insights about your customers, delicately aligned to increasing customer engagement and satisfaction.
By Vertical
In 2024, the BFSI segment, by vertical, is expected to dominate with the largest revenue share of 25.43%. The sector's needs for transparency, risk management, and actionable intelligence explain this dominance. Causal AI helps financial institutions operate in these regulated environments by answering the why behind events, a critical element when it comes to compliance and building trust. HSBC, for instance, uses causal AI to meet anti-money laundering regulations by creating explanations of causal relationships in transaction data, reducing investigation times, and avoiding large fines.
The healthcare vertical segment will grow at the fastest CAGR of at 42.73%. The cause for this exponential growth is the rapid adoption of causal AI technology and the use of AI and machine learning in drug discovery, patient diagnosis and treatment, personalized medicine, and others. North America dominated the market owing to the presence of several key players, high adoption rate of advanced technologies in the healthcare sector, and large demand for personalized medicine in this region.
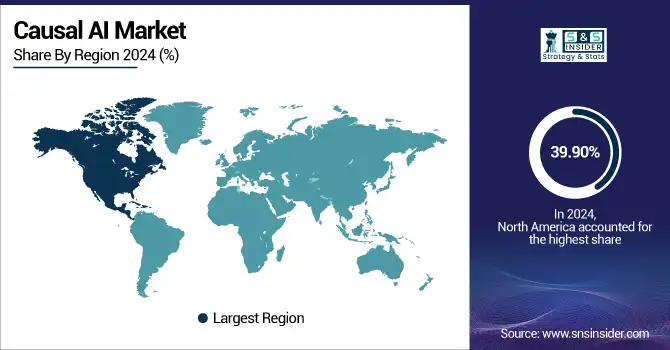
Causal AI Market Regional Outlook:
The North America region dominates the Casual AI market with 39.90% market revenue share, driven by the growth of AI technology, the presence of an established tech ecosystem, and the high consumer demand for AI-driven applications. It is a hub for major players and startups, too.
The U.S. stands out as a leader in this sector owing to its technological edge, easy access to funding, and the high exposure of various industries, such as gaming, entertainment, and retail to AI.
Europe focuses on its technological research, and an increasing concern for the ethics of AI makes Europe’s space for Casual AI. The casual AI market is witnessing a surge in demand in the U.K., Germany, and France while adopting the AI-based solution across all sectors.
The U.K. comes in firmly at the top in terms of data. It is home to a lot of tech hub activity and has a higher-than-average investment in AI, and has adopted it very quickly in areas such as entertainment, gaming, and consumer services.
The Asia Pacific has expanded rapidly with a CAGR of 41.65%, fueled by technological innovation, a large consumer base, and an upsurge in AI adoption in countries like China, Japan, and South Korea. Market dynamics boost growing demand for AI in mobile applications, gaming, and virtual assistants are driving the market.
China leads the region, applicable to significant investment in AI research and development, mature entry of AI-related applications in various sectors, and government support for technology innovation.
Middle East & Africa and Latin America are growing technology investment, smart city innovations, and causal intelligence deployment in entertainment and retail, driving the emergence. The UAE and Brazil drive markets as governments prompt growth and consumers become more active in the sector that appeals to environmentally conscious consumers.
Get Customized Report as per Your Business Requirement - Enquiry Now
Key Players:
The major players in the Causal AI Market are Amazon.com, Inc., Facebook, Inc., Google LLC, IBM Corporation, Microsoft Corporation, Oracle Corporation, SAP SE, NVIDIA Corporation, Intel Corporation, Tibco Software Inc., and others.
Key Developments:
-
May 2025: Intel appointed Sachin Katti as Chief Technology and AI Officer to lead its AI strategy and product roadmap, signaling a stronger focus on advanced AI technologies, potentially impacting the Causal AI market.
-
May 2024: Oracle launched "Grow for Business Leaders," an AI-powered upskilling solution that connects talent information across enterprises, offering leadership-driven role guides and a centralized dashboard for skill development and business success.
| Report Attributes | Details |
|---|---|
| Market Size in 2024 | USD 47.68 Billion |
| Market Size by 2032 | USD 736.54 Billion |
| CAGR | CAGR of 40.8% From 2025 to 2032 |
| Base Year | 2024 |
| Forecast Period | 2025-2032 |
| Historical Data | 2021-2023 |
| Report Scope & Coverage | Market Size, Segments Analysis, Competitive Landscape, Regional Analysis, DROC & SWOT Analysis, Forecast Outlook |
| Key Segments | • By Product (General, Support, Analytical, Clinical, Specialty) • By End-use (Research Institutions, Veterinary, Healthcare, Others) |
| Regional Analysis/Coverage | North America (US, Canada, Mexico), Europe (Germany, France, UK, Italy, Spain, Poland, Turkey, Rest of Europe), Asia Pacific (China, India, Japan, South Korea, Singapore, Australia, Rest of Asia Pacific), Middle East & Africa (UAE, Saudi Arabia, Qatar, South Africa, Rest of Middle East & Africa), Latin America (Brazil, Argentina, Rest of Latin America) |
| Company Profiles | Thermo Fisher Scientific, Agilent Technologies, Shimadzu Corporation, Bruker Corporation, PerkinElmer Inc., Beckman Coulter, Mettler Toledo, Eppendorf AG, Sartorius AG, Waters Corporation, Bio-Rad Laboratories, GE Healthcare Life Sciences, Tecan Group Ltd., Anton Paar GmbH, Hitachi High-Tech Corporation, Labconco Corporation, Oxford Instruments plc, HORIBA Scientific, Jeol Ltd., Analytik Jena AG |
Get in Touch
