image

Chelated Iron Agriculture Micronutrient Market Report Scope And Overview:

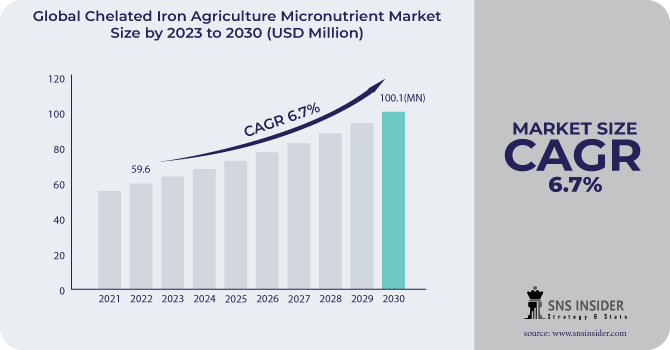
The Chelated Iron Agriculture Micronutrient Market size was USD 59.6 million in 2022 and is expected to Reach USD 100.1 million by 2030 and grow at a CAGR of 6.7% over the forecast period of 2023-2030. 

Chelated iron agriculture micronutrient is an iron-based fertilizer that is bound to a chelating agent. Chelating agents are molecules that have multiple binding sites that can attach to the iron atom. This binding makes the iron more soluble and available to plants. Chelated iron agriculture micronutrients are used to improve the yields and quality of crops.

Chelated Iron Agriculture Micronutrient Market Revenue Analysis

Based on application, the cereals are the major segment with more than 31% of the market share in 2022. Chelated iron agriculture micronutrients are used to improve the yields and quality of cereals such as wheat, rice, and corn. Iron is essential for photosynthesis and other important plant processes. The fruits & vegetables segment is predicted to grow at a CAGR of 7.9%. Chelated iron agriculture micronutrients can help to improve the color and quality of fruits and vegetables, as well as their nutritional value.

MARKET DYNAMICS

KEY DRIVERS

  • Advancements in chelating agents

Precision agriculture and other sustainable farming approaches are assisting farmers in using chelated iron micronutrients more efficiently and effectively. New chelating agents that are more effective and environmentally friendly than existing chelating agents are being developed. Plants absorb amino acid chelates more readily than standard chelating chemicals such as EDTA. Additionally, amino acid chelates are more biodegradable, reducing the environmental impact of chelated iron micronutrients.  

  • Growing demand for high-quality agricultural products

RESTRAIN

  • Lack of awareness of chelated iron micronutrients

Many farmers are unaware of the benefits of chelated iron micronutrients over traditional fertilizers, such as higher bioavailability and efficiency in overcoming iron deficiency. Additionally, some farmers may be hesitant to utilize chelated iron micronutrients since they are more expensive than regular fertilizers. Furthermore, chelated iron micronutrients are frequently offered to a particular clientele, such as organic farmers or farmers that adopt sustainable farming methods. This can make it difficult for farmers to access chelated iron micronutrients.

OPPORTUNITY

  • Government support for sustainable agriculture

Governments all across the world are supporting sustainable agriculture practices because they understand the benefits. Chelated iron micronutrients play a significant role in sustainable agriculture. The Indian government recently implemented a Nutrient Subsidy Scheme to encourage the use of balanced fertilizers, which include chelated iron micronutrients. In addition, the US Department of Agriculture maintains a number of initiatives that promote sustainable agriculture, such as the Environmental Quality Incentives Program. Farmers who employ conservation methods, such as using chelated iron micronutrients to promote soil health, are eligible for EQIP financial aid.

CHALLENGES

  • High cost of chelated iron micronutrients

The manufacturing of chelated iron micronutrients is complex and more expensive than the manufacturing of traditional fertilizers. Furthermore, the chelating chemicals required to attach the iron to the chelate molecule are costly. The high cost of chelated iron micronutrients is a major impediment to the chelated iron agriculture micronutrient market's expansion.

IMPACT OF RUSSIA UKRAINE WAR

The reduced supply of chelated iron micronutrients has led to increased prices. According to research by the International Fertilizer Industry Association (IFA), since the start of the war, the cost of chelated iron micronutrients has risen by 25%. In 2023, the war is projected to diminish the world's supply of chelated iron micronutrients by 15%. Ukraine's agricultural productivity is severely hampered by the war. This is due to the fact that farmers have been unable to get fertilizer and other inputs or plant crops. As a result, crop yields in Ukraine are anticipated to be lower this year. Micronutrients containing chelated iron can also lessen the demand for synthetic fertilizers.

IMPACT OF ONGOING RECESSION

Recessions can have a significant impact on the chelated iron agriculture micronutrient market, as farmers may reduce their spending on agricultural inputs during a recession. According to the International Fertilizer Industry Association (IFA), a 1% drop in world GDP can result in a 0.5% drop in global fertilizer consumption. The market for chelated iron agriculture micronutrients in fruits and vegetables may be more resilient to a recession than the market for chelated iron agriculture micronutrients in grains.

MARKET SEGMENTATION

by Application

  • Cereals

  • Fruits & vegetables

  • Pulses & Oilseeds

  • Others

REGIONAL ANALYSIS

North America is the largest market for chelated iron agriculture micronutrients accounting for 47% market share in the forecast period. the United States is expected to grow at a CAGR of 6.9% in 2022. The growth is attributed to the rising demand for improved agricultural practices in this region. North American farmers are increasingly using chelated iron micronutrients to improve the yields and quality of their crops.

Europe had a significant market for chelated iron agriculture micronutrients in the forecast period. This is due to the advancements in chelating agents and sustainable farming practices. European farmers are also increasingly farming activities to comply with environmental regulations. Germany is being driven by the increasing demand for food and agricultural products, as well as the growing awareness about the benefits of using chelated iron micronutrients among farmers.

Asia-Pacific is the fastest-growing region in the global chelated iron agriculture micronutrient market. The China region is expected to grow at a CAGR of 7.2% in 2022. Growing agriculture and the dominance of small-scale manufacturers may be seen throughout the Asia-Pacific region. Furthermore, the region's enormous agricultural area and government initiatives to promote the agriculture sector have driven market expansion.

REGIONAL COVERAGE

North America

  • US

  • Canada

  • Mexico

Europe

  • Eastern Europe

    • Poland

    • Romania

    • Hungary

    • Turkey

    • Rest of Eastern Europe

  • Western Europe

    • Germany

    • France

    • UK

    • Italy

    • Spain

    • Netherlands

    • Switzerland

    • Austria

    • Rest of Western Europe

Asia Pacific

  • China

  • India

  • Japan

  • South Korea

  • Vietnam

  • Singapore

  • Australia

  • Rest of Asia Pacific

Middle East & Africa

  • Middle East

    • UAE

    • Egypt

    • Saudi Arabia

    • Qatar

    • Rest of Middle East

  • Africa

    • Nigeria

    • South Africa

    • Rest of Africa

Latin America

  • Brazil

  • Argentina

  • Colombia

  • Rest of Latin America

KEY PLAYERS

Some major key players in the Chelated Iron Agriculture Micronutrient Market are ADAMA Agricultural Solutions Ltd., Bayer CropScience AG, BASF SE, Land O’Lakes Inc. Monsanto Co., Sumitomo Chemical Co., Ltd, The Dow Chemical Co., Yara International ASA, Nufarm Limited, The Mosaic Company, Syngenta International AG, Agrium Inc., Akzo Nobel N.V., and other key players.

Bayer CropScience AG-Company Financial Analysis

RECENT DEVELOPMENTS

In 2022, ICL announced the launch of a new line of innovative foliar and fertigation solutions under its Nova brand of water-soluble fertilizers in North America. Nova FINISHTM, Nova PULSETM, Nova ELEVATETM, and Nova FLOWTM are the company's flagship products.

Chelated Iron Agriculture Micronutrient Market Report Scope:

Report Attributes Details
Market Size in 2022  US$ 59.6 Million
Market Size by 2030  US$ 100.1 Million
CAGR   CAGR of 6.7 % From 2023 to 2030
Base Year 2022
Forecast Period  2023-2030
Historical Data  2019-2021
Report Scope & Coverage Market Size, Segments Analysis, Competitive  Landscape, Regional Analysis, DROC & SWOT Analysis, Forecast Outlook
Key Segments • By Application (Cereals, Fruits & vegetables, Pulses & Oilseeds, and Others)
Regional Analysis/Coverage North America (US, Canada, Mexico), Europe (Eastern Europe [Poland, Romania, Hungary, Turkey, Rest of Eastern Europe] Western Europe] Germany, France, UK, Italy, Spain, Netherlands, Switzerland, Austria, Rest of Western Europe]), Asia Pacific (China, India, Japan, South Korea, Vietnam, Singapore, Australia, Rest of Asia Pacific), Middle East & Africa (Middle East [UAE, Egypt, Saudi Arabia, Qatar, Rest of Middle East], Africa [Nigeria, South Africa, Rest of Africa], Latin America (Brazil, Argentina, Colombia Rest of Latin America)
Company Profiles ADAMA Agricultural Solutions Ltd., Bayer CropScience AG, BASF SE, Land O’Lakes Inc. Monsanto Co., Sumitomo Chemical Co., Ltd, The Dow Chemical Co., Yara International ASA, Nufarm Limited, The Mosaic Company, Syngenta International AG, Agrium Inc., Akzo Nobel N.V.
Key Drivers • Advancements in chelating agents
• Growing demand for high-quality agricultural products
Market Opportunity • Government support for sustainable agriculture 


Frequently Asked Questions

Ans: Chelated Iron Agriculture Micronutrient Market is anticipated to expand by 6.7% from 2023 to 2030.

Ans: USD 100.1 million is expected to grow by 2030.

Ans: Advancements in chelating agents and the growing demand for high-quality agricultural products are the drivers of the Chelated Iron Agriculture Micronutrient Market.

Ans: The high cost of chelated iron micronutrients is the challenge of the Chelated Iron Agriculture Micronutrient Market.

Ans: The North American region dominate the Chelated Iron Agriculture Micronutrient Market in 2022.

TABLE OF CONTENT

1. Introduction
1.1 Market Definition
1.2 Scope
1.3 Research Assumptions

2. Research Methodology

3. Market Dynamics
3.1 Drivers
3.2 Restraints
3.3 Opportunities
3.4 Challenges

4. Impact Analysis
4.1 Impact of the Russia-Ukraine War
4.2 Impact of Ongoing Recession
4.2.1 Introduction
4.2.2 Impact on Major Economies
4.2.2.1 US
4.2.2.2 Canada
4.2.2.3 Germany
4.2.2.4 France
4.2.2.5 United Kingdom
4.2.2.6 China
4.2.2.7 Japan
4.2.2.8 South Korea
4.2.2.9 Rest of the World

5. Value Chain Analysis

6. Porter’s 5 forces model

7. PEST Analysis

8. Chelated Iron Agriculture Micronutrient Market Segmentation, By Application
8.1 Cereals
8.2 Fruits & vegetables
8.3 Pulses & Oilseeds
8.4 Others

9. Regional Analysis
9.1 Introduction
9.2 North America
9.2.1 North America Chelated Iron Agriculture Micronutrient Market by Country
9.2.2 North America Chelated Iron Agriculture Micronutrient Market by Application
9.2.3 USA
9.2.3.1 USA Chelated Iron Agriculture Micronutrient Market by Application
9.2.4 Canada
9.2.4.1 Canada Chelated Iron Agriculture Micronutrient Market by Application
9.2.5 Mexico
9.2.5.1 Mexico Chelated Iron Agriculture Micronutrient Market by Application
9.3 Europe
9.3.1 Eastern Europe
9.3.1.1 Eastern Europe Chelated Iron Agriculture Micronutrient Market by Country
9.3.1.2 Eastern Europe Chelated Iron Agriculture Micronutrient Market by Application
9.3.1.3 Poland
9.3.1.4.1 Poland Chelated Iron Agriculture Micronutrient Market by Application
9.3.1.4 Romania
9.3.1.4.1 Romania Chelated Iron Agriculture Micronutrient Market by Application
9.3.1.5 Hungary
9.3.1.5.1 Hungary Chelated Iron Agriculture Micronutrient Market by Application
9.3.1.6 Turkey
9.3.1.6.1 Turkey Chelated Iron Agriculture Micronutrient Market by Application
9.3.1.7 Rest of Eastern Europe
9.3.1.7.1 Rest of Eastern Europe Chelated Iron Agriculture Micronutrient Market by Application
9.3.2 Western Europe
9.3.2.1 Western Europe Chelated Iron Agriculture Micronutrient Market by Country
9.3.2.2 Western Europe Chelated Iron Agriculture Micronutrient Market by Application
9.3.2.3 Germany
9.3.2.3.1 Germany Chelated Iron Agriculture Micronutrient Market by Application
9.3.2.4 France
9.3.2.4.1 France Chelated Iron Agriculture Micronutrient Market by Application
9.3.2.5 UK
9.3.2.5.1 UK Chelated Iron Agriculture Micronutrient Market by Application
9.3.2.6 Italy
9.3.2.6.1 Italy Chelated Iron Agriculture Micronutrient Market by Application
9.3.2.7 Spain
9.3.2.7.1 Spain Chelated Iron Agriculture Micronutrient Market by Application
9.3.2.8 Netherlands
9.3.2.8.1 Netherlands Chelated Iron Agriculture Micronutrient Market by Application
9.3.2.9 Switzerland
9.3.2.9.1 Switzerland Chelated Iron Agriculture Micronutrient Market by Application
9.3.2.10 Austria
9.3.2.10.1 Austria Chelated Iron Agriculture Micronutrient Market by Application
9.3.2.11 Rest of Western Europe
9.3.2.11.1 Rest of Western Europe Chelated Iron Agriculture Micronutrient Market by Application
9.4 Asia-Pacific
9.4.1 Asia Pacific Chelated Iron Agriculture Micronutrient Market by Country
9.4.2 Asia Pacific Chelated Iron Agriculture Micronutrient Market by Application
9.4.3 China
9.4.3.1 China Chelated Iron Agriculture Micronutrient Market by Application
9.4.4 India
9.4.4.1 India Chelated Iron Agriculture Micronutrient Market by Application
9.4.5 Japan
9.4.5.1 Japan Chelated Iron Agriculture Micronutrient Market by Application
9.4.6 South Korea
9.4.6.1 South Korea Chelated Iron Agriculture Micronutrient Market by Application
9.4.7 Vietnam
9.4.7.1 Vietnam Chelated Iron Agriculture Micronutrient Market by Application
9.4.8 Singapore
9.4.8.1 Singapore Chelated Iron Agriculture Micronutrient Market by Application
9.4.9 Australia
9.4.9.1 Australia Chelated Iron Agriculture Micronutrient Market by Application
9.4.10 Rest of Asia-Pacific
9.4.10.1 Rest of Asia-Pacific Chelated Iron Agriculture Micronutrient Market by Application
9.5 Middle East & Africa
9.5.1 Middle East
9.5.1.1 Middle East Chelated Iron Agriculture Micronutrient Market by Country
9.5.1.2 Middle East Chelated Iron Agriculture Micronutrient Market by Application
9.5.1.3 UAE
9.5.1.3.1 UAE Chelated Iron Agriculture Micronutrient Market by Application
9.5.1.4 Egypt
9.5.1.4.1 Egypt Chelated Iron Agriculture Micronutrient Market by Application
9.5.1.5 Saudi Arabia
9.5.1.5.1 Saudi Arabia Chelated Iron Agriculture Micronutrient Market by Application
9.5.1.6 Qatar
9.5.1.6.1 Qatar Chelated Iron Agriculture Micronutrient Market by Application
9.5.1.7 Rest of Middle East
9.5.1.7.1 Rest of Middle East Chelated Iron Agriculture Micronutrient Market by Application
9.5.2 Africa
9.5.2.1 Africa Chelated Iron Agriculture Micronutrient Market by Country
9.5.2.2 Africa Chelated Iron Agriculture Micronutrient Market by Application
9.5.2.3 Nigeria
9.5.2.3.1 Nigeria Chelated Iron Agriculture Micronutrient Market by Application
9.5.2.4 South Africa
9.5.2.4.1 South Africa Chelated Iron Agriculture Micronutrient Market by Application
9.5.2.5 Rest of Africa
9.5.2.5.1 Rest of Africa Chelated Iron Agriculture Micronutrient Market by Application
9.6 Latin America
9.6.1 Latin America Chelated Iron Agriculture Micronutrient Market by Country
9.6.2 Latin America Chelated Iron Agriculture Micronutrient Market by Application
9.6.3 Brazil
9.6.3.1 Brazil Chelated Iron Agriculture Micronutrient Market by Application
9.6.4 Argentina
9.6.4.1 Argentina Chelated Iron Agriculture Micronutrient Market by Application
9.6.5 Colombia
9.6.5.1 Colombia Chelated Iron Agriculture Micronutrient Market by Application
9.6.6 Rest of Latin America
9.6.6.1 Rest of Latin America Chelated Iron Agriculture Micronutrient Market by Application

10. Company Profile
10.1 ADAMA Agricultural Solutions Ltd.
10.1.1 Company Overview
10.1.2 Financials
10.1.3 Product/Services Offered
10.1.4 SWOT Analysis
10.1.5 The SNS View
10.2 Bayer CropScience AG
10.2.1 Company Overview
10.2.2 Financials
10.2.3 Product/Services Offered
10.2.4 SWOT Analysis
10.2.5 The SNS View
10.3 BASF SE
10.3.1 Company Overview
10.3.2 Financials
10.3.3 Product/Services Offered
10.3.4 SWOT Analysis
10.3.5 The SNS View
10.4 Land O’Lakes Inc. Monsanto Co.
10.4 Company Overview
10.4.2 Financials
10.4.3 Product/Services Offered
10.4.4 SWOT Analysis
10.4.5 The SNS View
10.5 Sumitomo Chemical Co., Ltd
10.5.1 Company Overview
10.5.2 Financials
10.5.3 Product/Services Offered
10.5.4 SWOT Analysis
10.5.5 The SNS View
10.6 The Dow Chemical Co.
10.6.1 Company Overview
10.6.2 Financials
10.6.3 Product/Services Offered
10.6.4 SWOT Analysis
10.6.5 The SNS View
10.7 Yara International ASA
10.7.1 Company Overview
10.7.2 Financials
10.7.3 Product/Services Offered
10.7.4 SWOT Analysis
10.7.5 The SNS View
10.8 Nufarm Limited
10.8.1 Company Overview
10.8.2 Financials
10.8.3 Product/Services Offered
10.8.4 SWOT Analysis
10.8.5 The SNS View
10.9 The Mosaic Company
10.9.1 Company Overview
10.9.2 Financials
10.9.3 Product/Services Offered
10.9.4 SWOT Analysis
10.9.5 The SNS View
10.10 Syngenta International AG
10.10.1 Company Overview
10.10.2 Financials
10.10.3 Product/Services Offered
10.10.4 SWOT Analysis
10.10.5 The SNS View
10.11 Agrium Inc.
10.11.1 Company Overview
10.11.2 Financials
10.11.3 Product/Services Offered
10.11.4 SWOT Analysis
10.11.5 The SNS View
10.12 Akzo Nobel N.V.
10.12.1 Company Overview
10.12.2 Financials
10.12.3 Product/Services Offered
10.12.4 SWOT Analysis
10.12.5 The SNS View

11. Competitive Landscape
11.1 Competitive Benchmarking
11.2 Market Share Analysis
11.3 Recent Developments
11.3.1 Industry News
11.3.2 Company News
11.3.3 Mergers & Acquisitions

12. USE Cases and Best Practices

13. Conclusion

An accurate research report requires proper strategizing as well as implementation. There are multiple factors involved in the completion of good and accurate research report and selecting the best methodology to compete the research is the toughest part. Since the research reports we provide play a crucial role in any company’s decision-making process, therefore we at SNS Insider always believe that we should choose the best method which gives us results closer to reality. This allows us to reach at a stage wherein we can provide our clients best and accurate investment to output ratio.

Each report that we prepare takes a timeframe of 350-400 business hours for production. Starting from the selection of titles through a couple of in-depth brain storming session to the final QC process before uploading our titles on our website we dedicate around 350 working hours. The titles are selected based on their current market cap and the foreseen CAGR and growth.


The 5 steps process:

Step 1: Secondary Research:

Secondary Research or Desk Research is as the name suggests is a research process wherein, we collect data through the readily available information. In this process we use various paid and unpaid databases which our team has access to and gather data through the same. This includes examining of listed companies’ annual reports, Journals, SEC filling etc. Apart from this our team has access to various associations across the globe across different industries. Lastly, we have exchange relationships with various university as well as individual libraries.

Secondary Research

Step 2: Primary Research

When we talk about primary research, it is a type of study in which the researchers collect relevant data samples directly, rather than relying on previously collected data.  This type of research is focused on gaining content specific facts that can be sued to solve specific problems. Since the collected data is fresh and first hand therefore it makes the study more accurate and genuine.

We at SNS Insider have divided Primary Research into 2 parts.

Part 1 wherein we interview the KOLs of major players as well as the upcoming ones across various geographic regions. This allows us to have their view over the market scenario and acts as an important tool to come closer to the accurate market numbers. As many as 45 paid and unpaid primary interviews are taken from both the demand and supply side of the industry to make sure we land at an accurate judgement and analysis of the market.

This step involves the triangulation of data wherein our team analyses the interview transcripts, online survey responses and observation of on filed participants. The below mentioned chart should give a better understanding of the part 1 of the primary interview.

Primary Research

Part 2: In this part of primary research the data collected via secondary research and the part 1 of the primary research is validated with the interviews from individual consultants and subject matter experts.

Consultants are those set of people who have at least 12 years of experience and expertise within the industry whereas Subject Matter Experts are those with at least 15 years of experience behind their back within the same space. The data with the help of two main processes i.e., FGDs (Focused Group Discussions) and IDs (Individual Discussions). This gives us a 3rd party nonbiased primary view of the market scenario making it a more dependable one while collation of the data pointers.

Step 3: Data Bank Validation

Once all the information is collected via primary and secondary sources, we run that information for data validation. At our intelligence centre our research heads track a lot of information related to the market which includes the quarterly reports, the daily stock prices, and other relevant information. Our data bank server gets updated every fortnight and that is how the information which we collected using our primary and secondary information is revalidated in real time.

Data Bank Validation

Step 4: QA/QC Process

After all the data collection and validation our team does a final level of quality check and quality assurance to get rid of any unwanted or undesired mistakes. This might include but not limited to getting rid of the any typos, duplication of numbers or missing of any important information. The people involved in this process include technical content writers, research heads and graphics people. Once this process is completed the title gets uploader on our platform for our clients to read it.

Step 5: Final QC/QA Process:

This is the last process and comes when the client has ordered the study. In this process a final QA/QC is done before the study is emailed to the client. Since we believe in giving our clients a good experience of our research studies, therefore, to make sure that we do not lack at our end in any way humanly possible we do a final round of quality check and then dispatch the study to the client.

Start a Conversation

Hi! Click one of our member below to chat on Phone