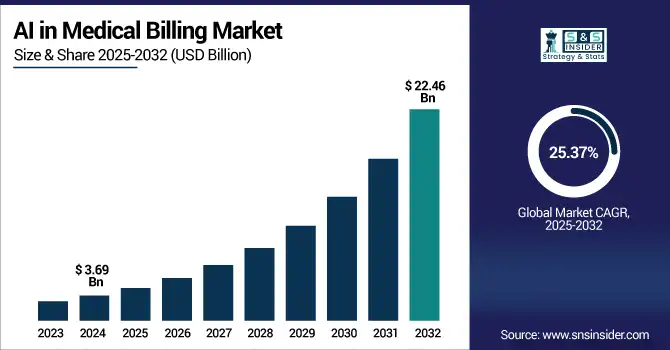
The AI in the Medical Billing Market size was valued at USD 3.69 billion in 2024 and is expected to reach USD 22.46 billion by 2032, expanding at a CAGR of 25.37% over the forecast period of 2025-2032.
The AI in Medical Billing Market is highly competitive as all healthcare providers are implementing the latest technology for their efficient operations and to mitigate errors in billing. AI automates processes such as processing of claims, coding, eligibility verification, and payment posting, resulting in improved productivity and reduced revenue leakage. Cloud deployment dominates the market, as it is scalable, allows remote access, and can be integrated with EHR systems. These are solutions to which both big hospitals and small practices with limited budgets can all get behind. Surge in telehealth and the need for data-backed decisions are among other factors to fuel the uptake of cloud. As demands increase for regulation, the role of AI to better comply and ease administration lays the ground for further market expansion.
According to research, more than 70% of small to mid-sized practices used cloud-based AI billing whereby healthcare facilities are enabled to reduce their administrative costs by 30% and automate 60% of complicated billing codes.
The U.S AI in the Medical Billing Market size reached USD billion in 2024 and is expected to reach USD 7.41 billion in 2032 at a CAGR of 24.46% from 2025 to 2032.
Robust healthcare infrastructure, rapid adoption of AI-based technologies, and stringent regulatory requirements to perform correct billing practices are some of the factors that dominate the market in the U.S. quarter. As the pressure to lower administrative costs, avoid billing errors, and operate more efficiently grows, providers have flocked to AI-powered solutions. Deployment on the cloud is becoming popular due to its scalability and ease of integration with EHRs.
Additionally, increasing telehealth adoption and an emphasis on revenue cycle optimization are expected to drive the continued growth of artificial intelligence in medical billing in the U.S.
Drivers:
Increasing Adoption of AI-Powered Automation Tools Enhances Efficiency and Accuracy in Healthcare Revenue Cycle Management.
Incorporating AI-Powered Automation Tools for a report in healthcare revenue cycle management helps bring unparalleled levels of operational efficiency and accuracy. Automation helps healthcare providers reduce manual errors, accelerate reimbursement processes, and improve productivity by automating tasks like claim processing, coding, and billing. Examples of recent advancements include AI systems that can not only assess payer trends but also recommend optimum billing methods to ensure prompt payment and minimize claim denials. These advancements enable better administrative workflows, cost savings, and patient satisfaction. With the rapid increase in the need for optimal functioning of healthcare operations, the demand for AI-based automation tools is predicted to surge even further.
Restraints:
Rising Concerns Over Data Security and Patient Privacy Pose Challenges to AI Integration in Healthcare Billing Systems
While the efficiency gain from utilizing AI in healthcare billing systems is worthy of praise, it brings with it a lot of concerns related to data security and patient privacy. AI systems rely on patient information, which is quite sensitive, hence the target of many cyberattacks and data breaches. However, patient data protection compliance with regard to HIPAA and other regulations becomes a must. The risks associated with AI adoption are considerable, and healthcare providers must strive for exemplary standards of security and data integrity if these risks are to be mitigated. Such challenges require constant monitoring and enhancement of the cybersecurity infrastructure to protect patient data.
Opportunities:
Emerging AI Technologies Offer Opportunities to Enhance Revenue Optimization and Reduce Claim Denials in Healthcare Billing.
advancements in AI technologies provide opportunities to improve revenue optimization and reduce claim denials for healthcare billing. AI systems can analyze payer behaviors, determine which billing methods may work best, and ensure that claims are compliant with the correct requirements. With its ability to minimize errors like undercoding and ensure accurate claims, AI helps in maximizing reimbursements. Dynamic billing adjustments and real-time feedback mechanisms help enable more efficient revenue cycle management. As providers seek to enhance financial performance, demand for robust AI-driven billing optimization solutions is rising, shifting from reactive to proactive billing strategies.
Challenges:
High Implementation Costs and Integration Complexities Hinder the Adoption of AI Solutions in Healthcare Billing Processes.
AI solutions for healthcare billing processes are not used due to the high implementation costs and difficulty in integration. You build AI systems at scale by investing heavily in infrastructure, software, and people. It is also difficult to incorporate AI into current workflows, requiring drastic adjustments to traditional workflows. Healthcare providers may experience complications when it comes to training staff and managing the integration of AI tools into existing systems and workflows. Although it can save a lot of time and effort in making the bills and being accurate, these barriers can be a major reason that organizations do not come to terms with the AI technologies.
By Deployment Mode
In 2024 cloud-based segment will account for the maximum revenue share of 66.08% due to the growing demand for scalable, affordable, and accessible solutions. Additionally, telehealth services are on the rise, and cloud deployment allows for integration with EHRs while also supporting remote access. The top billing platforms, such as Athenahealth and Kareo, have created cloud-based platforms, embedded with AI, to improve coding accuracy and reduce claim denials. Increased demand due to the changing AI in medical billing market trends around real-time data access, improved collaboration, and regulatory compliance.
The on-premises segment is expected to grow at the fastest CAGR of 26.08% during the forecast period, as many large healthcare institutions prefer on-premises software due to rising demand for data control and better security. This model provides you with direct infrastructure control, which is crucial to address stringent regulations when handling patient data. Existing on-premise AI tools are being enhanced by companies, including AdvancedMD and eClinicalWorks, to assist in claims processing and billing analytics. Demand for bespoke solutions and cyber dangers exacerbate the growth. The on-premise AI deployments are increasingly becoming a part of the AI in healthcare ecosystem as demand for data sensitivity, in addition to infrastructure autonomy, grows.
By Application
The revenue cycle management segment led the market with a 49.37% share in 2024, due to the increasing importance of financial stability in healthcare. Key RCM tasks like patient registration, eligibility verification, claim coding, and denial management are enhanced through the use of AI. Both Change Healthcare and R1 RCM have introduced solutions that use AI to automate billing workflows and enhance collections. Adoption has been driven by the greater emphasis on lowering manual interventions and speeding up payment cycles.
The fraud detection segment is projected to grow at the highest growth rate of 30.85% as there are stricter regulations and a growing number of fraudulent claims. They can identify patterns and anomalies that signal billing fraud, upcoding, or duplicate claims, using AI algorithms. Optum and SAS are examples of companies that have implemented AI-based fraud analytics platforms that improve billing transparency and risk management. With healthcare organizations trying to shield their financial assets and bolster compliance, the investment in fraud detection capabilities is ramping up. As the need for fraud prevention to protect payer and provider interests increases, this segment is likely to witness significant AI in medical billing market growth.
By End-User
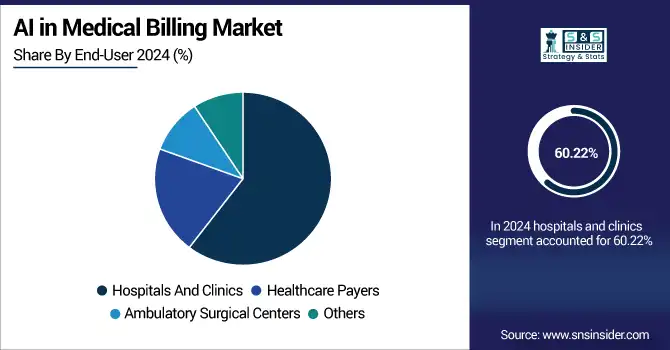
In 2024, hospitals and clinics held the largest AI in medical billing market share, at 60.22%, owing to high patient volumes and substantial administrative burden. And, it is AI that makes it possible for these institutions to automate the tasks, which take a lot of time in processing and complexity when it comes to billing, and makes a difference in terms of accuracy and other. Epic Systems and Cerner have added features for clinical and financial workflows in the hospital environment through integrated automated billing tools via AI. Hospitals will continue to maintain their position as the biggest contributor to the AI in medical billing industry as they increasingly use AI to manage claim submissions, denial tracking compliance.
Healthcare payers are expected to record the fastest growth rate of 26.84% over the forecast period, which is attributed to the rising trend of insurers striving to invest in AI for effective claims adjudication and fraud prevention. It also enables payers to detect billing errors, verify claim legitimacy, and streamline reimbursement systems aided by intelligent automation. Humana, UnitedHealth Group, and others are starting to use artificial intelligence to improve their operations and save money, as well. Driven by the shift to value-based care and predictive analytics, healthcare payers are increasingly influencing AI-driven medical billing innovations to enhance financial outcomes and improve patient satisfaction.
According to research, healthcare providers report a 50% reduction in billing cycle time after integrating AI for eligibility verification and payment posting.
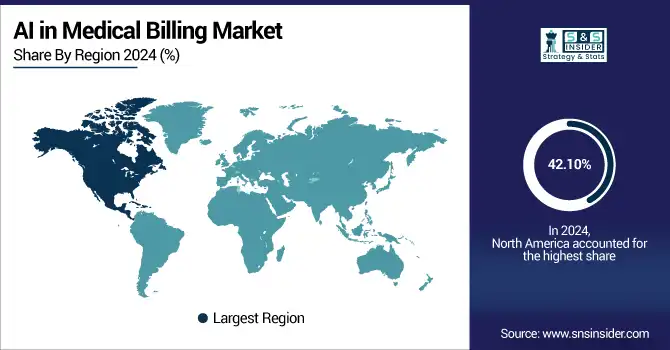
North America accounts for the largest revenue share of 42.10%, attributed to healthy healthcare infrastructure, early integration of AI technologies, and established stringent regulations. Greater investments in healthcare IT and the increased demand for revenue cycle management efficiency through automation and AI-focused solutions benefit the region.
This region is led by the U.S. with strong healthcare spending, high AI penetration, and an amateur digital health market facilitating the automation and optimization of medical billing.
Europe's AI in Medical Billing Market expansion is driven by growing digitization in the healthcare sector, government policies in favor of AI adoption, and the imperative to decrease administrative expenses. The region is also helped by growing telehealth services and stringent data privacy laws that compel secure AI billing systems.
Germany is the leading country in Europe, aided by a robust healthcare infrastructure, heavy investments in IT infrastructure, and aggressive adoption of AI technologies in medical billing and revenue management.
The Asia Pacific market is growing at a CAGR of 27.30% with growing healthcare infrastructure, rising expenditure on healthcare, and rising demand for streamlined billing solutions. The shifting adoption of cloud technologies and initiatives by governments to go digital in the healthcare sector is the driver.
China leads this market, driven by its high population base, mounting investments in healthcare, and the fast-paced adoption of AI and cloud-based billing systems in hospitals and clinics.
Development in the Middle East, Africa, and Latin America is powered by modernization in healthcare, growing digital adoption, and government support, with the UAE and Brazil in the lead due to sophisticated infrastructure and growing AI-based medical billing deployments.
The major key players of the AI in Medical Billing Market are Waystar, NextGen Healthcare, Inc., McKesson Corporation, Epic Systems Corporation, Athenahealth, Inc., eClinicalWorks LLC, GE Healthcare, Optum, Inc., RapidClaims.Ai, Nym Health, and others.
In April 2024, McKesson's Ontada collaborated with Microsoft to utilize Azure AI and OpenAI capabilities, processing more than 150 million oncology documents to improve clinical data extraction and insights.
In May 2025, Optum introduced Optum Integrity One, an artificial intelligence-enabled revenue cycle platform intended to eliminate administrative inefficiencies and improve clinical documentation and coding accuracy. A recent pilot program showed a 20% boost in coding productivity.
Report Attributes | Details |
---|---|
Market Size in 2024 | USD 3.69 Billion |
Market Size by 2032 | USD 22.46 Billion |
CAGR | CAGR of 25.37% From 2025 to 2032 |
Base Year | 2024 |
Forecast Period | 2025-2032 |
Historical Data | 2021-2023 |
Report Scope & Coverage | Market Size, Segments Analysis, Competitive Landscape, Regional Analysis, DROC & SWOT Analysis, Forecast Outlook |
Key Segments | •By Deployment Mode (Cloud-Based, On-Premise) •By Application (Automated Billing and Documentation, Revenue Cycle Management, Claims Processing, Denial Management, Fraud Detection, Others) •By End-User (Hospitals and Clinics, Healthcare Payers, Ambulatory Surgical Centers, Others) |
Regional Analysis/Coverage | North America (US, Canada, Mexico), Europe (Germany, France, UK, Italy, Spain, Poland, Turkey, Rest of Europe), Asia Pacific (China, India, Japan, South Korea, Singapore, Australia, Rest of Asia Pacific), Middle East & Africa (UAE, Saudi Arabia, Qatar, South Africa, Rest of Middle East & Africa), Latin America (Brazil, Argentina, Rest of Latin America) |
Company Profiles | Waystar, NextGen Healthcare, Inc., McKesson Corporation, Epic Systems Corporation, Athenahealth, Inc., eClinicalWorks LLC, GE Healthcare, Optum, Inc., RapidClaims.Ai, Nym Health |
Ans: The market is projected to expand at a CAGR of 25.37% over the forecast period of 2025 to 2032.
Ans: The AI in Medical Billing Market was valued at USD 4.61 billion in 2024.
Ans: The major growth factor is the increasing adoption of AI-powered automation tools that enhance operational efficiency and billing accuracy across healthcare revenue cycle processes.
Ans: The Revenue Cycle Management segment dominated the market in 2024 with a 49.37% share. Its dominance is attributed to the growing need for financial stability in healthcare and the automation of key billing tasks like patient registration and claim coding.
Ans: North America dominated the market in 2024, accounting for the largest revenue share of 42.10%. This was due to strong healthcare infrastructure, early AI adoption, and stringent regulatory frameworks.
Table of Contents
1. Introduction
1.1 Market Definition
1.2 Scope (Inclusion and Exclusions)
1.3 Research Assumptions
2. Executive Summary
2.1 Market Overview
2.2 Regional Synopsis
2.3 Competitive Summary
3. Research Methodology
3.1 Top-Down Approach
3.2 Bottom-up Approach
3.3. Data Validation
3.4 Primary Interviews
4. Market Dynamics Impact Analysis
4.1 Market Driving Factors Analysis
4.1.1 Drivers
4.1.2 Restraints
4.1.3 Opportunities
4.1.4 Challenges
4.2 PESTLE Analysis
4.3 Porter’s Five Forces Model
5. Statistical Insights and Trends Reporting
5.1 Cost Savings & Efficiency Metrics
5.2 Accuracy & Error Rate Improvements
5.3 Customer Satisfaction and ROI
5.4 Payment Recovery Rate
6. Competitive Landscape
6.1 List of Major Companies, By Region
6.2 Market Share Analysis, By Region
6.3 Product Benchmarking
6.3.1 Product specifications and features
6.3.2 Pricing
6.4 Strategic Initiatives
6.4.1 Marketing and promotional activities
6.4.2 Distribution and Supply Chain Strategies
6.4.3 Expansion plans and new Product launches
6.4.4 Strategic partnerships and collaborations
6.5 Technological Advancements
6.6 Market Positioning and Branding
7. AI in Medical Billing Market Segmentation By Deployment Mode
7.1 Chapter Overview
7.2 Cloud-Based
7.2.1 Cloud-Based Market Trends Analysis (2021-2032)
7.2.2 Cloud-Based Market Size Estimates and Forecasts to 2032 (USD Billion)
7.3 On-Premise
7.3.1 On-Premise Market Trends Analysis (2021-2032)
7.3.2 On-Premise Market Size Estimates and Forecasts to 2032 (USD Billion)
8. AI in Medical Billing Market Segmentation By End-User
8.1 Chapter Overview
8.2 Hospitals And Clinics
8.2.1 Hospitals And Clinics Market Trend Analysis (2021-2032)
8.2.2 Hospitals And Clinics Market Size Estimates and Forecasts to 2032 (USD Billion)
8.3 Healthcare Payers
8.3.1 Healthcare Payers Market Trends Analysis (2021-2032)
8.3.2 Healthcare Payers Market Size Estimates and Forecasts to 2032 (USD Billion)
8.4 Ambulatory Surgical Centers
8.4.1 Ambulatory Surgical Centers Market Trends Analysis (2021-2032)
8.4.2 Ambulatory Surgical Centers Market Size Estimates and Forecasts to 2032 (USD Billion)
8.5 Others
8.5.1 Others Market Trends Analysis (2021-2032)
8.5.2 Others Market Size Estimates and Forecasts to 2032 (USD Billion)
9. AI in Medical Billing Market Segmentation By Application
9.1 Chapter Overview
9.2 Automated Billing and Documentation
9.2.1 Automated Billing and Documentation Market Trends Analysis (2021-2032)
9.2.2 Automated Billing and Documentation Market Size Estimates and Forecasts to 2032 (USD Billion)
9.3 Revenue Cycle Management
9.3.1 Revenue Cycle Management Market Trends Analysis (2021-2032)
9.3.2 Revenue Cycle Management Market Size Estimates and Forecasts to 2032 (USD Billion)
9.4 Claims Processing
9.4.1 Claims Processing Market Trends Analysis (2021-2032)
9.4.2 Claims Processing Market Size Estimates and Forecasts to 2032 (USD Billion)
9.5 Denial Management
9.5.1 Denial Management Market Trends Analysis (2021-2032)
9.5.2 Denial Management Market Size Estimates and Forecasts to 2032 (USD Billion)
9.6 Fraud Detection
9.6.1 Fraud Detection Market Trends Analysis (2021-2032)
9.6.2 Fraud Detection Market Size Estimates and Forecasts to 2032 (USD Billion)
9.7 Others
9.7.1 Others Market Trends Analysis (2021-2032)
9.7.2 Others Market Size Estimates and Forecasts to 2032 (USD Billion)
10. Regional Analysis
10.1 Chapter Overview
10.2 North America
10.2.1 Trends Analysis
10.2.2 North America AI in Medical Billing Market Estimates and Forecasts, by Country (2021-2032) (USD Billion)
10.2.3 North America AI in Medical Billing Market Estimates and Forecasts, By Deployment Mode (2021-2032) (USD Billion)
10.2.4 North America AI in Medical Billing Market Estimates and Forecasts, By End-User (2021-2032) (USD Billion)
10.2.5 North America AI in Medical Billing Market Estimates and Forecasts, By Application (2021-2032) (USD Billion)
10.2.6 USA
10.2.6.1 USA AI in Medical Billing Market Estimates and Forecasts, By Deployment Mode (2021-2032) (USD Billion)
10.2.6.2 USA AI in Medical Billing Market Estimates and Forecasts, By End-User (2021-2032) (USD Billion)
10.2.6.3 USA AI in Medical Billing Market Estimates and Forecasts, By Application (2021-2032) (USD Billion)
10.2.7 Canada
10.2.7.1 Canada AI in Medical Billing Market Estimates and Forecasts, By Deployment Mode (2021-2032) (USD Billion)
10.2.7.2 Canada AI in Medical Billing Market Estimates and Forecasts, By End-User (2021-2032) (USD Billion)
10.2.7.3 Canada AI in Medical Billing Market Estimates and Forecasts, By Application (2021-2032) (USD Billion)
10.2.8 Mexico
10.2.8.1 Mexico AI in Medical Billing Market Estimates and Forecasts, By Deployment Mode (2021-2032) (USD Billion)
10.2.8.2 Mexico AI in Medical Billing Market Estimates and Forecasts, By End-User (2021-2032) (USD Billion)
10.2.8.3 Mexico AI in Medical Billing Market Estimates and Forecasts, By Application (2021-2032) (USD Billion)
10.3 Europe
10.3.1 Trends Analysis
10.3.2 Europe AI in Medical Billing Market Estimates and Forecasts, by Country (2021-2032) (USD Billion)
10.3.3 Europe AI in Medical Billing Market Estimates and Forecasts, By Deployment Mode (2021-2032) (USD Billion)
10.3.4 Europe AI in Medical Billing Market Estimates and Forecasts, By End-User (2021-2032) (USD Billion)
10.3.5 Europe AI in Medical Billing Market Estimates and Forecasts, By Application(2021-2032) (USD Billion)
10.3.6 Germany
10.3.1.6.1 Germany AI in Medical Billing Market Estimates and Forecasts, By Deployment Mode (2021-2032) (USD Billion)
10.3.1.6.2 Germany AI in Medical Billing Market Estimates and Forecasts, By End-User (2021-2032) (USD Billion)
10.3.1.6.3 Germany AI in Medical Billing Market Estimates and Forecasts, By Application (2021-2032) (USD Billion)
10.3.7 France
10.3.7.1 France AI in Medical Billing Market Estimates and Forecasts, By Deployment Mode (2021-2032) (USD Billion)
10.3.7.2 France a AI in Medical Billing Market Estimates and Forecasts, By End-User (2021-2032) (USD Billion)
10.3.7.3 France AI in Medical Billing Market Estimates and Forecasts, By Application (2021-2032) (USD Billion)
10.3.8 UK
10.3.8.1 UK AI in Medical Billing Market Estimates and Forecasts, By Deployment Mode (2021-2032) (USD Billion)
10.3.8.2 UK AI in Medical Billing Market Estimates and Forecasts, By End-User (2021-2032) (USD Billion)
10.3.8.3 UK AI in Medical Billing Market Estimates and Forecasts, By Application (2021-2032) (USD Billion)
10.3.9 Italy
10.3.9.1 Italy AI in Medical Billing Market Estimates and Forecasts, By Deployment Mode (2021-2032) (USD Billion)
10.3.9.2 Italy AI in Medical Billing Market Estimates and Forecasts, By End-User (2021-2032) (USD Billion)
10.3.9.3 Italy AI in Medical Billing Market Estimates and Forecasts, By Application (2021-2032) (USD Billion)
10.3.10 Spain
10.3.10.1 Spain AI in Medical Billing Market Estimates and Forecasts, By Deployment Mode (2021-2032) (USD Billion)
10.3.10.2 Spain AI in Medical Billing Market Estimates and Forecasts, By End-User (2021-2032) (USD Billion)
10.3.10.3 Spain AI in Medical Billing Market Estimates and Forecasts, By Application (2021-2032) (USD Billion)
10.3.12 Poland
10.3.12.1 Poland AI in Medical Billing Market Estimates and Forecasts, by Country (2021-2032) (USD Billion)
10.3.12.1 Poland AI in Medical Billing Market Estimates and Forecasts, By Deployment Mode (2021-2032) (USD Billion)
10.3.12.3 Poland AI in Medical Billing Market Estimates and Forecasts, By End-User (2021-2032) (USD Billion)
10.3.12.3 Poland AI in Medical Billing Market Estimates and Forecasts, By Application (2021-2032) (USD Billion)
10.3.13 Turkey
10.3.13.1 Turkey AI in Medical Billing Market Estimates and Forecasts, By Deployment Mode (2021-2032) (USD Billion)
10.3.13.2 Turkey AI in Medical Billing Market Estimates and Forecasts, By End-User (2021-2032) (USD Billion)
10.3.13.3 Turkey AI in Medical Billing Market Estimates and Forecasts, By Application (2021-2032) (USD Billion)
10.3.14 Rest of Europe
10.3.14.1 Rest of Europe AI in Medical Billing Market Estimates and Forecasts, By Deployment Mode (2021-2032) (USD Billion)
10.3.14.2 Rest of Europe AI in Medical Billing Market Estimates and Forecasts, By End-User (2021-2032) (USD Billion)
10.3.14.3 Rest of Europe AI in Medical Billing Market Estimates and Forecasts, By Application(2021-2032) (USD Billion)
10.4 Asia-Pacific
10.4.1 Trends Analysis
10.4.2 Asia-Pacific AI in Medical Billing Market Estimates and Forecasts, by Country (2021-2032) (USD Billion)
10.4.3 Asia-Pacific AI in Medical Billing Market Estimates and Forecasts, By Deployment Mode (2021-2032) (USD Billion)
10.4.4 Asia-Pacific AI in Medical Billing Market Estimates and Forecasts, By End-User (2021-2032) (USD Billion)
10.4.5 Asia-Pacific AI in Medical Billing Market Estimates and Forecasts, By Application (2021-2032) (USD Billion)
10.4.6 China
10.4.6.1 China AI in Medical Billing Market Estimates and Forecasts, By Deployment Mode (2021-2032) (USD Billion)
10.4.6.2 China AI in Medical Billing Market Estimates and Forecasts, By End-User (2021-2032) (USD Billion)
10.4.6.3 China AI in Medical Billing Market Estimates and Forecasts, By Application (2021-2032) (USD Billion)
10.4.7 India
10.4.7.1 India AI in Medical Billing Market Estimates and Forecasts, By Deployment Mode (2021-2032) (USD Billion)
10.4.7.2 India AI in Medical Billing Market Estimates and Forecasts, By End-User (2021-2032) (USD Billion)
10.4.7.3 India AI in Medical Billing Market Estimates and Forecasts, By Application (2021-2032) (USD Billion)
10.4.8 Japan
10.4.8.1 Japan AI in Medical Billing Market Estimates and Forecasts, By Deployment Mode (2021-2032) (USD Billion)
10.4.8.2 Japan AI in Medical Billing Market Estimates and Forecasts, By End-User (2021-2032) (USD Billion)
10.4.8.3 Japan AI in Medical Billing Market Estimates and Forecasts, By Application (2021-2032) (USD Billion)
10.4.9 South Korea
10.4.9.1 South Korea AI in Medical Billing Market Estimates and Forecasts, By Deployment Mode (2021-2032) (USD Billion)
10.4.9.2 South Korea AI in Medical Billing Market Estimates and Forecasts, By End-User (2021-2032) (USD Billion)
10.4.9.3 South Korea AI in Medical Billing Market Estimates and Forecasts, By Application (2021-2032) (USD Billion)
10.4.10 Singapore
10.4.10.1 Singapore AI in Medical Billing Market Estimates and Forecasts, By Deployment Mode (2021-2032) (USD Billion)
10.4.10.2 Singapore AI in Medical Billing Market Estimates and Forecasts, By End-User (2021-2032) (USD Billion)
10.4.10.3 Singapore AI in Medical Billing Market Estimates and Forecasts, By Application (2021-2032) (USD Billion)
10.4.11 Australia
10.4.11.1 Australia AI in Medical Billing Market Estimates and Forecasts, By Deployment Mode (2021-2032) (USD Billion)
10.4.11.2 Australia AI in Medical Billing Market Estimates and Forecasts, By End-User (2021-2032) (USD Billion)
10.4.11.3 Australia AI in Medical Billing Market Estimates and Forecasts, By Application (2021-2032) (USD Billion)
10.4.12 Rest of Asia-Pacific
10.4.12.1 Rest of Asia-Pacific AI in Medical Billing Market Estimates and Forecasts, By Deployment Mode (2021-2032) (USD Billion)
10.4.12.2 Rest of Asia-Pacific AI in Medical Billing Market Estimates and Forecasts, By End-User (2021-2032) (USD Billion)
10.4.12.3 Rest of Asia-Pacific AI in Medical Billing Market Estimates and Forecasts, By Application (2021-2032) (USD Billion)
10.5 Middle East and Africa
10.5.1 Trends Analysis
10.5.2 Middle East and Africa East AI in Medical Billing Market Estimates and Forecasts, by Country (2021-2032) (USD Billion)
10.5.3Middle East and Africa AI in Medical Billing Market Estimates and Forecasts, By Deployment Mode (2021-2032) (USD Billion)
10.5.4 Middle East and Africa AI in Medical Billing Market Estimates and Forecasts, By End-User (2021-2032) (USD Billion)
10.5.5 Middle East and Africa AI in Medical Billing Market Estimates and Forecasts, By Application (2021-2032) (USD Billion)
10.5.6 UAE
10.5.6.1 UAE AI in Medical Billing Market Estimates and Forecasts, By Deployment Mode (2021-2032) (USD Billion)
10.5.6.2 UAE AI in Medical Billing Market Estimates and Forecasts, By End-User (2021-2032) (USD Billion)
10.5.6.3 UAE AI in Medical Billing Market Estimates and Forecasts, By Application (2021-2032) (USD Billion)
10.5.7 Saudi Arabia
10.5.7.1 Saudi Arabia AI in Medical Billing Market Estimates and Forecasts, By Deployment Mode (2021-2032) (USD Billion)
10.5.7.2 Saudi Arabia AI in Medical Billing Market Estimates and Forecasts, By End-User (2021-2032) (USD Billion)
10.5.7.3 Saudi Arabia AI in Medical Billing Market Estimates and Forecasts, By Application (2021-2032) (USD Billion)
10.5.8 Qatar
10.5.8.1 Qatar AI in Medical Billing Market Estimates and Forecasts, By Deployment Mode (2021-2032) (USD Billion)
10.5.8.2 Qatar AI in Medical Billing Market Estimates and Forecasts, By End-User (2021-2032) (USD Billion)
10.5.8.3 Qatar AI in Medical Billing Market Estimates and Forecasts, By Application (2021-2032) (USD Billion)
10.5.9 South Africa
10.5.9 1 South Africa AI in Medical Billing Market Estimates and Forecasts, By Deployment Mode (2021-2032) (USD Billion)
10.5.9 2 South Africa AI in Medical Billing Market Estimates and Forecasts By End-User (2021-2032) (USD Billion)
10.5.9 3 South Africa AI in Medical Billing Market Estimates and Forecasts, By Application (2021-2032) (USD Billion)
10.5.10 Rest of Middle East & Africa
10.5.10.1 Rest of Middle East & Africa AI in Medical Billing Market Estimates and Forecasts, By Deployment Mode (2021-2032) (USD Billion)
10.5.10.2 Rest of Middle East & Africa AI in Medical Billing Market Estimates and Forecasts, By End-User (2021-2032) (USD Billion)
10.5.10.3 Rest of Middle East & Africa AI in Medical Billing Market Estimates and Forecasts, By Application (2021-2032) (USD Billion)
10.6 Latin America
10.6.1 Trends Analysis
10.6.2 Latin America AI in Medical Billing Market Estimates and Forecasts, by Country (2021-2032) (USD Billion)
10.6.3 Latin America AI in Medical Billing Market Estimates and Forecasts, By Deployment Mode (2021-2032) (USD Billion)
10.6.4 Latin America AI in Medical Billing Market Estimates and Forecasts, By End-User (2021-2032) (USD Billion)
10.6.5 Latin America AI in Medical Billing Market Estimates and Forecasts, By Application (2021-2032) (USD Billion)
10.6.6 Brazil
10.6.6.1 Brazil AI in Medical Billing Market Estimates and Forecasts, By Deployment Mode (2021-2032) (USD Billion)
10.6.6.2 Brazil AI in Medical Billing Market Estimates and Forecasts, By End-User (2021-2032) (USD Billion)
10.6.6.3 Brazil AI in Medical Billing Market Estimates and Forecasts, By Application (2021-2032) (USD Billion)
10.6.7 Argentina
10.6.7.1 Argentina AI in Medical Billing Market Estimates and Forecasts, By Deployment Mode (2021-2032) (USD Billion)
10.6.7.2 Argentina AI in Medical Billing Market Estimates and Forecasts, By End-User (2021-2032) (USD Billion)
10.6.7.3 Argentina AI in Medical Billing Market Estimates and Forecasts, By Application (2021-2032) (USD Billion)
10.6.8 Rest of Latin America
10.6.8.1 Rest of Latin America AI in Medical Billing Market Estimates and Forecasts, By Deployment Mode (2021-2032) (USD Billion)
10.6.8.2 Rest of Latin America AI in Medical Billing Market Estimates and Forecasts, By End-User (2021-2032) (USD Billion)
10.6.8.3 Rest of Latin America AI in Medical Billing Market Estimates and Forecasts, By Application (2021-2032) (USD Billion)
12. Company Profiles
12.1 Waystar
12.1.1 Company Overview
12.1.2 Financial
12.1.3 Products/ Services Offered
12.1.4 SWOT Analysis
12.2 NextGen Healthcare, Inc.
12.2.1 Company Overview
12.2.2 Financial
12.2.3 Products/ Services Offered
12.2.4 SWOT Analysis
12.3 McKesson Corporation
12.3.1 Company Overview
12.3.2 Financial
12.3.3 Products/ Services Offered
12.3.4 SWOT Analysis
12.4 Epic Systems Corporation
12.4.1 Company Overview
12.4.2 Financial
12.4.3 Products/ Services Offered
12.4.4 SWOT Analysis
12.5 Athenahealth, Inc.
12.5.1 Company Overview
12.5.2 Financial
12.5.3 Products/ Services Offered
12.5.4 SWOT Analysis
12.6 eClinicalWorks LLC
12.6.1 Company Overview
12.6.2 Financial
12.6.3 Products/ Services Offered
12.6.4 SWOT Analysis
12.7 GE Healthcare
12.7.1 Company Overview
12.7.2 Financial
12.7.3 Products/ Services Offered
12.7.4 SWOT Analysis
12.8 Optum, Inc.
12.8.1 Company Overview
12.8.2 Financial
12.8.3 Products/ Services Offered
12.8.4 SWOT Analysis
12.9 RapidClaims.Ai
12.9.1 Company Overview
12.9.2 Financial
12.9.3 Products/ Services Offered
12.9.4 SWOT Analysis
12.10 Nym Health
12.10.1 Company Overview
12.10.2 Financial
12.10.3 Products/ Services Offered
12.10.4 SWOT Analysi
12. Use Cases and Best Practices
13. Conclusion
An accurate research report requires proper strategizing as well as implementation. There are multiple factors involved in the completion of good and accurate research report and selecting the best methodology to compete the research is the toughest part. Since the research reports we provide play a crucial role in any company’s decision-making process, therefore we at SNS Insider always believe that we should choose the best method which gives us results closer to reality. This allows us to reach at a stage wherein we can provide our clients best and accurate investment to output ratio.
Each report that we prepare takes a timeframe of 350-400 business hours for production. Starting from the selection of titles through a couple of in-depth brain storming session to the final QC process before uploading our titles on our website we dedicate around 350 working hours. The titles are selected based on their current market cap and the foreseen CAGR and growth.
The 5 steps process:
Step 1: Secondary Research:
Secondary Research or Desk Research is as the name suggests is a research process wherein, we collect data through the readily available information. In this process we use various paid and unpaid databases which our team has access to and gather data through the same. This includes examining of listed companies’ annual reports, Journals, SEC filling etc. Apart from this our team has access to various associations across the globe across different industries. Lastly, we have exchange relationships with various university as well as individual libraries.
Step 2: Primary Research
When we talk about primary research, it is a type of study in which the researchers collect relevant data samples directly, rather than relying on previously collected data. This type of research is focused on gaining content specific facts that can be sued to solve specific problems. Since the collected data is fresh and first hand therefore it makes the study more accurate and genuine.
We at SNS Insider have divided Primary Research into 2 parts.
Part 1 wherein we interview the KOLs of major players as well as the upcoming ones across various geographic regions. This allows us to have their view over the market scenario and acts as an important tool to come closer to the accurate market numbers. As many as 45 paid and unpaid primary interviews are taken from both the demand and supply side of the industry to make sure we land at an accurate judgement and analysis of the market.
This step involves the triangulation of data wherein our team analyses the interview transcripts, online survey responses and observation of on filed participants. The below mentioned chart should give a better understanding of the part 1 of the primary interview.
Part 2: In this part of primary research the data collected via secondary research and the part 1 of the primary research is validated with the interviews from individual consultants and subject matter experts.
Consultants are those set of people who have at least 12 years of experience and expertise within the industry whereas Subject Matter Experts are those with at least 15 years of experience behind their back within the same space. The data with the help of two main processes i.e., FGDs (Focused Group Discussions) and IDs (Individual Discussions). This gives us a 3rd party nonbiased primary view of the market scenario making it a more dependable one while collation of the data pointers.
Step 3: Data Bank Validation
Once all the information is collected via primary and secondary sources, we run that information for data validation. At our intelligence centre our research heads track a lot of information related to the market which includes the quarterly reports, the daily stock prices, and other relevant information. Our data bank server gets updated every fortnight and that is how the information which we collected using our primary and secondary information is revalidated in real time.
Step 4: QA/QC Process
After all the data collection and validation our team does a final level of quality check and quality assurance to get rid of any unwanted or undesired mistakes. This might include but not limited to getting rid of the any typos, duplication of numbers or missing of any important information. The people involved in this process include technical content writers, research heads and graphics people. Once this process is completed the title gets uploader on our platform for our clients to read it.
Step 5: Final QC/QA Process:
This is the last process and comes when the client has ordered the study. In this process a final QA/QC is done before the study is emailed to the client. Since we believe in giving our clients a good experience of our research studies, therefore, to make sure that we do not lack at our end in any way humanly possible we do a final round of quality check and then dispatch the study to the client.
Key Segments:
By Deployment Mode
Cloud-Based
On-Premise
By Application
Automated Billing and Documentation
Revenue Cycle Management
Claims Processing
Denial Management
Fraud Detection
Others
By End-User
Hospitals And Clinics
Healthcare Payers
Ambulatory Surgical Centers
Others
Request for Segment Customization as per your Business Requirement: Segment Customization Request
Regional Coverage:
North America
US
Canada
Mexico
Europe
Germany
France
UK
Italy
Spain
Poland
Turkey
Rest of Europe
Asia Pacific
China
India
Japan
South Korea
Singapore
Australia
Rest of Asia Pacific
Middle East & Africa
UAE
Saudi Arabia
Qatar
South Africa
Rest of Middle East & Africa
Latin America
Brazil
Argentina
Rest of Latin America
Request for Country Level Research Report: Country Level Customization Request
Available Customization
With the given market data, SNS Insider offers customization as per the company’s specific needs. The following customization options are available for the report:
Detailed Volume Analysis
Criss-Cross segment analysis (e.g. Product X Application)
Competitive Product Benchmarking
Geographic Analysis
Additional countries in any of the regions
Customized Data Representation
Detailed analysis and profiling of additional market players