Middle East Capability Centers Market Report Scope & Overview:
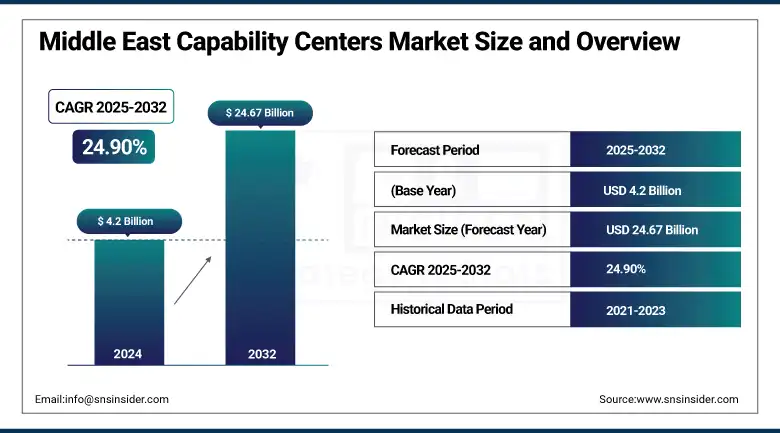
Middle East Capability Centers Market was valued at USD 4.2 billion in 2024 and is expected to reach USD 24.67 billion by 2032, growing at a CAGR of 24.90% from 2025-2032.
The Middle East Capability Centers Market is witnessing strong growth due to rising digital transformation initiatives across sectors, supported by government strategies such as Saudi Vision 2030 and UAE's digital economy policies. Multinational corporations are increasingly establishing centers for innovation, analytics, cybersecurity, and AI in the region, drawn by its strategic location, competitive talent costs, and improving digital infrastructure.
Abu Dhabi, in particular, is advancing rapidly with a USD 3.54 billion digital strategy aimed at becoming the world’s first “AI-native government” by 2027. This initiative includes the deployment of over 200 AI-driven services, the creation of a USD 1 billion AI skills fund, and the development of a sovereign cloud infrastructure capable of managing 11 million daily interactions.
Meanwhile, Saudi Arabia is aggressively scaling its AI infrastructure through Humain, a state-backed firm launched in May 2025. Humain has secured 18,000 Nvidia Blackwell GPUs, USD 10 billion in funding from AMD, a USD 5 billion AWS AI Zone, and a USD 20 billion data center development partnership with Supermicro and DataVolt, solidifying its position as a key enabler of Saudi’s AI ambitions.
To Get more information On Middle East Capability Centers Market - Request Free Sample Report
Additionally, increased public-private partnerships, tech-friendly regulatory frameworks, and the regional push to diversify economies beyond oil are driving demand for specialized capability hubs. The growing need for shared services, data-driven decision-making, and advanced IT solutions is further fueling market expansion.
In line with these trends, Saudi Arabia’s Digital Government Authority (DGA) has issued interim licenses to five private firms Tabadul, NHC, Masdr, Tamkeen, and Tatweer—to operate digital government platforms, reinforcing its goal to “strengthen public–private partnerships and accelerate digital economy growth.”
Market Dynamics
Drivers
-
Rising digital transformation and government incentives are accelerating the demand for Middle East Capability Centers across diverse industries.
Rising digital transformation in finance, healthcare, and logistics is driving strong demand for advanced operational hubs in the Middle East. Governments are encouraging this growth through tax incentives, infrastructure development, and regulatory support to attract foreign direct investment in technology and shared services. These efforts foster a favorable business environment for Capability Centers. Additionally, national digital strategies and smart city projects, particularly in the UAE and Saudi Arabia, are strengthening the ecosystem needed for rapid Capability Center growth and regional expansion.
Saudi Arabia has introduced four new Special Economic Zones (SEZs)—including a Cloud Computing SEZ offering incentives such as 5% corporate tax for 20 years, 0% VAT, and customs relief, all designed to boost high-tech and digital investments.
Meanwhile, the UAE Cabinet-approved National Investment Strategy 2031 aims to more than double FDI inflows from AED 112 billion (2023) to AED 240 billion by 2031, with a strong focus on logistics, finance, IT, and healthcare all prime verticals for Capability Center expansion.
-
Cost efficiency and access to multilingual talent pools are encouraging companies to establish Capability Centers across the Middle East.
Cost arbitrage from lower operational expenses and a growing multilingual, skilled workforce is attracting global companies to establish Capability Centers in the Middle East. Cities like Dubai, Riyadh, and Manama provide competitive real estate, business-friendly regulations, and access to professionals fluent in Arabic, English, and South Asian languages. This diverse talent pool boosts global service coverage. Moreover, the region’s strategic location enables efficient service delivery across European and Asian time zones, making it ideal for 24/7 support operations.
DIFC (Dubai) offers 50-year zero‑tax corporate guarantees, 100% foreign ownership, and English-common-law regulation, attracting over 3,000 international firms as of 2023.
In 2024, the UAE workforce grew by 12%, with a 13% rise in skilled workers and a 21% increase in women’s participation, showcasing a deepening and diverse talent pool well-suited for global service delivery and support hubs.
Restraints
-
Geopolitical instability and regulatory unpredictability are deterring long-term investments in Middle East Capability Centers.
Geopolitical tensions and regional unrest create uncertainty for Capability Center investments in the Middle East. Fluctuating diplomatic relations, inconsistent law enforcement, and shifting policies raise operational risks and hesitation among companies. Regulatory unpredictability especially regarding foreign ownership, taxation, and labor laws adds complexity for foreign firms. These challenges hinder long-term planning and resource allocation. Consequently, the region’s perceived risk is higher, making it less attractive compared to other emerging delivery hubs in Asia and Eastern Europe.
Middle Eastern stock markets dropped sharply on June 12, 2025, amid escalating geopolitical tensions following stalled U.S.–Iran nuclear talks and the redeployment of U.S. personnel.
In parallel, Bahrain (Oct 2024) and UAE (Cabinet Decision No. 35 of 2025) revised ownership and tax regulations, introducing major policy shifts. Bahrain now allows foreign companies to operate without local partners, depending on sector and size, while the UAE redefined taxable presence for non-resident investors in QIFs/REITs, replacing outdated norms—demonstrating the ongoing regulatory fluidity that businesses must navigate.
Opportunities
-
Vision 2030 strategies and economic diversification goals are opening large-scale investment opportunities for Capability Centers in the Middle East.
Vision 2030 programs in Saudi Arabia and the UAE focus on economic diversification and expanding non-oil sectors, creating significant opportunities for Capability Centers. These initiatives prioritize digital economy growth, AI adoption, and service excellence, supporting specialized hubs in finance, HR, IT, and innovation. Governments encourage global partnerships to boost knowledge transfer and local talent development. Capability Centers benefit from co-investment opportunities, simplified licensing, and rising demand from emerging industries nurtured by these comprehensive, long-term national development strategies.
In the first half of 2025, 184 regional headquarters relocated to Saudi Arabia, with investment licenses increasing by 50% since the launch of Vision 2030.
In November 2024, Citigroup secured a license to open its regional HQ, joining a growing list of global firms. This surge is driven by Saudi Arabia’s “Programme HQ” policy, which mandates a local HQ presence for access to government contracts further encouraging international companies to establish Capability Centers in the region.
Saudi Arabia – Vision 2030
-
Transform the Public Investment Fund (PIF) into a global investment leader to reduce oil dependency.
-
Implement 13 Vision Realization Programs including National Transformation, Financial Sector Development, and Human Capital.
-
Accelerate National Transformation Program (NTP) to enhance digital infrastructure and public service KPIs.
-
Develop giga-projects like NEOM, Red Sea Project, Qiddiya, and New Murabba to boost tourism and non-oil GDP.
-
Promote GCC economic integration and lead regional green initiatives.
UAE Vision 2031
-
Lead global sustainability efforts with a target of 30% clean energy (solar & nuclear) by 2030.
-
Host the International Renewable Energy Agency (IRENA) Middle East headquarters.
-
Invest in modern infrastructure: water systems, hospitals, schools, airports, and smart seaports.
-
Advance digital transformation through mGovernment, eGovernment services, and unified citizen CRM platforms.
-
Ensure accessible healthcare with preventive screenings and expanded medical facilities.
-
Align national development with UN Sustainable Development Goals (SDGs).
-
Promote innovation and R&D via Abu Dhabi’s Advanced Technology Research Council (ATRC).
-
Surge in cross-border e-commerce and fintech innovations is creating demand for agile Capability Centers in the Middle East.
Rapid growth in digital commerce, mobile payments, and fintech startups is driving firms to establish agile, customer-centric Capability Centers in the Middle East. These centers handle regulatory compliance, user experience, fraud detection, and multilingual support. The region’s young, tech-savvy population fuels digital consumption, boosting demand for scalable backend operations. Cross-border e-commerce requires localized customer service and payment systems, encouraging further investment. Capability Centers are positioned to become key enablers for regional startups and global companies tapping into the vibrant digital economy.
Real-time payment transaction volume in the UAE soared from AED 2.4 million in 2019 to AED 64.1 million in 2023, with transaction value rising from AED 6 billion to AED 164.7 billion.
Visa reports that 70% of UAE merchants experienced increased footfall and revenue after accepting digital payments, while 88% of consumers used alternative payment methods in the past year.
Additionally, the UAE fintech sector received 92% more investment in 2023, with digital asset AUM reaching USD453 million and 329 fintech firms operating across the country in 2024, reflecting robust momentum in financial innovation and infrastructure.
Challenges
-
Cultural adaptation and leadership localization remain major hurdles for sustaining Capability Center growth in the Middle East.
Despite strong infrastructure and incentives attracting investment, integrating culturally adaptive leadership and retaining skilled local talent remains challenging. Western management styles often clash with regional expectations on hierarchy, communication, and work-life balance. Pressure to localize leadership is hard to meet without robust internal talent pipelines, impacting continuity and decision-making. Lack of cultural integration can lead to high attrition and operational inefficiencies, undermining performance and stakeholder confidence in the long-term success of Capability Centers in the region.
Segment Analysis
By Service Type
IT Services (Application Development, Infrastructure Management, QA & Testing) led the Middle East Capability Centers Market in 2024 due to high regional demand for digital transformation and enterprise modernization. Governments and private enterprises increasingly outsourced application and infrastructure services to Capability Centers for cost efficiency, security, and scalability. The dominance was also fueled by the widespread implementation of cloud platforms, ERP systems, and the need for quality assurance in large digital projects.
Business Process Services are projected to grow fastest at a 27.04% CAGR from 2025–2032 as enterprises centralize back-office operations. Capability Centers support finance, HR, and procurement functions to cut costs and improve efficiency. Multilingual talent, time-zone advantages, and automation tools make the Middle East ideal for global delivery. The shift enhances standardization, while regional infrastructure and supportive policies drive rapid BPS adoption across multiple sectors.
By Industry Vertical
Technology & IT Services held the largest share of 28% in 2024 due to the Middle East’s prioritization of digital infrastructure, cybersecurity, and IT modernization. With large investments in smart city development and national digitalization programs, global firms established IT-focused centers to support agile software delivery, infrastructure management, and digital operations. The availability of skilled IT professionals and favorable regulatory environments further contributed to segment dominance across UAE, Saudi Arabia, and Qatar.
Healthcare & Life Sciences is projected to grow at a CAGR of 28.33% from 2025–2032 as regional healthcare reforms, medical tourism, and digital health adoption accelerate. Governments are investing heavily in health tech ecosystems and regulatory compliance frameworks, increasing the need for specialized Capability Centers. These centers are being used for health data management, clinical trial support, and AI-driven diagnostics, making the segment a key growth area amid rising population health demands.
By Ownership Model
Captive (In-house GCCs) dominated the Middle East Capability Centers Market with a 54% revenue share in 2024 as large enterprises preferred full control over service quality, data privacy, and operations. With regulatory support and rising digital maturity in the region, companies found it feasible to establish wholly owned centers. Captive models allowed firms to align strategic functions closely with corporate objectives while maintaining direct oversight of talent and compliance standards.
Hybrid / BOT (Build-Operate-Transfer) is projected to grow at the fastest CAGR of 27.21% from 2025–2032 due to its flexible entry model for global firms. This structure allows organizations to test and scale regional Capability Centers with reduced risk and local operational support. As trust in regional service ecosystems improves, many firms plan to convert third-party operations into fully owned assets over time, making the BOT model attractive for phased investments.
By Center Purpose
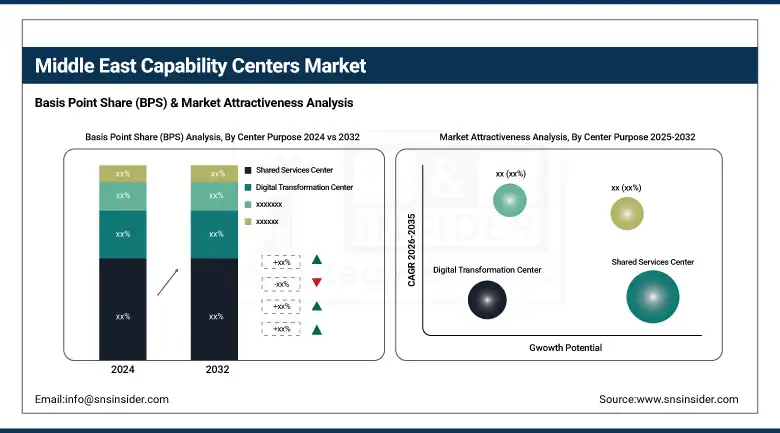
Shared Services Centers led the market with a 34% revenue share in 2024 due to strong demand for centralized service delivery in functions like finance, HR, and procurement. Organizations across industries leveraged shared services for cost reduction, efficiency improvement, and compliance. The Middle East’s growing ecosystem of business parks and talent hubs supported such setups, particularly in multinational firms looking to serve EMEA operations from a unified platform.
Analytics & AI CoEs are expected to grow at a CAGR of 26.85% from 2025–2032 driven by enterprise needs for data-driven decision-making, automation, and innovation. With digital transformation in full swing, organizations are building specialized centers for big data processing, AI model development, and predictive insights. Regional governments are also investing in AI strategies and skills training, positioning the Middle East as a fast-growing hub for data and intelligence capability development.
By Size of Center
Mid-size (200–1000 employees) Capability Centers dominated the Middle East market with a 45% revenue share in 2024 and are expected to grow at the fastest CAGR of 26.01% from 2025–2032. This dominance stems from their operational agility, cost-effectiveness, and optimal scale for managing diverse business functions. Mid-size centers offer flexibility to adapt quickly to evolving market demands without the complexities of large-scale operations. They are favored by multinational corporations and regional enterprises alike, driving rapid adoption across industries.
Regional Analysis
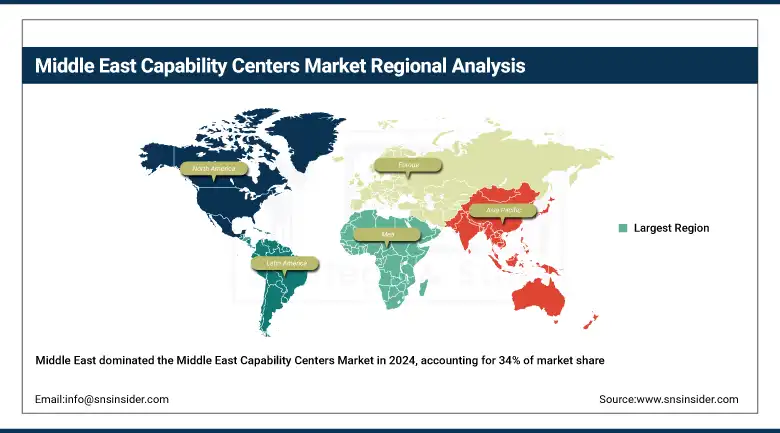
United Arab Emirates (UAE) led the Middle East Capability Centers Market in 2024 with a 34% revenue share due to its world-class infrastructure, business-friendly regulations, and strategic global connectivity. The presence of free zones, advanced digital ecosystems, and high-quality talent pools has attracted multinational corporations to establish regional hubs. Dubai and Abu Dhabi, in particular, have become preferred locations for IT, finance, and innovation centers supporting operations across the EMEA region.
Get Customized Report as per Your Business Requirement - Enquiry Now
This is further driven by initiatives like the UAE Green Agenda 2030, ambitious sustainability targets, and strong investment incentives in renewable-powered infrastructure. As part of its digital infrastructure expansion, the UAE’s IT load under construction is projected to exceed 841 MW by 2029, with raised-floor area surpassing 5 million square feet, and over 250,576 racks expected to be deployed, especially in Dubai and Abu Dhabi.
Major Data Center Expansions in the UAE
The UAE continues to solidify its position as a regional digital infrastructure leader, with several large-scale data center expansions currently underway:
-
Gulf Data Hub is actively developing a total of 82 MW in new capacity, including 32 MW at its Dubai Silicon Oasis (DSO) campus, 18 MW at KIZAD—scheduled for completion in Q2 2024 and 32 MW across two facilities located in the Industrial City of Abu Dhabi (ICAD).
-
Khazna Data Centers is leading one of the largest hyperscale rollouts in the region, with four major builds AUH 6/7 and DXB 2/3 collectively adding 104.7 MW, expected to go live by late 2024. In addition, Khazna is driving smaller yet strategic expansions at the MBR Solar Park (3.6 MW), IRIS (6 MW), and Khalifa City (5.5 MW).
-
Equinix has launched its first standalone DX3 facility, delivering 3.6 MW of live IT capacity to support growing enterprise and cloud workloads.
-
Microsoft, in partnership with G42 Cloud, is advancing efforts to deliver sovereign cloud services within the UAE, addressing the rising demand for locally compliant, scalable cloud infrastructure.
Saudi Arabia plays a growing role in the Middle East Capability Centers Market, driven by national digital transformation goals and a strong focus on technology-enabled services. Its strategic location, evolving regulatory environment, and support for foreign investment make it an emerging hub for IT, business process, and shared services. Increasing collaboration between government and private sector entities positions the country as a competitive destination for scalable and innovation-driven capability center operations.
Key Data Center Projects in Saudi Arabia
Saudi Arabia is rapidly emerging as a leading digital hub in the MENA region, with several transformative data center projects underway to support its Vision 2030 goals:
-
Center3 has significantly expanded its presence with a major 50.4 MW facility completed at Khurais, reinforcing the Kingdom’s growing hyperscale infrastructure.
-
Tonomus, the technology arm of NEOM, has launched a 12 MW data center as part of its futuristic smart city project, with an additional 24 MW currently in the pipeline.
-
Edgnex Data Centres is establishing strategic footprints in Riyadh and Dammam, collectively contributing 55 MW of new capacity to the national grid.
-
Huawei has announced the development of a new cloud data center in Riyadh, further strengthening its regional cloud footprint and supporting public and private sector digitalization.
-
Gulf Data Hub continues its expansion in the Kingdom with 8 MW currently operational at KAUST, and another 12 MW facility under development to cater to growing research and enterprise demand.
Key Players
Some of the key players in the Middle East Capability Centers Market are Tata Consultancy Services (TCS), Accenture, Wipro, Capgemini, IBM, Ernst & Young (EY), Deloitte, Oracle, SAP, and HCLTech.
Recent Developments:
-
2025: Accenture Announced formation of an Accenture–Siemens Business Group to develop global engineering “capability centres” focused on model‑based systems engineering and smart-vehicle frameworks (April 2025)
-
2024: TCS inaugurated its Pace Port AI Center of Excellence in La Défense, Paris (7th Pace facility globally), focusing on human‑centric AI solutions in June 2024.
-
2024: Wipro Expanded partnership with Dell and NVIDIA to strengthen its Enterprise AI‑Ready Platform, including AI orchestration via an “AI Control Center”.
-
2024: IBM launched the Guardium Data Security Center, enhancing hybrid-cloud data protection with AI integration and quantum-safe encryption capabilities for enterprise resilience.
| Report Attributes | Details |
|---|---|
| Market Size in 2024 | USD 4.2 Billion |
| Market Size by 2032 | USD 24.67 Billion |
| CAGR | CAGR of 24.90% From 2025 to 2032 |
| Base Year | 2024 |
| Forecast Period | 2025-2032 |
| Historical Data | 2021-2023 |
| Report Scope & Coverage | Market Size, Segments Analysis, Competitive Landscape, Regional Analysis, DROC & SWOT Analysis, Forecast Outlook |
| Key Segments | • By Service Type (IT Services, Business Process Services (BPS/BPO), Knowledge Process Outsourcing (KPO), Engineering Services, R&D and Innovation Services) • By Industry Vertical (Banking, Financial Services & Insurance (BFSI), Healthcare & Life Sciences, Retail & Consumer Goods, Energy & Utilities, Telecom & Media, Manufacturing & Automotive, Technology & IT Services, Public Sector & Government Services) • By Ownership Model (Captive (In-house GCCs), Third-party / Vendor Operated, Hybrid / Build-Operate-Transfer (BOT)) • By Center Purpose (Shared Services Center, Innovation Hub, Digital Transformation Center, Analytics & AI Centers of Excellence (CoEs), Cybersecurity Operations Centers) • By Size of Center (Small (Under 200 employees), Mid-size (200–1000 employees), Large (1000+ employees)) |
| Regional Analysis/Coverage | United Arab Emirates, Saudi Arabia, Qatar, Bahrain, Kuwait, Oman |
| Company Profiles | Tata Consultancy Services (TCS), Accenture, Wipro, Capgemini, IBM, Ernst & Young (EY), Deloitte, Oracle, SAP, HCLTech |
Frequently Asked Questions
Ans: The UAE dominated with 34% market share in 2024, driven by free zones, skilled talent, and over 841?MW of IT load under construction.
Ans: Captive (in-house GCCs) held the lead with 54% revenue share in 2024, favored for data security, strategic alignment, and regulatory compliance.
Ans: Government strategies like Saudi Vision 2030 and UAE’s digital economy agenda, along with sector-wide digital transformation, are major drivers of market expansion.
Ans: In 2024, the Middle East Capability Centers Market was valued at USD 4.2 billion, marking the foundation for sustained regional growth and investment.
Ans: The market is expected to grow at a CAGR of 24.90% from 2025 to 2032, reaching USD 24.67 billion by the end of the forecast period.
Get in Touch
