Commercial Real Estate Market Report Scope & Overview:
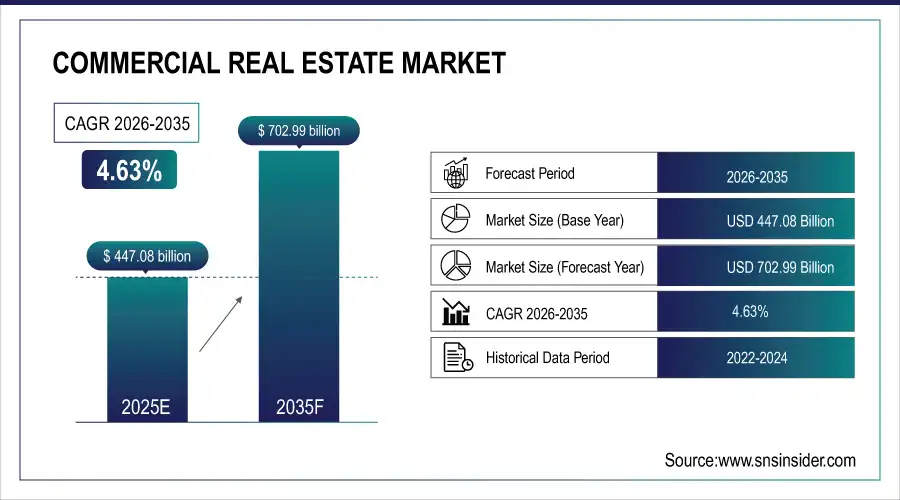
The Commercial Real Estate Market Size was valued at USD 447.08 billion in 2025 and is expected to reach USD 702.99 billion by 2035 and grow at a CAGR of 4.63% over the forecast period 2026-2035. Commercial real estate is a specific type of business property, such as offices, retail, industrial, multifamily, or hospitality. Urbanization and technology-based transformation, and changes in work patterns, even accelerate this market segment globally. Strategic investments are focused on creative and technological assets, such as flex office, logistic facilities, and green buildings. Its general description is based on the general state of the economy, capital flows, and other documentation, making it an element of the global economy and the infrastructure of cities.
Market Size and Forecast: 2025
-
Market Size in 2025 USD 447.08 Billion
-
Market Size by 2035 USD 702.99 Billion
-
CAGR of 4.63% From 2026 to 2035
-
Base Year 2025
-
Forecast Period 2026-2035
-
Historical Data 2022-2024
To Get more information On Commercial Real Estate Market - Request Free Sample Report
Commercial Real Estate Market Trends:
• Strong growth in demand for industrial and logistics real estate driven by expanding e-commerce, last-mile delivery, and omnichannel fulfillment models
• Rising investment in large-scale warehouses, distribution centers, and urban logistics hubs to support faster delivery timelines
• Accelerating adoption of smart building technologies, including IoT, AI-based energy management, and automated security systems
• Increasing focus on sustainability, green buildings, and ESG compliance to meet regulatory requirements and investor expectations
• Growing tenant preference for technology-enabled, efficient, and flexible commercial spaces that enhance operational efficiency and user experience
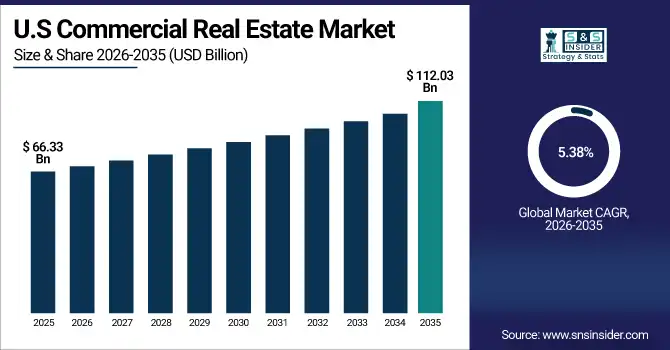
The U.S. commercial real estate market size was USD 66.33 billion in 2024 and is expected to reach USD 112.03 billion by 2035, growing at a CAGR of 5.38% over the forecast period of 2026-2036. Robust economic growth, healthy job creation, and secular demand growth for industrial and logistics spaces driven by e-commerce are what drive the U.S. commercial real estate market. Demand for office and multifamily housing is also driven by urbanization and infrastructure investments. North America is dominated by the U.S., which has a large, diverse economy, advanced technology platforms for real estate, and capital markets that attract large amounts of domestic and foreign capital.
Commercial Real Estate Market Growth Drivers:
-
Increasing E-commerce Growth and Demand for Industrial Logistics Spaces Drives Expansion of Market
E-commerce has emerged as a major pillar for the commercial real estate sector, especially in terms of the industrial and logistics asset class, which has experienced the strongest demand for commercial real estate market growth. With the growth of online shopping, every company needs warehouses, distribution centers, and fulfillment nodes strategically located to deliver goods to consumers as quickly as possible. The increasing demand for warehouse space was highlighted, for instance, by Prologis' announcement in August 2024 of a USD 1.5 billion deal to add logistics real estate in major U.S. metropolitan hubs. Increased demand for logistics space stimulates leasing momentum, and this demand triggers new construction suited to e-commerce supply chains, spurring commercial real estate growth. In addition, this further enables employment growth and urban economic activity as distribution logistics is generating the most significant real estate market.
Commercial Real Estate Market Restraints:
-
Rising Interest Rates and Inflationary Pressures Slow Investment and Development in the Commercial Real Estate Market
Rising interest rates coupled with persistent inflation pose significant challenges to the commercial real estate market trends, increasing borrowing costs and dampening investor confidence. Rising mortgage and financing rates act to diminish the potential of new developments and new acquisitions, with smaller investors and developers most acutely impacted by tighter capital availability. Growing inflation puts pressure on the costs of construction and development, which reduces margins and stretches the timelines of projects. For instance, higher material costs like steel and lumber have caused many U.S. cities to delay projects in 2023 and early 2024. Such economic pressures also affect the cost base for rentals, which also reduces the demand from tenants in the more price-elastic sectors of the rental market.
Commercial Real Estate Market Opportunities:
-
Rising Adoption of Smart Building Technologies Present Growth Opportunity for Commercial Real Estate Market
The integration of smart building technologies offers a transformative opportunity for the commercial real estate market analysis to enhance property value, efficiency, and tenant experience. Adopt a system with Internet of Things (IoT) devices, energy management, and automated security, and reduce operational costs while embracing sustainability.
For instance, in October 2024, is its smart offices with AI-based climate control and space utilization analytics across the Boston Properties Commercial Portfolio. Marketing of this innovation in space serves tech-oriented incoming tenants, and is also a natural match given increasing regulatory scrutiny on GHG reductions in green buildings due to growing ESG compliance. Leveraging smart technologies positions commercial properties as future-ready assets, attracting investors and occupiers looking for a sustainable tech-enabled space.
Commercial Real Estate Market Segment Analysis:
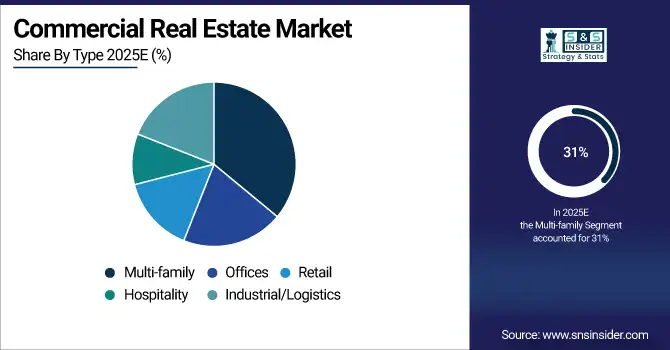
By Type
In 2025, multi-family is the largest revenue share at 31%, driven by increased demand for rental residential properties due to urbanization and challenges in housing affordability. Leading firms, including Greystar Real Estate Partners, launched large, multi-family deployments like the “Rise at La Central” in California in 2024, featuring new features and environmentally sensitive designs. The growth is consistent with the commercial real estate market's focus on relatively low-volatility income-generating properties due to population density growth and secular trends toward rental housing. Within the industry, multi-family property has been a popular sector, as these properties have proven to be some of the most resilient real estate assets and one of the most stable in terms of cash flow. The hospitality segment will be the highest growth market with a CAGR of 9.16% during the forecast period. Examples such as the opening of “AC Hotels by Marriott” in prime city locations (2025) have seen well-known players like Marriott International expand their portfolios, incorporating technology-enabled guest experiences. The job growth feeds into the commercial real estate market, as it allows hotel assets to be redeveloped and promotes mixed-use developments. An evolving symbol of how consumer preferences have slowly changed and how global mobility has been on the rise, and people can still see that the hospitality sector recovery is just one aspect that will make commercial real estate flourish in different regions globally.
Commercial Real Estate Market Regional Analysis:
Asia Pacific Commercial Real Estate Market Insights
The Asia Pacific region held the largest share in 2025, with an estimated Commercial Real Estate Market share of around 39%. With rapid urbanization, a growing middle class, and developments in infrastructure, commercial real estate is flourishing in Asia Pacific. Driven by massive domestic urban development, strong foreign investment, and government-backed infrastructure, China is at the forefront of Asia Pacific's commercial real estate market. Key segments, including Office space along with retail and industrial spaces in international cities, such as Shanghai and Beijing, attract global investors and developers seeking long-term growth and strategic market presence.

Get Customized Report as per Your Business Requirement - Enquiry Now
North America Commercial Real Estate Market Insights
North America has represented the highest growth, with an estimated CAGR of over 6.8% in the Commercial Real Estate Market during the forecast period. Growth in North America’s commercial property sector is being fueled by e-commerce expansion, technology-oriented real estate solutions, and high-rate capital flows. Underpinned by its size and diversity as an economy, proptech innovation, and high levels of investor confidence, the U.S. is the driving force behind the North American commercial real estate market. New York, Los Angeles, and Dallas dominate office, industrial, and multifamily development, respectively, buttressed by existing infrastructure and tenant demand from local and foreign entities.
Europe Commercial Real Estate Market Insights
In 2025, Europe remains on top in the commercial real estate market, upheld by strong development fundamentals and urban renewal projects. However, European commercial real estate is being supported by a focus on sustainability, continued demand for logistics hubs, and an institutional investment appetite. Germany topped the list as the strongest economy, coupled with a solid industrial base and rising need for logistics and office space, especially in Berlin and Frankfurt. Another contributing factor to the growth of this region is institutional investments and increasing demand for sustainable green-certified buildings.
Latin America (LATAM) and Middle East & Africa (MEA) Commercial Real Estate Market Insights
In 2025, the commercial real estate market experienced significant growth in the Middle East & Africa and Latin America regions, fueled by urban growth, government schemes, and overseas investment. UAE was leading MEA, with mega projects driving hospitality, retail, and officedemand in Dubai and Abu Dhabi. Brazil was dominant in Latin America, particularly in São Paulo and Rio de Janeiro, where office and logistics property demand was boosted by economic reforms and digital transformation. Mixed-use developments and sustainable real estate are also witnessing increased attention in both regions, redefining their urban commercial fabrics.
Commercial Real Estate Market Key Players:
The commercial real estate market companies are Atlas Technical Consultants, Boston Commercial Properties Inc., Brookfield Business Partners LP, CBRE Group Inc., Dalian Wanda Group, DLF Ltd., Keller Williams Realty Inc., Lee and Associates Licensing and Administration Co. LP, Link Asset Management Ltd., Marcus and Millichap Real Estate Investment Services Inc., and Others.
Competitive Landscape for Commercial Real Estate Market:
Brookfield is a global alternative asset manager with a strong presence in the commercial real estate market, owning and operating high-quality office, retail, industrial, and logistics properties. The company focuses on long-term value creation through active asset management, sustainability initiatives, and strategic investments across major global real estate markets.
-
In October 2024, Brookfield Business Partners LP acquired Tritax EuroBox, a UK-based logistics real estate company, for USD1.44 billion. This acquisition underscores Brookfield's strategic focus on expanding its logistics and industrial real estate portfolio in Europe.
Atlas Technical Consultants is a leading provider of engineering, testing, inspection, and consulting services supporting the commercial real estate market. The company enables property development, construction, and asset management through due diligence, environmental consulting, and infrastructure solutions, helping investors and developers manage risk and optimize project performance across commercial real estate assets.
-
In August 2023, Atlas Technical Consultants expanded its service capabilities by acquiring SCST Engineering, which specializes in geotechnical engineering and construction materials testing. This acquisition enhances Atlas's commercial real estate market presence, particularly in infrastructure and construction services.
Boston Commercial Properties Inc. is a commercial real estate firm specializing in the development, leasing, and management of office and mixed-use properties. The company focuses on delivering high-quality, strategically located assets that support tenant demand, urban growth, and long-term value creation within the commercial real estate market.
-
In November 2023, Boston Commercial Properties Inc. successfully sold a 48,848-square-foot commercial building in the Boston area for USD6.4 million. This transaction reflects the company's active involvement in the commercial real estate market, focusing on property sales and investments.
|
Report Attributes |
Details |
|---|---|
| Market Size in 2025 | USD 447.08 Billion |
| Market Size by 2035 | USD 702.99 Billion |
| CAGR | CAGR of 4.63% From 2026 to 2035 |
| Base Year | 2025 |
| Forecast Period | 2026-2035 |
| Historical Data | 2022-2024 |
|
Report Scope & Coverage |
Market Size, Segments Analysis, Competitive Landscape, Regional Analysis, DROC & SWOT Analysis, Forecast Outlook |
|
Key Segments |
• By Type (Offices, Retail, Industrial/Logistics, Multi-family, and Hospitality) |
|
Regional Analysis/Coverage |
North America (US, Canada), Europe (Germany, UK, France, Italy, Spain, Russia, Poland, Rest of Europe), Asia Pacific (China, India, Japan, South Korea, Australia, ASEAN Countries, Rest of Asia Pacific), Middle East & Africa (UAE, Saudi Arabia, Qatar, South Africa, Rest of Middle East & Africa), Latin America (Brazil, Argentina, Mexico, Colombia, Rest of Latin America). |
|
Company Profiles |
Atlas Technical Consultants, Boston Commercial Properties Inc., Brookfield Business Partners LP, CBRE Group Inc., Dalian Wanda Group, DLF Ltd., Keller Williams Realty Inc., Lee and Associates Licensing and Administration Co. LP, Link Asset Management Ltd., Marcus and Millichap Real Estate Investment Services Inc., and Others. |
Get in Touch
