image

Commercial Satellite Imaging Market Size, Share & Segmentation By Component (Hardware, Software, and Services), Application (Geospatial Data Acquisition & Mapping, Urban Planning & Development, Disaster Management, Energy & Natural Resource Management, Surveillance & Security, Defense & Intelligence, and Others), End-User (Government, Military & Defense, Forestry and Agriculture, Energy, Civil Engineering and Archaeology, Transportation and Logistics, and Others), and Region| Global Forecast 2025-2032

Date: July 2025 Report Code: SNS/ICT/7782 Page 350

Commercial Satellite Imaging Market Report Scope & Overview:

The commercial satellite imaging market size was valued at USD 4.9 billion in 2024 and is expected to reach USD 13.7 billion by 2032, growing at a CAGR of 13.19% during 2025-2032.
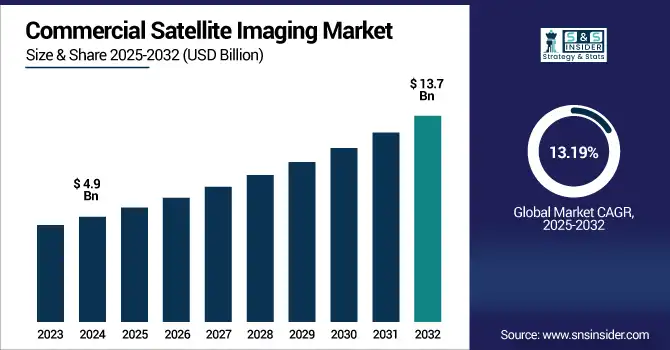
Commercial Satellite Imaging Market growth is being fueled by growing usage in the domains of defense, agriculture, urban planning, and disaster management. Satellite-capture capabilities are being augmented with continued progress in high-resolution imaging, geospatial analytics, and AI integration, all extended into higher-frequency temporal bands to further enrich satellite-captured data. Governments and private entities are using satellite imaging for border surveillance, monitoring of infrastructure, and tracking environmental changes. In addition, adoption is driven by the increase in natural disasters and the need to monitor the climate. The spread of small satellite constellations and decreasing launch prices are also enabling satellite imaging to be a more affordable option. The increased utilization of aerial imagery by the media, real estate, and insurance industries is also adding fuel to the fire. Reportedly, the market is anticipated to record substantial CAGR during 2025-2032 due to the growing adoption of AI-enabled analytics, rising Earth observation missions, and increasing commercial applications in precision agriculture and smart cities.

The U.S. market is driven by defense modernization, precision agriculture, and climate monitoring. Expanded demand for high-resolution geospatial data and AI-driven analysis products drives rapid growth in enterprise geospatial analytics. The Integrated Commercial Satellite Imaging Market trend in the U.S. will see the market grow from USD 1.53 billion in 2024 to USD 4.02 billion by 2032, at a CAGR of 12.90%.

Market Dynamics:

Drivers:

  • Rising Multi-Sector Demand for Real-Time Geospatial Intelligence Drives Adoption of High-Resolution Satellite Imaging

High-resolution Earth observation data has become essential for many sectors, including agriculture, defense, mining, urban planning, and disaster management, and is thus a significant driver of the commercial satellite imaging market. Increased satellite sensor technologies allow for capturing detailed imagery in real time or near real time, which is changing how organizations monitor environmental changes, manage resources, and respond to emergencies. Satellite imagery plays a crucial role in border monitoring, as well as tactical planning, in defense. In agriculture, satellite images can be used for vegetation and soil data that is essential to precision farming. The increasing multi-industry reliance on high-quality geospatial intelligence is driving investment in satellite imaging infrastructure and expanding commercial use of this imagery worldwide

For instance, in 2023 alone, commercial operators captured and distributed over 500 million high-resolution images (up from 350 million in 2022), fueling real-time analytics demand

Restraints:

  • High Satellite Development and Launch Costs Limit Market Accessibility for Smaller Players and Startups

The cost of satellite manufacturing, launching, and maintenance remains the key restraint for the commercial satellite imaging market despite technological advancements. For new entrants and smaller industries, the entry barrier is high. Even small satellites require millions of dollars to be placed in orbit and rely on the availability of space launch providers. In addition, national security and image resolution limits may act as operational challenges associated with regulatory constraints as well. High-resolution data is fast and useful, but is rarely released to the public in a way that can be more widely used because of U.S. and European regulations. Such financial and legal aspects may hinder innovation and postpone the project's implementation, restraining market expansion and leaving only better-capitalized companies or state-backed firms to take part in it.

For Instance, In 2023, just 5% of the 2,680 small satellites were launched using small/micro launch vehicles, with most piggybacking on larger rockets, reflecting cost constraints.

Opportunities:

  • Integration of AI and Cloud Analytics Enables Faster, Scalable Insights from Satellite Imagery for Diverse Applications

Artificial intelligence  and cloud computing integration with satellite imaging opens a new paradigm for the commercial satellite imaging market. AI-driven analytics facilitate on-demand object identification, pattern detection, and predictive analysis using satellite images by providing real-time insights in various sectors. High-volume image analysis can be even more portable, scalable, and efficient when cloud platforms are leveraged for storage and processing. In agriculture, AI can be harnessed to identify crop stress or forecast yield, and for urban planning, it can be deployed to observe infrastructure development, for instance. This merging of satellite information with smart computing platforms not only enables new revenue streams and easier decision-making, it also makes the information more widely accessible to non-expert users, which makes the satellite imaging sector much more commercially viable and agile.

As of April 2025, AI technologies in the space industry are enhancing satellite data analysis speed and accuracy by up to 70% .

Challenges:

  • Rising Data Privacy Concerns and Cybersecurity Risks Threaten Widespread Commercial Use and Client Trust

Data privacy and cybersecurity risks are among the most fundamental issues facing the commercial satellite imaging market. With advances in high-resolution satellite imagery and its court accessibility, geographic or individual sensitive information can be easily abused. This technology can also serve the malicious purpose of unauthorized surveillance, exposure of critical infrastructure layouts, or being abused by hostile entities. Besides, satellite systems are exposed to cyberattacks, signal jamming, and data breaches that can endanger mission integrity and compromise client trust. To counter these, strong encryption, regulatory compliance, and international cooperation are needed. If data security is not ensured, it could be a barrier to adoption, most importantly by government organizations and other critical industries that need to operate in strict confidentiality and reliability.

Segmentation Analysis:

By Component:

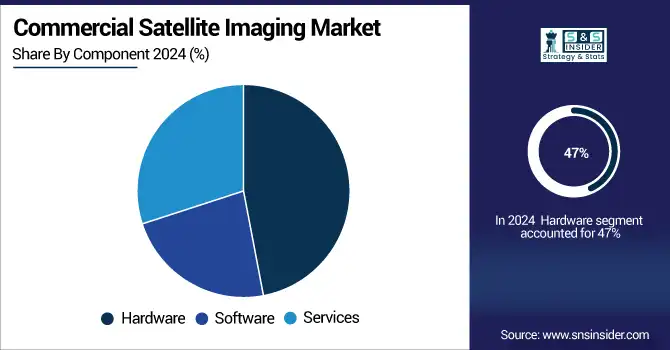
The hardware segment dominated the market in 2024 and accounted for 47% of the commercial satellite imaging market share due to constant deployment of high-resolution satellites and rising need for advanced optical sensors. This segment will remain the largest through 2032, due to investment in next-gen payloads, miniaturization, and multispectral imaging. The number of hardware adoption will continue to rise tied to growing government defense contracts and private Earth observation missions across environmental, military, and infrastructure applications.

Software is the fastest-growing segment. Soaring adoption of AI, cloud, and automation for real-time image analysis drives the growth of the software segment. In 2032, software tools will prove essential in transforming raw satellite data into actionable intelligence. Improved predictive analytics, object recognition, and scalable platforms will cement software as the center of decision-making in areas including, but not limited to, agriculture, surveillance, and urban planning.
By Application:

Defense & Intelligence dominated the commercial satellite imaging market in 2024 and accounted for a significant revenue share, due to image acquisition needs to fulfill the high demand for real-time surveillance, target tracking, and border security. High-resolution satellite constellations for surveillance and reconnaissance are being developed globally by governments. The continued economic growth through 2032 will be driven by the need for sustained growth as geopolitical tensions persist and nations continue counter-terrorism operations and move toward modernizing their intelligence capabilities, making satellite imaging an integral and most sought-after component of national security and defense operations.

On April 9, 2025, the U.S. National Reconnaissance Office (NRO) and U.S. Space Force are finalizing a joint framework to streamline the acquisition and sharing of commercial satellite imagery for defense intelligence. The initiative aims to bolster ISR (intelligence, surveillance, reconnaissance) capabilities using commercial Earth observation assets.

Disaster Management is set to register the fastest CAGR during the forecast period, owing to increasing climate-related events and global commitment to early warning systems. Since 2023, satellite images have become conventional for real-time detection of disasters, designing responses, and assessing recovery. The Humanitarians and Emergency Service Providers will need fast access to satellite imaging, and by the year 2032, the advent of rapidly processed imaging data in step with AI-powered pattern recognition will enable rapid disaster readiness.

By End-Use

Forestry and Agriculture lead the commercial satellite imaging market in 2024 and represented a significant revenue share, due to increasing use of satellite-based imaging solutions for crop monitoring, yield prediction, and land use, therefore making Forestry and Agriculture the leading vertical, and accounting for the highest revenue share. Satellites are an important tool for precision farming, but they also play an essential role in the policy supporting it: governments and agritech firms alike track environmental compliance using satellite data. Imaging will be indispensable for the sustainable manufacturing of food and woody products, enabling resource optimization in agriculture and forestry by 2032 due to increasing food demand and accelerating climate variability.

Jan 14, 2025, Google-backed Pixxel successfully launched three hyperspectral imaging satellites, enhancing Earth observation capabilities for agriculture, forestry, environmental monitoring, and mining. This marks a significant advancement in delivering detailed crop health and forest biomass insights.

Transportation and Logistics is the fastest-growing segment during 2025-2032, owing to route optimization, infrastructure monitoring, and supply chain visibility. Fleet overflight, port switching, or even securing motion for traffic forecasting, after all 2023 satellite images are implemented. The demand for Smart Cities and autonomous logistics and the need for real-time mapping will spur the growth of imaging for transport networks, leading to a 10X increase by 2032.

Regional Analysis:

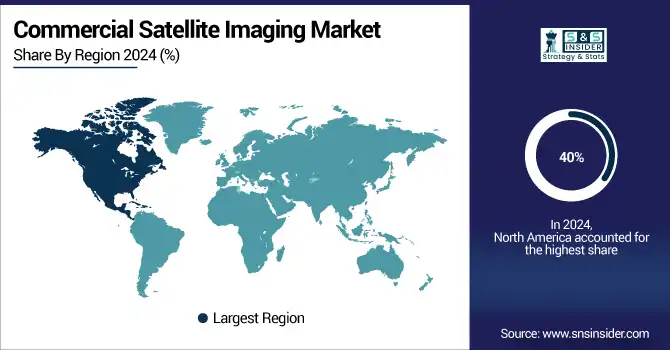
North America dominated the commercial satellite imaging market in 2024 and accounted for 40% of revenue share, due to investments by major players such as Maxar and Planet Labs focusing on defense, space exploration, and commercial Earth observation. For example, satellite imagery is very commonly used by government agencies, such as NASA and NOAA. Then by 2032, the region will still be viewed as the imaging solution leader, as they will continue to invest in AI-integrated space technology, homeland security, and environmental monitoring.

Asia-Pacific is expected to register the fastest CAGR during the forecast period, driven by increasing space programs in China, India and Japan, and increasing demand for imaging for agriculture, disaster response and infrastructure requirement. As the private sector roles up and a high rate of urbanization is followed by potential investments in small satellite constellations, the region will fast-track its commercial satellite imaging applications by 2032.

Europe’s commercial satellite imaging market growth is driven by the increasing investments in climate monitoring, defense imaging, precision agriculture, smart infrastructure, and more, which are generating opportunities for the growth of the market in Europe. Growth in EU space programs and public-private assignments will expedite adoption. Europe will be a hotbed for strategic satellite imaging by 2032, driven by demand for high-resolution imaging to support national infrastructure and sustainability goals.

Germany dominates the European commercial satellite imaging market due to strong defence spending, innovation from its defence industry, and cooperation with innovative satellite imaging companies like Planet Labs. Advanced Earth observation use cases are supported by AI and space tech initiatives, which are backed by the government. Germany will top the defence intelligence, agricultural monitoring, and environmental mapping applications by the year 2032.
Key Players:

The major commercial satellite imaging market companies are Maxar Technologies, Airbus Defence and Space, Planet Labs PBC, BlackSky Global, ICEYE, ImageSat International, L3Harris Technologies, Satellogic, Capella Space, GeoIQ.io  and others.

Recent Developments:

  • On March 6, 2025, Airbus Defence & Space deployed the CSO‑3 satellite via Ariane 6, delivering very-high-resolution optical imagery to France's DGA and Space Command under the MUSIS military program.

  • On May 8, 2025,  ICEYE and Rheinmetall signed an MoU to form Rheinmetall ICEYE Space Solutions JV in Germany, aiming to produce SAR satellites in Neuss for defense-grade ISR capabilities.

  • On February 25, 2025, Planet Labs extended its multi-year enterprise license with Bayer, integrating PlanetScope, Tasking, Fusion, Basemaps, and analytics to support precision farming operations

Commercial Satellite Imaging Market Report Scope:

Report Attributes

Details

Market Size in 2024

US$ 123.9 Billion

Market Size by 2032

US$  815.3 Billion

CAGR

CAGR of 26.58% From 2025 to 2032

Base Year

2024

Forecast Period

2025-2032

Historical Data

2021-2023

Report Scope & Coverage

Market Size, Segments Analysis, Competitive  Landscape, Regional Analysis, DROC & SWOT Analysis, Forecast Outlook

Key Segments

• By Enterprise Size (SMEs, Large Enterprises)
• By Application (Data Sovereignty, Operational Sovereignty, Digital Sovereignty)
• By Industry (BFSI, Healthcare, Government & Public Sector, Manufacturing, Others [Energy & Utilities, etc.])

Regional Analysis/Coverage

North America (US, Canada, Mexico), Europe (Germany, France, UK, Italy, Spain, Poland, Turkey, Rest of Europe), Asia Pacific (China, India, Japan, South Korea, Singapore, Australia, Rest of Asia Pacific), Middle East & Africa (UAE, Saudi Arabia, Qatar, South Africa, Rest of Middle East & Africa), Latin America (Brazil, Argentina, Rest of Latin America)

Company Profiles

Microsoft, Amazon Web Services, Google Cloud, IBM Corporation, Oracle, SAP SE, T-Systems, OVHcloud, Atos, VMware  and others in the report

Frequently Asked Questions

Ans- The expected CAGR of the Commercial Satellite Imaging Market over 2025-2032 is 13.19%.

Ans- The commercial satellite imaging market size was valued at USD 4.9 billion in 2024 and is expected to reach USD 13.7 billion by 2032

Ans- Rising Multi-Sector Demand for Real-Time Geospatial Intelligence Drives Adoption of High-Resolution Satellite Imaging

Ans- The hardware segment dominated the market in 2024 and accounted for 47% of commercial satellite imaging market share

 Ans- North America region dominated the Commercial Satellite Imaging Market with 40% of revenue share in 2024.

Table of Contents

1. Introduction

1.1 Market Definition

1.2 Scope (Inclusion and Exclusions)

1.3 Research Assumptions

2. Executive Summary

2.1 Market Overview

2.2 Regional Synopsis

2.3 Competitive Summary

3. Research Methodology

3.1 Top-Down Approach

3.2 Bottom-up Approach

3.3. Data Validation

3.4 Primary Interviews

4. Market Dynamics Impact Analysis

4.1 Market Driving Factors Analysis

4.1.1 Drivers

4.1.2 Restraints

4.1.3 Opportunities

4.1.4 Challenges

4.2 PESTLE Analysis

4.3 Porter’s Five Forces Model

5. Statistical Insights and Trends Reporting

5.1 Satellite Image Demand Growth, by Industry Vertical

5.2 High-Resolution Imaging Adoption, by Region

5.3 Geospatial Data Utilization Trends (2020–2025)

5.4 Government vs. Commercial End-User Share, by Application

6. Competitive Landscape

6.1 List of Major Companies, By Region

6.2 Market Share Analysis, By Region

6.3 Product Benchmarking

6.3.1 Product specifications and features

6.3.2 Pricing

6.4 Strategic Initiatives

6.4.1 Marketing and promotional activities

6.4.2 Distribution and Supply Chain Strategies

6.4.3 Expansion plans and new Product launches

6.4.4 Strategic partnerships and collaborations

6.5 Technological Advancements

6.6 Market Positioning and Branding

7. Commercial Satellite Imaging Market Segmentation By Component

7.1 Chapter Overview

7.2 Software

        7.2.1 Software Market Trends Analysis (2021-2032)

7.2.2 Software Market Size Estimates and Forecasts to 2032 (USD Billion)

7.3 Services

     7.3.1 Services Market Trends Analysis (2021-2032)

           7.3.2 Services Market Size Estimates and Forecasts to 2032 (USD Billion)

7.4 Hardware

     7.4.1 Hardware Market Trends Analysis (2021-2032)

           7.4.2 Hardware Market Size Estimates and Forecasts to 2032 (USD Billion)

8. Commercial Satellite Imaging Market Segmentation By Application

8.1 Chapter Overview

8.2 Geospatial Data Acquisition & Mapping

     8.2.1 Geospatial Data Acquisition & Mapping Market Trend Analysis (2021-2032)

           8.2.2 Geospatial Data Acquisition & Mapping Market Size Estimates and Forecasts to 2032 (USD Billion)

8.3 Urban Planning & Development

      8.3.1 Urban Planning & Development Market Trends Analysis (2021-2032)

           8.3.2 Urban Planning & Development Market Size Estimates and Forecasts to 2032 (USD Billion)

 8.4 Disaster Management

      8.4.1 Disaster Management Market Trends Analysis (2021-2032)

           8.4.2 Disaster Management Market Size Estimates and Forecasts to 2032 (USD Billion)

 8.5 Energy & Natural Resource Management

      8.5.1 Energy & Natural Resource Management Market Trends Analysis (2021-2032)

           8.5.2 Energy & Natural Resource Management Market Size Estimates and Forecasts to 2032 (USD Billion)

 8.6 Surveillance & Security

      8.6.1 Surveillance & Security Market Trends Analysis (2021-2032)

           8.6.2 Surveillance & Security Market Size Estimates and Forecasts to 2032 (USD Billion)

 8.7 Defense & Intelligence

      8.7.1 Defense & Intelligence Market Trends Analysis (2021-2032)

           8.7.2 Defense & Intelligence Market Size Estimates and Forecasts to 2032 (USD Billion)

 8.8 Other

      8.8.1 Other Market Trends Analysis (2021-2032)

           8.8.2 Other Market Size Estimates and Forecasts to 2032 (USD Billion)

9. Commercial Satellite Imaging Market Segmentation By End-User

9.1 Chapter Overview

9.2 Government

        9.2.1 Government Market Trends Analysis (2021-2032)

9.2.2 Government Market Size Estimates and Forecasts to 2032 (USD Billion)

9.3 Military & Defense

        9.3.1 Military & Defense Market Trends Analysis (2021-2032)

9.3.2 Military & Defense Market Size Estimates and Forecasts to 2032 (USD Billion)

9.4 Forestry and Agriculture

        9.4.1 Forestry and Agriculture Market Trends Analysis (2021-2032)

9.4.2 Forestry and Agriculture Market Size Estimates and Forecasts to 2032 (USD Billion)

9.5 Energy

        9.5.1 Energy Market Trends Analysis (2021-2032)

9.5.2 Energy Market Size Estimates and Forecasts to 2032 (USD Billion)

9.6 Civil Engineering and Archaeology

        9.6.1 Civil Engineering and Archaeology Market Trends Analysis (2021-2032)

9.6.2 Civil Engineering and Archaeology Market Size Estimates and Forecasts to 2032 (USD Billion)

9.7 Transportation and Logistics

        9.7.1 Transportation and Logistics Market Trends Analysis (2021-2032)

9.7.2 Transportation and Logistics Market Size Estimates and Forecasts to 2032 (USD Billion)

9.8 Others

        9.8.1 Others Market Trends Analysis (2021-2032)

9.8.2 Others Market Size Estimates and Forecasts to 2032 (USD Billion)

10. Regional Analysis

10.1 Chapter Overview

10.2 North America

10.2.1 Trends Analysis

10.2.2 North America Commercial Satellite Imaging Market Estimates and Forecasts, by Country (2021-2032) (USD Billion)

10.2.3 North America Commercial Satellite Imaging Market Estimates and Forecasts, By Component (2021-2032) (USD Billion) 

10.2.4 North America Commercial Satellite Imaging Market Estimates and Forecasts, By Application (2021-2032) (USD Billion)

10.2.5 North America Commercial Satellite Imaging Market Estimates and Forecasts, By End-User (2021-2032) (USD Billion)

10.2.6 USA

10.2.6.1 USA Commercial Satellite Imaging Market Estimates and Forecasts, By Component (2021-2032) (USD Billion)

10.2.6.2 USA Commercial Satellite Imaging Market Estimates and Forecasts, By Application (2021-2032) (USD Billion)

10.2.6.3 USA Commercial Satellite Imaging Market Estimates and Forecasts, By End-User (2021-2032) (USD Billion)

10.2.7 Canada

10.2.7.1 Canada Commercial Satellite Imaging Market Estimates and Forecasts, By Component (2021-2032) (USD Billion)

10.2.7.2 Canada Commercial Satellite Imaging Market Estimates and Forecasts, By Application (2021-2032) (USD Billion)

10.2.7.3 Canada Commercial Satellite Imaging Market Estimates and Forecasts, By End-User (2021-2032) (USD Billion)

10.2.8 Mexico

10.2.8.1 Mexico Commercial Satellite Imaging Market Estimates and Forecasts, By Component (2021-2032) (USD Billion)

10.2.8.2 Mexico Commercial Satellite Imaging Market Estimates and Forecasts, By Application (2021-2032) (USD Billion)

10.2.8.3 Mexico Commercial Satellite Imaging Market Estimates and Forecasts, By End-User (2021-2032) (USD Billion)

10.3 Europe

10.3.1 Trends Analysis

10.3.2 Europe Commercial Satellite Imaging Market Estimates and Forecasts, by Country (2021-2032) (USD Billion)

10.3.3 Europe Commercial Satellite Imaging Market Estimates and Forecasts, By Component (2021-2032) (USD Billion) 

10.3.4 Europe Commercial Satellite Imaging Market Estimates and Forecasts, By Application (2021-2032) (USD Billion)

10.3.5 Europe Commercial Satellite Imaging Market Estimates and Forecasts, By End-User (2021-2032) (USD Billion)

10.3.6 Germany

10.3.1.6.1 Germany Commercial Satellite Imaging Market Estimates and Forecasts, By Component (2021-2032) (USD Billion)

10.3.1.6.2 Germany Commercial Satellite Imaging Market Estimates and Forecasts, By Application (2021-2032) (USD Billion)

10.3.1.6.3 Germany Commercial Satellite Imaging Market Estimates and Forecasts, By End-User (2021-2032) (USD Billion)

10.3.7 France

10.3.7.1 France Commercial Satellite Imaging Market Estimates and Forecasts, By Component (2021-2032) (USD Billion)

10.3.7.2 France a Commercial Satellite Imaging Market Estimates and Forecasts, By Application (2021-2032) (USD Billion)

10.3.7.3 France Commercial Satellite Imaging Market Estimates and Forecasts, By End-User (2021-2032) (USD Billion)

10.3.8 UK

10.3.8.1 UK Commercial Satellite Imaging Market Estimates and Forecasts, By Component (2021-2032) (USD Billion)

10.3.8.2 UK Commercial Satellite Imaging Market Estimates and Forecasts, By Application (2021-2032) (USD Billion)

10.3.8.3 UK Commercial Satellite Imaging Market Estimates and Forecasts, By End-User (2021-2032) (USD Billion)

10.3.9 Italy

10.3.9.1 Italy Commercial Satellite Imaging Market Estimates and Forecasts, By Component (2021-2032) (USD Billion)

10.3.9.2 Italy Commercial Satellite Imaging Market Estimates and Forecasts, By Application (2021-2032) (USD Billion)

10.3.9.3 Italy Commercial Satellite Imaging Market Estimates and Forecasts, By End-User (2021-2032) (USD Billion)

10.3.10 Spain

10.3.10.1 Spain Commercial Satellite Imaging Market Estimates and Forecasts, By Component (2021-2032) (USD Billion)

10.3.10.2 Spain Commercial Satellite Imaging Market Estimates and Forecasts, By Application (2021-2032) (USD Billion)

10.3.10.3 Spain Commercial Satellite Imaging Market Estimates and Forecasts, By End-User (2021-2032) (USD Billion)

10.3.12 Poland

10.3.12.1 Poland Commercial Satellite Imaging Market Estimates and Forecasts, by Country (2021-2032) (USD Billion)

10.3.12.1 Poland Commercial Satellite Imaging Market Estimates and Forecasts, By Component (2021-2032) (USD Billion) 

10.3.12.3 Poland Commercial Satellite Imaging Market Estimates and Forecasts, By Application (2021-2032) (USD Billion)

10.3.12.3 Poland Commercial Satellite Imaging Market Estimates and Forecasts, By End-User (2021-2032) (USD Billion)

10.3.13 Turkey

10.3.13.1 Turkey Commercial Satellite Imaging Market Estimates and Forecasts, By Component (2021-2032) (USD Billion)

10.3.13.2 Turkey Commercial Satellite Imaging Market Estimates and Forecasts, By Application (2021-2032) (USD Billion)

10.3.13.3 Turkey Commercial Satellite Imaging Market Estimates and Forecasts, By End-User (2021-2032) (USD Billion)

10.3.14 Rest of Europe

10.3.14.1 Rest of Europe Commercial Satellite Imaging Market Estimates and Forecasts, By Component (2021-2032) (USD Billion)

10.3.14.2 Rest of Europe Commercial Satellite Imaging Market Estimates and Forecasts, By Application (2021-2032) (USD Billion)

10.3.14.3 Rest of Europe Commercial Satellite Imaging Market Estimates and Forecasts, By End-User (2021-2032) (USD Billion)

10.4 Asia-Pacific

10.4.1 Trends Analysis

  10.4.2 Asia-Pacific Commercial Satellite Imaging Market Estimates and Forecasts, by Country (2021-2032) (USD Billion)

 10.4.3 Asia-Pacific Commercial Satellite Imaging Market Estimates and Forecasts, By Component (2021-2032) (USD Billion) 

 10.4.4 Asia-Pacific Commercial Satellite Imaging Market Estimates and Forecasts, By Application (2021-2032) (USD Billion)

 10.4.5 Asia-Pacific Commercial Satellite Imaging Market Estimates and Forecasts, By End-User (2021-2032) (USD Billion)

10.4.6 China

10.4.6.1 China Commercial Satellite Imaging Market Estimates and Forecasts, By Component (2021-2032) (USD Billion)

10.4.6.2 China Commercial Satellite Imaging Market Estimates and Forecasts, By Application (2021-2032) (USD Billion)

10.4.6.3 China Commercial Satellite Imaging Market Estimates and Forecasts, By End-User (2021-2032) (USD Billion)

10.4.7 India

10.4.7.1 India Commercial Satellite Imaging Market Estimates and Forecasts, By Component (2021-2032) (USD Billion)

10.4.7.2 India Commercial Satellite Imaging Market Estimates and Forecasts, By Application (2021-2032) (USD Billion)

10.4.7.3 India Commercial Satellite Imaging Market Estimates and Forecasts, By End-User (2021-2032) (USD Billion)

10.4.8 Japan

10.4.8.1 Japan Commercial Satellite Imaging Market Estimates and Forecasts, By Component (2021-2032) (USD Billion)

10.4.8.2 Japan Commercial Satellite Imaging Market Estimates and Forecasts, By Application (2021-2032) (USD Billion)

10.4.8.3 Japan Commercial Satellite Imaging Market Estimates and Forecasts, By End-User (2021-2032) (USD Billion)

10.4.9 South Korea

10.4.9.1 South Korea Commercial Satellite Imaging Market Estimates and Forecasts, By Component (2021-2032) (USD Billion)

10.4.9.2 South Korea Commercial Satellite Imaging Market Estimates and Forecasts, By Application (2021-2032) (USD Billion)

10.4.9.3 South Korea Commercial Satellite Imaging Market Estimates and Forecasts, By End-User (2021-2032) (USD Billion)

10.4.10 Singapore

10.4.10.1 Singapore Commercial Satellite Imaging Market Estimates and Forecasts, By Component (2021-2032) (USD Billion)

10.4.10.2 Singapore Commercial Satellite Imaging Market Estimates and Forecasts, By Application (2021-2032) (USD Billion)

10.4.10.3 Singapore Commercial Satellite Imaging Market Estimates and Forecasts, By End-User (2021-2032) (USD Billion)

10.4.11 Australia

10.4.11.1 Australia Commercial Satellite Imaging Market Estimates and Forecasts, By Component (2021-2032) (USD Billion)

10.4.11.2 Australia Commercial Satellite Imaging Market Estimates and Forecasts, By Application (2021-2032) (USD Billion)

10.4.11.3 Australia Commercial Satellite Imaging Market Estimates and Forecasts, By End-User (2021-2032) (USD Billion)

10.4.12 Rest of Asia-Pacific

10.4.12.1 Rest of Asia-Pacific Commercial Satellite Imaging Market Estimates and Forecasts, By Component (2021-2032) (USD Billion)

10.4.12.2 Rest of Asia-Pacific Commercial Satellite Imaging Market Estimates and Forecasts, By Application (2021-2032) (USD Billion)

10.4.12.3 Rest of Asia-Pacific Commercial Satellite Imaging Market Estimates and Forecasts, By End-User (2021-2032) (USD Billion)

10.5 Middle East and Africa

10.5.1 Trends Analysis

10.5.2 Middle East and Africa East Commercial Satellite Imaging Market Estimates and Forecasts, by Country (2021-2032) (USD Billion)

10.5.3Middle East and Africa Commercial Satellite Imaging Market Estimates and Forecasts, By Component (2021-2032) (USD Billion) 

10.5.4 Middle East and Africa Commercial Satellite Imaging Market Estimates and Forecasts, By Application (2021-2032) (USD Billion)

10.5.5 Middle East and Africa Commercial Satellite Imaging Market Estimates and Forecasts, By End-User (2021-2032) (USD Billion)

10.5.6 UAE

10.5.6.1 UAE Commercial Satellite Imaging Market Estimates and Forecasts, By Component (2021-2032) (USD Billion)

10.5.6.2 UAE Commercial Satellite Imaging Market Estimates and Forecasts, By Application (2021-2032) (USD Billion)

10.5.6.3 UAE Commercial Satellite Imaging Market Estimates and Forecasts, By End-User (2021-2032) (USD Billion)

10.5.7 Saudi Arabia

10.5.7.1 Saudi Arabia Commercial Satellite Imaging Market Estimates and Forecasts, By Component (2021-2032) (USD Billion)

10.5.7.2 Saudi Arabia Commercial Satellite Imaging Market Estimates and Forecasts, By Application (2021-2032) (USD Billion)

10.5.7.3 Saudi Arabia Commercial Satellite Imaging Market Estimates and Forecasts, By End-User (2021-2032) (USD Billion)

10.5.8 Qatar

10.5.8.1 Qatar Commercial Satellite Imaging Market Estimates and Forecasts, By Component (2021-2032) (USD Billion)

10.5.8.2 Qatar Commercial Satellite Imaging Market Estimates and Forecasts, By Application (2021-2032) (USD Billion)

10.5.8.3 Qatar Commercial Satellite Imaging Market Estimates and Forecasts, By End-User (2021-2032) (USD Billion)

10.5.9 South Africa

10.5.9 1 South Africa Commercial Satellite Imaging Market Estimates and Forecasts, By Component (2021-2032) (USD Billion)

10.5.9 2 South Africa Commercial Satellite Imaging Market Estimates and Forecasts By Application (2021-2032) (USD Billion)

10.5.9 3 South Africa Commercial Satellite Imaging Market Estimates and Forecasts, By End-User (2021-2032) (USD Billion)

10.5.10 Rest of Middle East & Africa

10.5.10.1 Rest of Middle East & Africa Commercial Satellite Imaging Market Estimates and Forecasts, By Component (2021-2032) (USD Billion)

10.5.10.2 Rest of Middle East & Africa Commercial Satellite Imaging Market Estimates and Forecasts, By Application (2021-2032) (USD Billion)

10.5.10.3 Rest of Middle East & Africa Commercial Satellite Imaging Market Estimates and Forecasts, By End-User (2021-2032) (USD Billion)

10.6 Latin America

10.6.1 Trends Analysis

10.6.2 Latin America Commercial Satellite Imaging Market Estimates and Forecasts, by Country (2021-2032) (USD Billion)

10.6.3 Latin America Commercial Satellite Imaging Market Estimates and Forecasts, By Component (2021-2032) (USD Billion) 

10.6.4 Latin America Commercial Satellite Imaging Market Estimates and Forecasts, By Application (2021-2032) (USD Billion)

10.6.5 Latin America Commercial Satellite Imaging Market Estimates and Forecasts, By End-User (2021-2032) (USD Billion)

10.6.6 Brazil

10.6.6.1 Brazil Commercial Satellite Imaging Market Estimates and Forecasts, By Component (2021-2032) (USD Billion)

10.6.6.2 Brazil Commercial Satellite Imaging Market Estimates and Forecasts, By Application (2021-2032) (USD Billion)

10.6.6.3 Brazil Commercial Satellite Imaging Market Estimates and Forecasts, By End-User (2021-2032) (USD Billion)

10.6.7 Argentina

10.6.7.1 Argentina Commercial Satellite Imaging Market Estimates and Forecasts, By Component (2021-2032) (USD Billion)

10.6.7.2 Argentina Commercial Satellite Imaging Market Estimates and Forecasts, By Application (2021-2032) (USD Billion)

10.6.7.3 Argentina Commercial Satellite Imaging Market Estimates and Forecasts, By End-User (2021-2032) (USD Billion)

10.6.8 Rest of Latin America

10.6.8.1 Rest of Latin America Commercial Satellite Imaging Market Estimates and Forecasts, By Component (2021-2032) (USD Billion)

10.6.8.2 Rest of Latin America Commercial Satellite Imaging Market Estimates and Forecasts, By Application (2021-2032) (USD Billion)

10.6.8.3 Rest of Latin America Commercial Satellite Imaging Market Estimates and Forecasts, By End-User (2021-2032) (USD Billion)

12. Company Profiles

12.1 Maxar Technologies

          12.1.1 Company Overview

12.1.2 Financial

12.1.3 Products/ Services Offered

12.1.4 SWOT Analysis

12.2 Airbus Defence and Space

           12.2.1 Company Overview

12.2.2 Financial

12.2.3 Products/ Services Offered

12.2.4 SWOT Analysis

12.3 Planet Labs PBC

          12.3.1 Company Overview

12.3.2 Financial

12.3.3 Products/ Services Offered

12.3.4 SWOT Analysis

12.4 BlackSky Global

          12.4.1 Company Overview

12.4.2 Financial

12.4.3 Products/ Services Offered

12.4.4 SWOT Analysis

12.5 ICEYE

          12.5.1 Company Overview

12.5.2 Financial

12.5.3 Products/ Services Offered

12.5.4 SWOT Analysis

12.6 ImageSat International

            12.6.1 Company Overview

12.6.2 Financial

12.6.3 Products/ Services Offered

12.6.4 SWOT Analysis

12.7  L3Harris Technologies

          12.7.1 Company Overview

12.7.2 Financial

12.7.3 Products/ Services Offered

12.7.4 SWOT Analysis

12.8 Satellogic

            12.8.1 Company Overview

12.8.2 Financial

12.8.3 Products/ Services Offered

12.8.4 SWOT Analysis

12.9 Capella Space

           12.9.1 Company Overview

12.9.2 Financial

12.9.3 Products/ Services Offered

12.9.4 SWOT Analysis

12.10 GeoIQ.io

            12.10.1 Company Overview

12.10.2 Financial

12.10.3 Products/ Services Offered

12.10.4 SWOT Analysi

12. Use Cases and Best Practices

13. Conclusion

An accurate research report requires proper strategizing as well as implementation. There are multiple factors involved in the completion of good and accurate research report and selecting the best methodology to compete the research is the toughest part. Since the research reports we provide play a crucial role in any company’s decision-making process, therefore we at SNS Insider always believe that we should choose the best method which gives us results closer to reality. This allows us to reach at a stage wherein we can provide our clients best and accurate investment to output ratio.

Each report that we prepare takes a timeframe of 350-400 business hours for production. Starting from the selection of titles through a couple of in-depth brain storming session to the final QC process before uploading our titles on our website we dedicate around 350 working hours. The titles are selected based on their current market cap and the foreseen CAGR and growth.


The 5 steps process:

Step 1: Secondary Research:

Secondary Research or Desk Research is as the name suggests is a research process wherein, we collect data through the readily available information. In this process we use various paid and unpaid databases which our team has access to and gather data through the same. This includes examining of listed companies’ annual reports, Journals, SEC filling etc. Apart from this our team has access to various associations across the globe across different industries. Lastly, we have exchange relationships with various university as well as individual libraries.

Secondary Research

Step 2: Primary Research

When we talk about primary research, it is a type of study in which the researchers collect relevant data samples directly, rather than relying on previously collected data.  This type of research is focused on gaining content specific facts that can be sued to solve specific problems. Since the collected data is fresh and first hand therefore it makes the study more accurate and genuine.

We at SNS Insider have divided Primary Research into 2 parts.

Part 1 wherein we interview the KOLs of major players as well as the upcoming ones across various geographic regions. This allows us to have their view over the market scenario and acts as an important tool to come closer to the accurate market numbers. As many as 45 paid and unpaid primary interviews are taken from both the demand and supply side of the industry to make sure we land at an accurate judgement and analysis of the market.

This step involves the triangulation of data wherein our team analyses the interview transcripts, online survey responses and observation of on filed participants. The below mentioned chart should give a better understanding of the part 1 of the primary interview.

Primary Research

Part 2: In this part of primary research the data collected via secondary research and the part 1 of the primary research is validated with the interviews from individual consultants and subject matter experts.

Consultants are those set of people who have at least 12 years of experience and expertise within the industry whereas Subject Matter Experts are those with at least 15 years of experience behind their back within the same space. The data with the help of two main processes i.e., FGDs (Focused Group Discussions) and IDs (Individual Discussions). This gives us a 3rd party nonbiased primary view of the market scenario making it a more dependable one while collation of the data pointers.

Step 3: Data Bank Validation

Once all the information is collected via primary and secondary sources, we run that information for data validation. At our intelligence centre our research heads track a lot of information related to the market which includes the quarterly reports, the daily stock prices, and other relevant information. Our data bank server gets updated every fortnight and that is how the information which we collected using our primary and secondary information is revalidated in real time.

Data Bank Validation

Step 4: QA/QC Process

After all the data collection and validation our team does a final level of quality check and quality assurance to get rid of any unwanted or undesired mistakes. This might include but not limited to getting rid of the any typos, duplication of numbers or missing of any important information. The people involved in this process include technical content writers, research heads and graphics people. Once this process is completed the title gets uploader on our platform for our clients to read it.

Step 5: Final QC/QA Process:

This is the last process and comes when the client has ordered the study. In this process a final QA/QC is done before the study is emailed to the client. Since we believe in giving our clients a good experience of our research studies, therefore, to make sure that we do not lack at our end in any way humanly possible we do a final round of quality check and then dispatch the study to the client.

Key Segments:

By  Component

  • Hardware

  • Software

  • Services

By Application

  • Geospatial Data Acquisition & Mapping

  • Urban Planning & Development

  • Disaster Management

  • Energy & Natural Resource Management

  • Surveillance & Security

  • Defense & Intelligence

  • Other

By End-User

  • Government

  • Military & Defense

  • Forestry and Agriculture

  • Energy

  • Civil Engineering and Archaeology

  • Transportation and Logistics

  • Others

Request for Segment Customization as per your Business Requirement: Segment Customization Request

Regional Coverage: 

North America

  • US

  • Canada

  • Mexico

Europe

  • Germany

  • France

  • UK

  • Italy

  • Spain

  • Poland

  • Turkey

  • Rest of Europe

Asia Pacific

  • China

  • India

  • Japan

  • South Korea

  • Singapore

  • Australia

  • Rest of Asia Pacific

Middle East & Africa

  • UAE

  • Saudi Arabia

  • Qatar

  • South Africa

  • Rest of Middle East & Africa

Latin America

  • Brazil

  • Argentina

  • Rest of Latin America

Request for Country Level Research Report: Country Level Customization Request

Available Customization 

With the given market data, SNS Insider offers customization as per the company’s specific needs. The following customization options are available for the report: 

  • Detailed Volume Analysis 

  • Criss-Cross segment analysis (e.g. Component X Application) 

  • Competitive Component Benchmarking 

  • Geographic Analysis 

  • Additional countries in any of the regions 

  • Customized Data Representation 

  • Detailed analysis and profiling of additional market players


Explore Key Insights.


  • Analyzes market trends, forecasts, and regional dynamics
  • Covers core offerings, innovations, and industry use cases
  • Profiles major players, value chains, and strategic developments
  • Highlights innovation trends, regulatory impacts, and growth opportunities
Request an Analyst Call