Computational Creativity Market Report Scope & Overview:
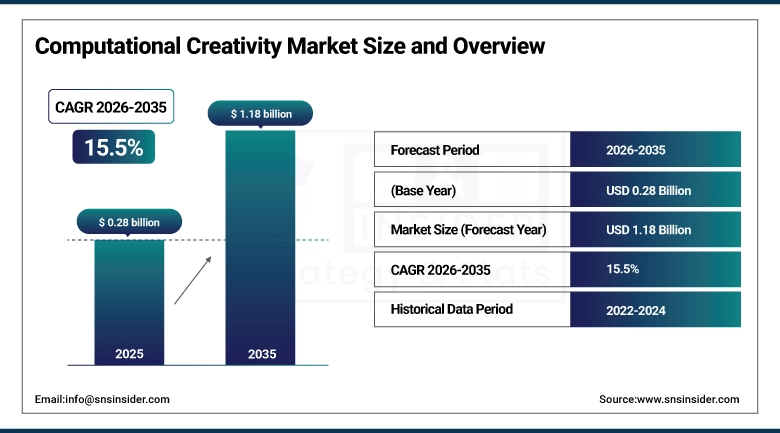
The Computational Creativity Market size was valued at USD 0.28 billion in 2025 and is expected to reach USD 1.18 billion by 2035, growing at a CAGR of 15.5 % over the forecast period of 2026-2035.
Market growth is being seen rapidly due to the development of artificial intelligence, which has progressed from mere data processing to becoming a collaborative partner actively engaged in the creative process in industries like marketing, gaming, media, design, and entertainment. Computational creativity technologies are making machines capable of developing their creative results independently without any human involvement. Machines can create text, music, digital art, products, videos, and interactive content by means of AI models.
The main technologies facilitating market growth include natural language processing, machine learning/deep learning, and computer vision. The growing preference for generative AI systems, diffusion models, and language models is making rapid progress possible in the area of automation of content and creative generation. Businesses use computational creativity software to accelerate the innovation process, reduce production costs, and provide a personal experience. It is expected that increasing adoption of creative content using AI will contribute to market growth over the forecast period of 2035.
One must take into consideration the fact that based on the latest statistics, up to 52% of American enterprises already apply AI tools for the purpose of creating various types of content and engaging in creative endeavours; in addition to this, services such as Adobe Firefly and Magic Studio by Canva have a combined number of hundreds of millions of users worldwide.
Computational Creativity Market Size and Forecast
-
Market Size in 2025: USD 0.28 Billion
-
Market Size by 2035: USD 1.18 Billion
-
CAGR: 15.5% from 2026 to 2035
-
Base Year: 2025
-
Forecast Period: 2026–2035
-
Historical Data: 2022–2024
To Get more information on Computational Creativity Market - Request Free Sample Report
Computational Creativity Market Trends
-
Rapid mainstreaming of generative AI tools across enterprise marketing, advertising, and media workflows, enabling brands to produce high-volume, personalized content at a fraction of traditional production timelines and costs.
-
Growing integration of large language models (LLMs) and multimodal AI systems in product design workflows, enabling real-time ideation, rapid prototyping, and AI-assisted aesthetic refinement across automotive, consumer electronics, and fashion sectors.
-
The expansion of AI-composition music services in commercial licenses, movie scores, and video game soundtracks where companies such as AIVA and Amper Music have created systems which allow for royalty-free audio assets generated by an AI.
-
The growth in investment within enterprises in the use of computational creativity APIs and SDKs that would allow them to integrate AI creativity into their existing digital products and platforms.
-
The use of AI creativity tools in e-commerce and retail, including the use of AI-created product imagery, ad creatives, and visual merchandising solutions.
-
Development of responsible and explainable AI architectures for computational creativity concerning copyright issues, deepfake technologies, and verifying the authenticity of the work amid increasing regulatory oversight of AI-generated content around the world.
-
Increasing need for AI-based systems to support the production of games where procedural content generation is used, making the process of creating a game much quicker.
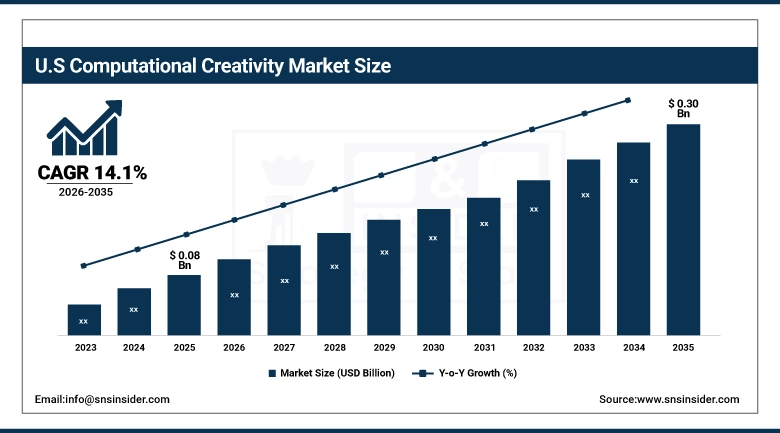
U.S. Computational Creativity Market was valued at USD 0.08 billion in 2025 and is expected to reach USD 0.30 billion by 2035, registering a CAGR of 14.1% during 2026–2035.
The market was valued at USD 0.28 billion in 2025 and forecasted to reach USD 1.18 billion by 2035, growing at a CAGR of 15.5% from 2026 to 2035. It is gaining momentum due to the use of artificial intelligence for creative processes in sectors such as marketing, gaming, entertainment, product development, and digital media. The use of computational creativity technology allows artificial intelligence to produce creative outcomes such as text, music, graphics, videos, and designs with low human involvement. Natural language processing, machine learning and deep learning, and computer vision are some of the key technologies contributing to market expansion. Increasing demand for generative artificial intelligence platforms and large language models has boosted the automation of content creation and personalization of user experience. Enterprises are leveraging computational creativity solutions for faster innovation, improved creative workflow, cost-effective content generation, and better digital engagement.
Computational Creativity Market Segment Insights
-
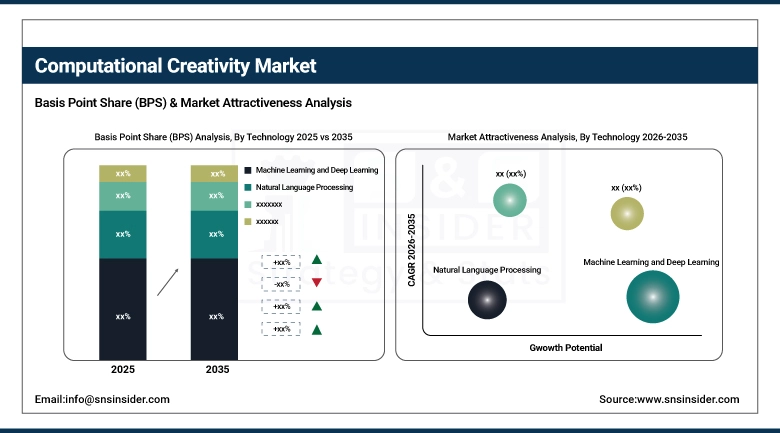
Based on Technology, Machine Learning and Deep Learning accounted for the largest market share (~41.8%) in 2025; Computer Vision expected to be the fastest-growing segment (CAGR of 23.7%).
-
Based on Component, Solutions accounted for the largest market share (~68.5%) in 2025; Services expected to be the fastest-growing segment (CAGR of 17.9%).
-
Based on Application, Marketing & Web Designing accounted for the largest market share (~32.4%) in 2025; Product Designing expected to be the fastest-growing segment (CAGR of 18.0%).
Computational Creativity Market Segment Analysis
By Technology, Machine Learning & Deep Learning dominates, Computer Vision expected to grow fastest
Machine Learning & Deep Learning led the Computational Creativity Market in 2025 owing to their key importance in powering generative AI models in various domains including text, images, audio, and video applications. Rapid adoption among businesses for automated content generation, optimization of marketing efforts, product design, and digital media production is likely to fuel the demand for machine learning and deep learning solutions in the upcoming years. Scalability, efficiency, and potential for innovation add to the growing popularity of ML and DL, thus driving the market towards leaders. Computer Vision is forecasted to grow at the fastest pace over 2026–2035 due to higher usage of AR/VR technology, AI-based editing tools, and automated visual content generators. Growing demand for interactive games, architectural visualizations, automated design, and real-time video editing is boosting the use of computer vision solutions.
By Component, Solutions dominates, Services expected to grow fastest
The Solutions category emerged as the market leader for the Computational Creativity Market in 2025 owing to the extensive usage of AI-enabled creative software, content generation, and automation solutions by organizations and consumers. The adoption of subscription models, continual upgrading of AI capabilities, and the rising use of AI content generation solutions in digital processes will drive segment growth. The continued use of AI-based creative tools within industries such as media, advertising, gaming, and design fuels the growth of the market. Among all segments, the Services category will be the fastest-growing segment between 2026 and 2035. As the use of computational creativity solutions is growing among enterprises, there is an increasing need for consultancies, systems integration, AI model development, governance guidance, and managed services.
By Application, Marketing & Web Designing dominates, Product Designing expected to grow fastest
The leading applications segments in the Computational Creativity Market were Marketing & Web Designing in 2025 because of high demands for custom digital content, creation of automated ads, and customer engagement systems powered by AI. The incorporation of generative AI in popular marketing software applications is also contributing to their increased usage among businesses of all sizes. The highest revenue growth will be observed by the Product Designing application segment from 2026 to 2035 because of the increasing use of AI-based generative designs and rapid prototyping technologies. Businesses operating in the automobile, aerospace, fashion, and consumer electronics industries have been utilizing computational creativity software to optimize product aesthetics, engineering processes, and minimize waste materials.
Computational Creativity Market Regional Analysis
|
Region |
Major Country |
Share within Region (%) |
|---|---|---|
|
North America |
United States |
40% |
|
Europe |
United Kingdom |
28% |
|
Asia Pacific |
China |
35% |
|
Middle East & Africa |
UAE |
29% |
|
Latin America |
Brazil |
44% |
North America Computational Creativity Market Insights
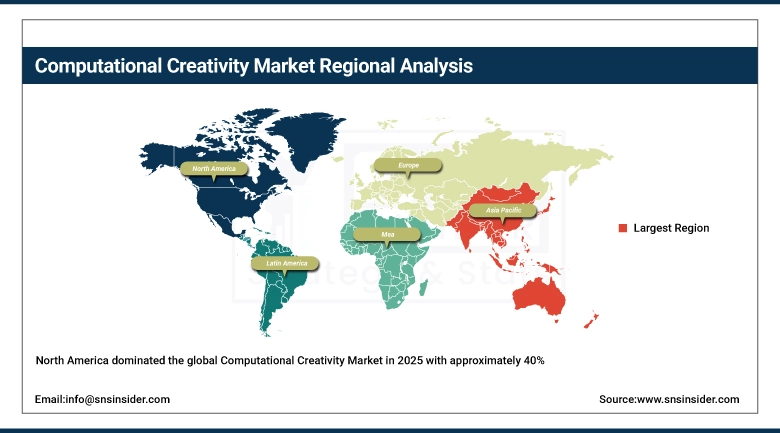
North America dominated the global Computational Creativity Market in 2025 with approximately 40% of global market revenue. The United States is home to the developers of the world’s most widely adopted computational creativity platforms — including Adobe Firefly, Microsoft Copilot, Google Gemini, AWS Bedrock, and Autodesk generative design tools — which collectively generate the majority of global computational creativity revenue. Canada contributes meaningfully to regional leadership through its world-class AI research institutions in Montreal, Toronto, and Edmonton, along with a growing cluster of applied AI companies in the creative and gaming sectors.
Get Customized Report as per Your Business Requirement - Enquiry Now
Asia Pacific Computational Creativity Market Insights
The Asia Pacific region is forecasted to grow at the highest CAGR of approximately 18.3% throughout the forecast period from 2026 to 2035. This exceptional growth trajectory is driven by aggressive government-backed AI investment programs in China, Japan, South Korea, and India; the world’s fastest-growing digital media and gaming markets; and the rapid deployment of computational creativity tools by a new generation of Asia-based technology companies. China’s domestic AI ecosystem — anchored by Baidu, Alibaba, Tencent, and ByteDance — is developing and deploying computational creativity platforms at scale across e-commerce, short-form video, live commerce, and digital advertising. South Korea’s entertainment and gaming sectors are integrating AI creative tools at an accelerating pace, while India’s rapidly expanding digital marketing and content creation industry is emerging as a major adopter of AI-powered creative automation platforms.
Europe Computational Creativity Market Insights
During 2025, Europe remained one of the significant markets in the Computational Creativity Market across the globe, with the United Kingdom, Germany, France, and the Netherlands being the key regions of demand. The United Kingdom has become the leader in the application of computational creativity in Europe because of the active development of the start-up community working on artificial intelligence in London, the advanced AI research carried out in cooperation between academia and industry players in Oxford, Cambridge, and Imperial Colleges, and the presence of a number of creative industries including advertising, music, gaming, fashion, and film. At the same time, the EU AI Act, the world's first comprehensive regulation of artificial intelligence, is affecting the implementation of computational creativity solutions in Europe, creating demand for responsible AI and content generation in compliance with copyright requirements.
Middle East & Africa and Latin America Computational Creativity Market Insights
The Middle East & Africa and Latin America regions represent high-growth emerging markets for this industry. In the Middle East, the UAE and Saudi Arabia are actively deploying AI-powered creative tools as part of their broader smart city, digital economy, and creative industry diversification initiatives under Vision 2030 and UAE Centennial 2071 programs. Latin America’s market is led by Brazil, which accounts for approximately 44% of regional revenue, supported by one of the world’s most active social media consumption cultures, a growing technology startup ecosystem, and increasing enterprise investment in AI-powered marketing and content creation tools in the retail, financial services, and media sectors.
Computational Creativity Market Growth Drivers:
Rising integration of AI-powered creative tools across advertising, gaming, and digital content development sectors fuelling broad-based market expansion
The factors contributing to the growth of the Computational Creativity Market include the growing use of AI-based creative applications in sectors like advertising, gaming, entertainment, digital media, and social media platforms. The rising need for story generation, automated video editing, intelligent design software, and procedurally generated game levels is adding to the growth of the market.
The growing popularity of the creator economy on various platforms, including YouTube, TikTok, Instagram, and podcasting, is also driving up the demand for scalable AI-based content creation tools. Developments in generative AI technology, machine learning, and cloud computing technology are making computational creativity tools easier to adopt for businesses, creators, and digital content producers worldwide.
Computational Creativity Market Restraints
Copyright ambiguity, ethical concerns, and evolving regulatory frameworks around AI-generated content creating uncertainty for commercial deployment and adoption
One of the primary constraints on the growth of the Computational Creativity Market is the escalating issue of regulation due to the emerging legal and ethical issues relating to AI content creation. The legal issues relating to copyright infringement, the use of training data that has copyrights, and the implications on intellectual property are proving to be significant barriers for companies using such solutions. With several cases being fought by artists, publishing companies, musicians, and content creators against the use of their copyrighted material without permission, concerns are mounting about how AI outputs may be used in a business context.
Moreover, the issue of deepfakes, misinformation, lack of authenticity, and job displacement of humans due to AI are some of the major concerns affecting businesses in this space.
Computational Creativity Market Opportunities
Generative AI platform expansion into enterprise workflows, education, and industrial design unlocking multi-billion-dollar addressable markets through 2035
An important area where there exists an opportunity for the Computational Creativity Market would be in the increasing use of the technology within enterprise-level workflows and new-age digital ecosystems. Sectors like automotive, aerospace, consumer electronics, manufacturing and more are beginning to integrate these systems to enable accelerated design of products, optimization in engineering design, and minimize material wastage. Education, on the other hand, holds great potential within the market by way of leveraging AI-based content creation, assessments, and curricular tools in schools and universities, as well as corporate settings.
Moreover, the growing creator economy in the world opens up a lot of scope for low-cost, accessible AI computational creativity solutions which help individual creators design their professional quality content, including text, audio, images, and videos with relative ease.
Recent Developments:
-
2026: Adobe unveiled Project Concept, a next-generation generative AI design environment deeply integrated with Adobe Firefly and Creative Cloud, enabling end-to-end AI-assisted product ideation, brand identity development, and marketing campaign creation within a unified creative workspace, marking a milestone in enterprise computational creativity platform integration.
-
2025 (March): Microsoft expanded its Copilot AI integration across Microsoft 365, adding advanced generative image creation, presentation design automation, and AI-powered video editing capabilities to its suite of over 400 million commercial users, representing one of the largest single deployments of computational creativity technology in history.
-
2025 (January): Google launched its Gemini Ultra multimodal AI capabilities within Google Workspace, enabling AI-assisted content creation, automated slide design, and generative image generation directly within Docs, Slides, and Gmail — significantly expanding computational creativity adoption among enterprise and SMB users globally.
Computational Creativity Market Key Players
Some of the Computational Creativity Market Companies are:
-
IBM
-
Google
-
Microsoft
-
Adobe
-
Amazon Web Services
-
Autodesk
-
Canva
-
AIVA Technologies
-
Amper Music
-
Jukedeck
-
OpenAI
-
Stability AI
-
Midjourney
-
Runway ML
-
Synthesia
-
ElevenLabs
-
Jasper AI
-
Copy.ai
-
Cohere
-
Anthropic
Computational Creativity Market Report Scope:
| Report Attributes | Details |
|---|---|
| Market Size in 2025 | USD 0.28 Billion |
| Market Size by 2035 | USD 1.18 Billion |
| CAGR | CAGR of 15.5% From 2026 to 2035 |
| Base Year | 2025 |
| Forecast Period | 2026-2035 |
| Historical Data | 2022-2024 |
| Report Scope & Coverage | Market Size, Segments Analysis, Competitive Landscape, Regional Analysis, DROC & SWOT Analysis, Forecast Outlook |
| Key Segments | • By Technology (Natural Language Processing, Machine Learning and Deep Learning, Computer Vision) • By Component (Solutions, Services) • By Application (Marketing & Web Designing, Product Designing, Music Composition, Photography and Videography, High-End Video Gaming Development) |
| Regional Analysis/Coverage | North America (US, Canada), Europe (Germany, UK, France, Italy, Spain, Russia, Poland, Rest of Europe), Asia Pacific (China, India, Japan, South Korea, Australia, ASEAN Countries, Rest of Asia Pacific), Middle East & Africa (UAE, Saudi Arabia, Qatar, South Africa, Rest of Middle East & Africa), Latin America (Brazil, Argentina, Mexico, Colombia, Rest of Latin America). |
| Company Profiles | IBM, Google, Microsoft, Adobe, Amazon Web Services, Autodesk, Canva, AIVA Technologies, Amper Music, Jukedeck, OpenAI, Stability AI, Midjourney, Runway ML, Synthesia, ElevenLabs, Jasper AI, Copy.ai, Cohere, Anthropic |
Frequently Asked Questions
North America dominated the Computational Creativity Market in 2025, accounting for approximately 40% of global market revenue.
The Solutions segment dominated the Computational Creativity Market in 2025 with approximately 68.5% revenue share.
The Machine Learning and Deep Learning segment dominated the Computational Creativity Market in 2025, accounting for approximately 41.8% of global revenue.
The rising integration of AI-powered creative tools across advertising, gaming, digital content development, and enterprise product design is the primary driver.
The Computational Creativity Market was valued at USD 0.28 billion in 2025.
The Computational Creativity Market is expected to grow at a CAGR of 15.5% from 2026 to 2035.
Get in Touch
