Consumer Robotics Market Size Analysis:
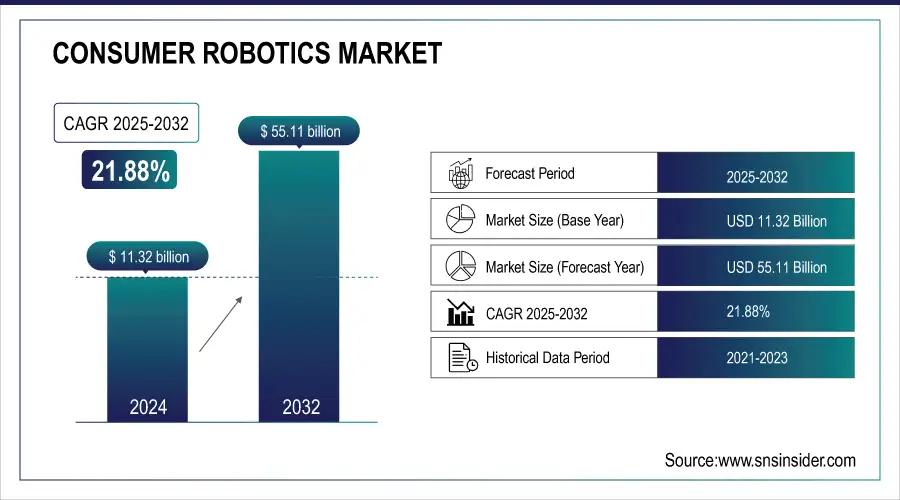
The Consumer Robotics Market size was valued at USD 13.79 Billion in 2025E and is projected to reach USD 67.18 Billion by 2033, at 21.88% CAGR.
The consumer robotics market is applying the quickly growing applied sciences of synthetic intelligence, automation and device studying. This progress enabled engineers to develop quicker, smarter, more intuitive and multifunctional robots, expanding their possible use in households, healthcare, elder care, entertainment, logistics, and many more sectors. Now, due to their ability to lower adoption barriers and expand reach, manufacturers are concentrating on modular, flexible and open AI-powered solutions, which are driving demand for consumer robotics. More importantly, as these technologies mature and consumer robotics becomes an ordinary way of living, they will become a part of the daily life, both in the way a person lives, but also executes day to day work that interacts with the environment.
ABB's recent expansion in Chinese operations, with AI-driven robots and locally manufactured threads to meet the booming demand in electronics, healthcare, and logistics. ABB sees opportunity to capture the next wave of industrial innovation and smart manufacturing by tapping into the dynamic AI ecosystem in China and its growing automation demands.
To Get more information on Consumer Robotics Market - Request Free Sample Report
Market Size and Forecast: 2025E
-
Market Size in 2025E USD 13.79 Billion
-
Market Size by 2033 USD 67.18 Billion
-
CAGR of 21.88% From 2026 to 2033
-
Base Year 2025E
-
Forecast Period 2026-2033
-
Historical Data 2021-2024
Consumer Robotics Market Trends:
-
Rapid digital innovation and AI-driven automation are driving growth across high-tech sectors, from healthcare to logistics and consumer electronics.
-
Market reforms and regulatory harmonization are facilitating seamless operations, supply chain localization, and increased foreign direct investment.
-
China is emerging as a global innovation hub, attracting significant FDI in robotics, digital transformation, and integrated technology development.
-
Rising urban delivery demands and labor shortages are accelerating adoption of autonomous last-mile delivery robots.
-
Technological advancements, smart city initiatives, and consumer preference for rapid, touchless solutions are expanding the market for AI-powered robotic delivery systems.
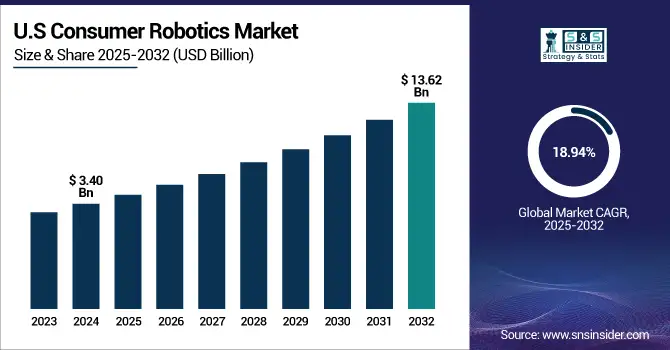
The U.S consumer robotics market size was valued at USD 3.40 Billion in 2025E and is projected to reach USD 13.62 Billion by 2033, growing at a CAGR of 18.94% during 2026-2033. This consumer robotics market growth is driven by increasing adoption of smart home technologies, rapid advancements in AI and automation, and rising demand for convenience and personal assistance. From household cleaning and healthcare assistance to entertainment, applications are expanding as manufacturers keep introducing user-friendly, multifunctional robots that respond to changing lifestyles and consumer needs.
Consumer Robotics Market Trends include the growing integration of artificial intelligence (AI), natural language processing, and autonomous navigation systems, enabling robots to operate with minimal human input. The increased popularity of such integrated robots, capable of cleaning, security functions and providing entertainment all in a one package. One of the most common trends heading toward the integration of smart home ecosystems are the features of increased compatibility and control through mobile apps and voice assistants. In tandem with these consumer shifts, the rise of health and wellness robotics (for elderly care, and personal mobility) has also been increasingly emphasized. These trends show that consumers are moving toward more intelligent, connected, and easier to use robotic solutions.
Consumer Robotics Market Growth Drivers:
-
Rapid Innovation and Unified Market Reforms Fuel High-Tech Investment Surge
The rapid digital innovation drive coupled with structural reforms for a common national market is one of the main factors behind the growth of the high-tech market. Together, these changes have fostered an environment conducive to cutting-edge manufacturing, AI-driven automation, and tailored solutions. Referring to the backbone of smart technologies spreading sectors by sectors from healthcare to logistics to consumer goods to electronics and enhancing productivity and efficiency with increased capital flows toward them. Regulatory framework harmonization and localization of supply chains also help to ensure seamless and low-cost operations. Consequently, the high-tech sector is experiencing a massive influx of foreign direct investment as enterprises are set to benefit from the growth opportunities thanks to the infrastructural improvements and the significant demand for smart, sustainable, and adaptable technologies.
Foreign companies raise investment in China high-tech areas, with total FDI 109.04 billion yuan (USD 14.96 billion) by the period of January to May 2025. China is emerging as the global innovation center through AI-driven robotics, digital transformation, and integrated market development.
Consumer Robotics Market Restraints:
-
High Costs, Privacy Concerns, and Tech Limitations Restrict Consumer Robotics Market Growth
The consumer robotics market faces several restraints that could hinder its widespread adoption and growth. The high up-front product and maintenance costs continue to be a significant challenge, particularly in markets that are sensitive to pricing. As smart home robots collect sensitive user information, data privacy and cybersecurity, concern is on the rise. Low battery use and lengthy recharging times affect both operational efficiency and convenience. When a non-tech-savvy user tries to use a product, complex interfaces and non-intuitive controls frustrate the customer causing them to be less satisfied and more likely to return the product. Inconsistent operation of AI-based capabilities including navigation and voice recognition further erodes trust in automation. Other challenges include supply chain disruptions and limited access to skilled labor for maintenance and repair. All of these factors reduce the rate of adoption around the globally.
Consumer Robotics Market Opportunities:
-
Rising Urban Delivery Demands Drive Growth in Autonomous Robotics Solutions
The increasing burden on urban logistics because of labor shortages and higher requirements for delivery is generating a significant potential market for autonomous last-mile delivery space. Autonomous sidewalk robots are an effective, scalable, and low-cost solution to fill such gaps through innovative approaches to residential delivery, as ageing populations in urban cities limit the available workforce. Such AI-powered robots can navigate and avoid obstacles, so they can work for long periods while minimizing the reliance on human labor, which is something we need to ensure possible on time deliveries. Consumer demand for rapid, touch-less solutions has driven adoption for robotic solutions in food, retail and parcel delivery and the pace of acceleration is increasing. This shift is supported by ongoing technological advancements, smart city initiatives, and increasing acceptance of robotics in everyday urban infrastructure.
By February 20, 2024, Tokyo will witness the launch of autonomous robot deliveries via a partnership between Uber Eats, Cartken, and Mitsubishi Electric. This is Uber Eats' first international launch of robot delivery as Japan's aging population and dwindling workforce strain its logistics systems.
Consumer Robotics Market Segment Analysis:
By Level of Autonomy
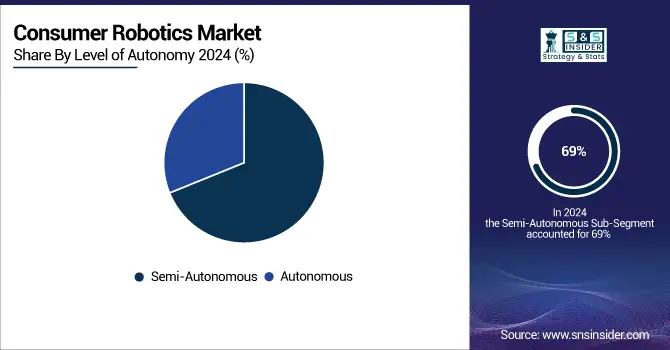
In 2025E, the Semi-Autonomous segment accounted for approximately 69% of the consumer robotics market share, driven by widespread adoption of cleaning robots, entertainment systems, and assistive devices that require limited human intervention. This dominance reflects consumer preference for smart yet user-controlled robotic solutions that balance functionality with affordability and ease of use. The Autonomous segment is expected to experience the fastest growth in consumer robotics market over 2026-2033 with a CAGR of 29.62%, due to improvement on AI, machine learning, and sensor technology, which allow to operate it fully autonomously. Rising popularity of hands-free and smart robotic suits over home assistance, security, and personal care, is the main driver fostering their rapid adoption. As autonomous robots become more appealing to tech-oriented consumers with improved functionality, real-time decision-making, and less reliance on human input.
By Product Type
In 2025E, the Cleaning Robots segment accounted for approximately 38% of the consumer robotics market share, fueled by considerable consumer interest in home automation solutions, such as robotic vacuum cleaners and floor scrubbing and washing robots. Today, it is used as a convenient time-saver and is becoming a need for households around the world because of its increasing affordability. The segment will maintain its strong hold on the market as it continues to innovate in areas such as navigation, and obstacle detection, along with smart home integration. The Social and Companion Robots segment is expected to experience the fastest growth in consumer robotics market over 2026-2033 with a CAGR of 30.46%, owing to increasing demand for emotionally intelligent robots to provide companionship, particularly for children and elderly. Growing awareness around mental wellness and an increasing interest in personalized care contribute to further driving adoption.
By Application
In 2025E, the Household Cleaning and Maintenance segment accounted for approximately 42% of the Consumer Robotics market share, driven by rising demand for robotic vacuum cleaners, mops, and lawn mowers across urban households. This growth is supported by increasing consumer preference for automated solutions that save time and reduce manual effort. Technological advancements such as AI-powered navigation, obstacle detection, and voice assistant integration have further enhanced product appeal. Additionally, the proliferation of smart home ecosystems and the growing availability of mid-range and budget-friendly cleaning robots are accelerating adoption, especially in developed and emerging economies. The Security and Surveillance which is projected to grow at the fastest rate of 30.62% throughout the forecast period from 2026-2033, driven by increasing concerns over home safety, rising crime rates, and demand for real-time monitoring. Integration of AI-powered facial recognition, motion detection, and remote access through smartphones is enhancing product functionality. Moreover, advancements in wireless connectivity, affordability of smart security robots, and growing adoption in smart homes are fueling market expansion. The segment also benefits from consumer demand for 24/7 autonomous surveillance solutions, especially in urban residential areas and gated communities across North America, Europe, and parts of Asia-Pacific.
By Distribution Channel
In 2025E, the Online Retail segment accounted for approximately 36% of the consumer robotics market share, emerging as the leading distribution channel. The Online Retail segment accounted for more than one-third in terms of revenue share of the global consumer robotics market in 2025E. The ease of online purchasing, the vast range of products, the fair price, and the booming trust toward online shopping are making it a dominant one. In fact, online retail is now one of the key accelerators for the adoption and sales of consumer robotics products, especially with the advent of digital marketplace and direct-to-consumer brand strategies. The Specialty Electronics Stores segment is expected to experience the fastest growth in Consumer Robotics market over 2026-2033 with a CAGR of 22.71% as consumers look for guidance and expert advice and major utility products in real life through hands-on demonstrations along with a good after-sales support. As robotics technology matures, buyers increasingly opt for in-store experiences that can proffer guidance, allowing specialty stores to gain traction as a trusted retail channel for higher-end consumer robotics.
Consumer Robotics Market Regional Analysis:
North America Consumer Robotics Market Insights
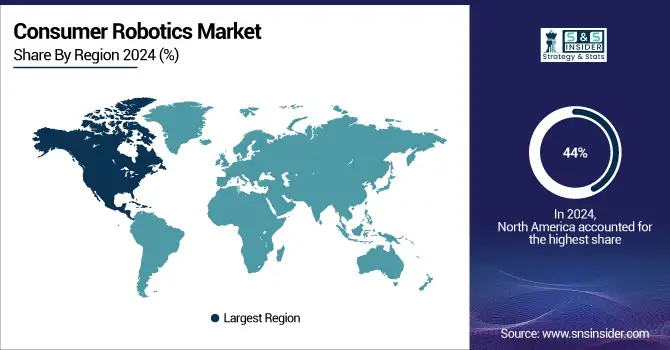
In 2025E, North America dominated the consumer robotics market and accounted for 44% of revenue share, driven by high consumer adoption of smart technologies, strong presence of key market players, and well-founded infrastructure supporting AI and IoT integration. The rise in demand for home automation, healthcare robotics, and advanced personal assistance devices across the region persists to propel the consumer robotics market growth and innovation across the region.
Get Customized Report as per Your Business Requirement - Enquiry Now
Asia Pacific Consumer Robotics Market Insights
Asia Pacific is expected to witness the fastest growth in the consumer robotics market over 2026-2033, with a projected CAGR of 23.78%. The rapid expansion is driven by surging demand for smart home convenience among consumers, increasing urbanization, and strong impetus for robotic innovation. Government policies, leveraged manufacturing ecosystems and high adoption rates are driving the region with China leading the overall market dominance.
Japan’s automotive industry installed 13,000 industrial robots in 2024, marking an 11% increase and the highest level since 2020.Driven by EV and hydrogen engine expansion, robot adoption is reshaping Japan’s car manufacturing and industrial automation landscape.
Europe Consumer Robotics Market Insights
In 2025E, Europe emerged as a promising region in the consumer robotics market, driven by increased adoption of smart home solutions and high levels of consumer interest in automation. Demand is driven mainly through major economies such as Germany, France, and the U.K. due to the increasing awareness coupled with the rising aging population, and funded investment in robotics R&D. With the increasing emphasis on sustainability and assistive technologies within the region, personal and household robotics applications have great growth potential.
Latin America (LATAM) and Middle East & Africa (MEA) Consumer Robotics Market Insights
LATAM and MEA are experiencing steady growth in the Consumer Robotics market, driven by as internet connectivity improves, the incomes of the middle-class rise, and the interest in home automation increases. Growing urbanization, rising smart technology awareness, and gradual infrastructure development are driving adoptive levels, especially of cleaning and personal assistant robots, across both region's emerging cities.
Consumer Robotics Market Key Players:
The key players in consumer robotics market are
- iRobot Corporation
- Roborock Technology Co., Ltd.
- Ecovacs Robotics Co., Ltd.
- DJI Technology Co., Ltd.
- Xiaomi Corporation
- Neato Robotics, Inc.
- LG Electronics Inc.
- Samsung Electronics Co., Ltd.
- Robert Bosch GmbH
- Maytronics Ltd.
- SharkNinja Operating LLC (Shark Robotics)
- Honda Motor Co., Ltd.
- 3D Robotics, Inc.
- Dyson Ltd.
- Panasonic Corporation
- Toshiba Corporation
- UBTECH Robotics, Inc.
- Anki (Digital Dream Labs)
- Sony Corporation
- Miele & Cie. KG.
Competitive Landscape for Consumer Robotics Market:
iRobot Corporation is a Massachusetts‑based leader in the global consumer robotics market, best known for its Roomba robot vacuums and Braava mops, designing intelligent home robots that simplify cleaning through advanced navigation, mapping, and connectivity for millions of households worldwide.
-
In July 2025, iRobot has unveiled the Roomba® Max 705 Combo Robot + AutoWash™ Dock, its most powerful 2-in-1 cleaning system with heated mopping, 175x suction, and AI object avoidance. The flagship device features a self-cleaning dock, smart navigation, and a unique mop cover to protect carpets, delivering a truly hands-free home cleaning experience.
Roborock Technology Co., Ltd. is a Beijing‑based Chinese consumer robotics company founded in 2014, specializing in smart robotic vacuum cleaners and floor‑cleaning solutions with advanced navigation, AI obstacle avoidance, and automated features, and is recognized globally for leading sales in the robot vacuum market.
-
In July 2025, Roborock's updated privacy policy now allows user data from its smartphone app to be processed in China, sparking concerns over potential leaks and misuse.The change eliminates previous mentions of storing South Korean user data in U.S. servers, fueling fears about Chinese surveillance and data security.
| Report Attributes | Details |
|---|---|
| Market Size in 2025E | USD 13.79 Billion |
| Market Size by 2033 | USD 67.18 Billion |
| CAGR | CAGR of 21.88% From 2026 to 2033 |
| Base Year | 2025E |
| Forecast Period | 2026-2033 |
| Historical Data | 2021-2024 |
| Report Scope & Coverage | Market Size, Segments Analysis, Competitive Landscape, Regional Analysis, DROC & SWOT Analysis, Forecast Outlook |
| Key Segments | • By Level of Autonomy(Autonomous, Semi-Autonomous) • By Product Type(Cleaning Robots, Social and Companion Robots, Entertainment and Gaming Robots, Personal Mobility and Wearable Robots and Consumer Drones) • By Application(Household Cleaning and Maintenance, Security and Surveillance, Entertainment and Companion, Personal Health and Wellness, Educational and STEM Learning) • By Distribution Channel(Online Retail, Specialty Electronics Stores, Mass Merchandisers, Direct-to-Consumer and Other Channels) |
| Regional Analysis/Coverage | North America (US, Canada), Europe (Germany, UK, France, Italy, Spain, Russia, Poland, Rest of Europe), Asia Pacific (China, India, Japan, South Korea, Australia, ASEAN Countries, Rest of Asia Pacific), Middle East & Africa (UAE, Saudi Arabia, Qatar, South Africa, Rest of Middle East & Africa), Latin America (Brazil, Argentina, Mexico, Colombia, Rest of Latin America). |
| Company Profiles | The Consumer Robotics market companies are iRobot Corporation, Roborock Technology Co., Ltd., Ecovacs Robotics Co., Ltd., DJI Technology Co., Ltd., Xiaomi Corporation, Neato Robotics, Inc., LG Electronics Inc., Samsung Electronics Co., Ltd., Robert Bosch GmbH, Maytronics Ltd., SharkNinja Operating LLC (Shark Robotics), Honda Motor Co., Ltd., 3D Robotics, Inc., Dyson Ltd., Panasonic Corporation, Toshiba Corporation, UBTECH Robotics, Inc., Anki (Digital Dream Labs), Sony Corporation, Miele & Cie. KG. and Others. |
Frequently Asked Questions
Ans: North America dominated the Consumer Robotics Market in 2025E.
Ans: The “Semi-Autonomous” segment dominated the Consumer Robotics Market
Ans: Rising smart home adoption, aging population needs, and advancements in AI and IoT are key drivers of the consumer robotics market.
Ans: The Consumer Robotics Market size was valued at USD 13.79 Billion in 2025E and is projected to reach USD 67.18 Billion by 2033.
Ans: The Consumer Robotics Market is expected to grow at a CAGR of 21.88% during 2026-2033.
Get in Touch
