Customer Data Platform Market Report Scope & Overview:
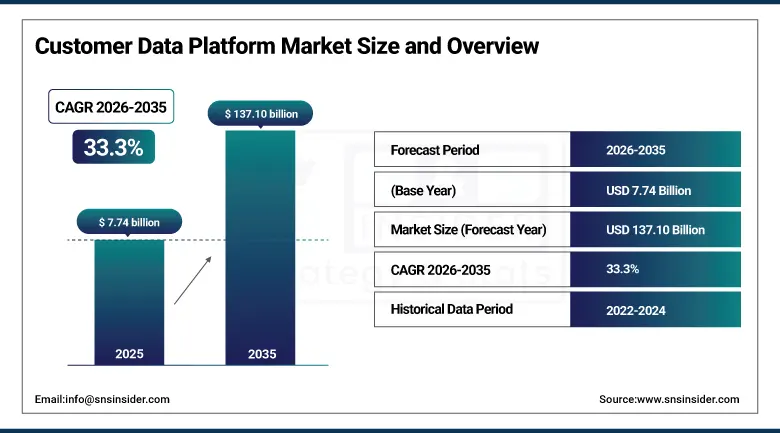
The Customer Data Platform Market was valued at USD 7.74 billion in 2025 and is expected to reach USD 137.10 billion by 2035, growing at a CAGR of 33.3% from 2026-2035.
The implementation of unified customer profiles, real-time data insights, and hyper-personalization in the retail industry, BFSI, healthcare, and telecom sectors is leading to the significant rise of the Customer Data Platform (CDP) market. With more firms implementing first-party data owing to data privacy regulations like GDPR and CCPA, the need for CDP solutions is becoming imperative for survival. The combination of technologies such as artificial intelligence and machine learning, especially small language models and generative AI, is transforming the way businesses utilize customer data, thus enabling them to do tasks like segmentation, predictive analysis, journey mapping, and decisioning. The explosion of digital channels and the growing relevance of omnichannel customer engagement strategies are driving CDP adoption by enterprises for a single source of customer truth.
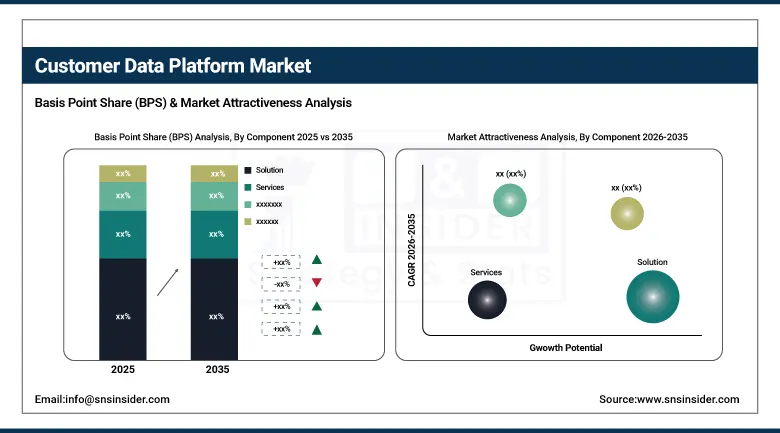
Based on industry statistics, the solution category generated the highest market share of 62.74% in 2025, fueled by the rising demand for an integrated platform which can help collect all customer data, offer real-time analytics, and conduct personalized marketing efforts, while key players such as Salesforce and Oracle continue innovating their CDP offerings by adding advanced AI and automation capabilities.
Market Size and Forecast
• Market Size in 2025: USD 7.74 Billion
• Market Size by 2035: USD 137.10 Billion
• CAGR: 33.3% from 2026 to 2033
• Base Year: 2025
• Forecast Period: 2026-2035
• Historical Data: 2022-2024
To Get more information on Customer Data Platform Market - Request Free Sample Report
Market Trends
-
Rapid integration of generative AI and large language models into CDP platforms enabling natural language data querying, automated customer journey generation, AI-powered content personalization at scale, and real-time predictive customer scoring.
-
Accelerating shift toward composable CDPs built on cloud data warehouses enabling organizations to combine modular data ingestion, activation, and analytics capabilities without vendor lock-in.
-
Increased use of real-time event streaming architecture in CDPs to process customer data at milliseconds latency in order to take decisions on best possible actions.
-
•Greater use of privacy-preserving techniques in CDPs including federated learning, differential privacy, and consent management systems to personalize customer data while adhering to regulations.
-
• The increasing use of CDPs in orchestrating the customer journey, where brands can plan, automate, and optimize complex multi-step omnichannel customer journeys based on behavioral and transactional data.
-
• The increased use of CDPs in enterprises for identity resolution technologies that allow for the unification of online and offline customer data across different types of customer identities into persistent customer profiles.
-
• The increasing use of CDPs in B2B companies for account-based marketing and sales intelligence, helping in activating intent data at an account level, identifying buying committees, and personalized engagement.
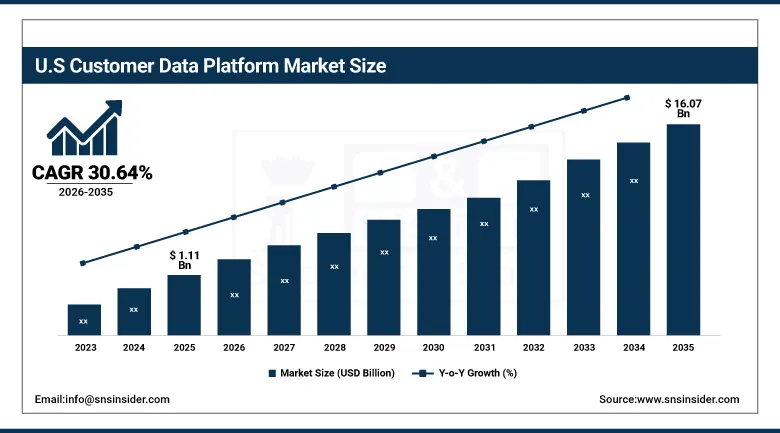
U.S. Customer Data Platform Market was valued at USD 1.11 billion in 2025 and is expected to reach USD 16.07 billion by 2035, growing at a CAGR of 30.64% during 2026-2035.
U.S. is dominating the world CDP market due to the high level of digital maturity, wide use of cloud computing, and strong presence of large technology providers such as Salesforce, Adobe, and Oracle who have made CDP capabilities integral part of their enterprise marketing clouds. The companies working in the U.S. in the sectors of retail, BFSI, healthcare, and telecommunications use CDP systems for consolidation of customer data, personalization, and compliance with new regulations on data protection. The rising demand for AI-powered analytics, real-time segmentation of customers, and integration with marketing automation tools fuels the adoption of CDPs.
Adobe released some significant improvements for the Adobe Experience Platform by releasing Agent Orchestrator, consisting of ten new AI agents that simplify marketing processes. The launch of these agents is being heralded for making the lives of marketers easier since businesses such as Marriott have reported a 70 percent decrease in their campaign content generation time.
Customer Data Platform Market Segment Insights
-
Based on Component, Solution accounted for the largest market share (~62.74%) in 2025; Services expected to be the fastest-growing segment (CAGR of 32.6%).
-
Based on Enterprise Size, Large Enterprises accounted for the largest market share (~43.16%) in 2025; SMEs expected to be the fastest-growing segment (CAGR of 35.46%).
-
Based on Deployment, Cloud accounted for the largest market share in 2025; On-Premises growing significantly for high-security industry verticals.
Segment Analysis
By Component, Solution dominates, Services expected to grow fastest
The solution segment dominated the CDP market with approximately 62.74% revenue share in 2025, driven by the increasing need for unified platforms that bring customer data together, enable real-time analytics, and support personalized marketing. Companies are embracing CDP solutions to dismantle data silos and improve cross-channel customer interactions. Leading vendors including Salesforce, Oracle, and Adobe have extended their CDP solutions with enhanced AI capabilities, automated audience segmentation, and predictive lifecycle management features.
It is expected that the services segment will record the highest CAGR of 32.6% during 2026-2035 owing to rising demand for consulting services, deployment services, and maintenance services in relation to the CDPs. Most enterprises find it difficult to possess in-house capabilities to design and optimize CDP architecture due to complexities involved with data ecosystem. On the other hand, managed service providers have also helped SMEs deploy CDPs with reduced internal costs.
By Enterprise Size, Large Enterprises dominate, SMEs expected to grow fastest
Revenue contribution from large enterprises was highest at approximately 43.16%, mainly due to the fact that large enterprises have dedicated marketing and IT departments, data ecosystems, and omnichannel environments requiring enterprise-level CDP solutions. The large enterprises require vendor-specific arrangements that would meet their needs, in conjunction with CRM, ERP, analytics, and marketing automation systems. Companies such as Adobe, SAP, and Oracle continue to focus on selling their products directly to enterprises along with data governance and analytics solutions.
SMEs will experience the highest growth rate, that is 35.46%, from 2026 to 2035 due to the increased participation of third party vendors, channel partners, and resellers in providing cost-effective CDP capabilities for medium-sized and small firms. The indirect delivery method provides a scalable and cost-effective way of using CDP capabilities for organizations without having to manage their enterprise-level deployment internally.
By Deployment, Cloud dominates, On-Premises significant for regulated sectors
In 2025, cloud deployment accounted for the major share of the CDP market due to increased usage of cloud computing in different industries. It is easier for companies to choose cloud-based CDPs due to their flexibility, scalability, low cost of initial investment, and quick implementation compared to on-premise CDPs. The use of cloud-based CDPs makes it easier for companies to access customer data wherever they are located, especially for multinational companies.
The on-premise category remains one of the fastest-growing categories, especially among organizations operating in regulated industries such as BFSI, healthcare, and government that need full control over their customer’s data. By deploying CDPs on-premise, such organizations are able to enforce stringent security policies, granular data access, and compliance with no dependence on external cloud vendors for data sovereignty.
Regional Analysis
|
Region |
Major Country |
Share within Region (%) |
|---|---|---|
|
North America |
United States |
41% |
|
Europe |
Germany |
27% |
|
Asia Pacific |
China |
44% |
|
Middle East & Africa |
UAE |
30% |
|
Latin America |
Brazil |
43% |
North America Customer Data Platform Market Insights
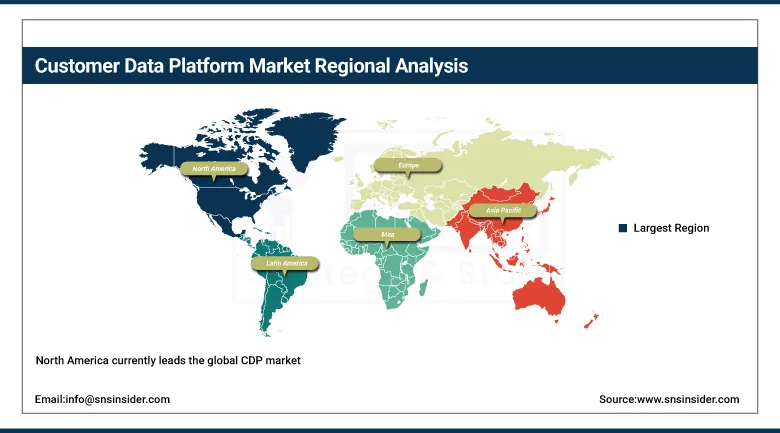
North America currently leads the global CDP market, supported by its mature digital ecosystem, high enterprise technology adoption, and the strong presence of world-leading technology companies including Salesforce, Adobe, Oracle, and Microsoft. The U.S. drives the majority of regional revenue, with enterprises across retail, BFSI, healthcare, and media making substantial CDP investments to enable personalization at scale and first-party data strategies in a post-cookie marketing landscape.
Get Customized Report as per Your Business Requirement - Enquiry Now
Asia Pacific Customer Data Platform Market Insights
The Asia Pacific region is anticipated to witness a fast-growing CAGR of around 34.47% during 2026-2035 owing to the increasing trend of digitalization, skyrocketing growth in e-commerce, and increased demand for customer-oriented solutions in countries like China, India, and Southeast Asia. China is leading because of its extensive digital consumer base, increasing ecosystem of artificial intelligence-based marketing, and government support for digital economy expansion. The rapid growth of digital commerce in India is fueling the demand for CDP.
Europe Customer Data Platform Market Insights
Europe has an important share in the worldwide CDP market, owing to GDPR compliance standards and their need for customer data management platforms that prioritize privacy, coupled with the increasing attention to first party data activation post third party cookie deprecation. The leading countries are Germany, France, and the UK, with retail, financial services, and media organizations in Europe being major investors in CDPs.
Middle East & Africa and Latin America Customer Data Platform Market Insights
The Middle East and Africa CDP market is an emerging growth region, driven by rapid digitalization, growing e-commerce penetration, and increasing enterprise focus on customer experience optimization in UAE, Saudi Arabia, and South Africa. Latin America, led by Brazil, is experiencing rising CDP demand driven by the rapid expansion of digital commerce, fintech platforms, and retail digital transformation.
Customer Data Platform Market Growth Drivers:
Surging demand for unified real-time customer profiles, AI-powered personalization at scale, and first-party data strategies under stricter privacy regulations driving rapid CDP adoption globally: There is rapid growth being witnessed within the Customer Data Platform market due to organizations focusing on real-time customer insights and unification of data ecosystem amidst various fragmented digital channels. Growing regulatory restrictions on the use of third-party cookies and data protection laws have led to organizations adopting first party data approach, and hence the need for Customer Data Platforms in such organizations. The adoption of Generative AI and machine learning technology is fostering predictive segmentation, personalization, and customer journey orchestration. In addition, there is a growing trend towards composable architecture and real-time event streaming in CDPs. This has seen CDPs becoming enterprise intelligence layers.
Customer Data Platform Market Restraints:
High implementation complexity and total cost of ownership of enterprise CDP deployments: Implementation difficulties, issues relating to data integration, and high cost of infrastructure are the major factors that are limiting the global adoption of CDP solutions. The challenge faced by many companies is data integration and consolidation from disparate data sources within the legacy system, cloud computing platform, and third-party software, which results in delays in the implementation process. Data protection laws such as GDPR and CCPA complicate the operations and reduce flexibility in the use of data. Also, a lack of data engineers and AI experts is hindering the process.
Customer Data Platform Market Opportunities:
Growing adoption of AI-powered CDPs for predictive personalization: The rapid development of AI-powered marketing automation, first-party data strategies, and omnichannel customer engagement is creating huge possibilities for CDP providers globally. The growing tendency towards the creation of cookie-less digital ecosystems is generating demand for enterprises' need for a single solution that can manage customer identity and consent. Generative AI, predictive analytics, and real-time decision-making engines are making it possible for next-generation CDPs to deliver hyper-personalized customer experiences. Geographic expansion, cloud computing adoption, and digital commerce penetration are also adding to the market's growth. In addition, composable and modular approaches to CDP architecture are creating possibilities for scalable implementation of CDPs.
Recent Developments:
-
2026: Salesforce expanded its Data Cloud and AI-driven CDP capabilities, strengthening integration with Agentforce AI agents to enable real-time customer profile unification and autonomous marketing decisioning across sales, service, and commerce ecosystems.
-
2026: Adobe enhanced its Experience Platform (AEP) with expanded AI ecosystem integrations across AWS, Google Cloud, Microsoft, NVIDIA, and OpenAI, focusing on solving enterprise data fragmentation and enabling hyper-personalized “segment-of-one” customer experiences.
-
2026: Salesforce introduced improved AI-based revenue reporting and CDP segmentation transparency within Data 360, reflecting stronger enterprise demand for unified customer intelligence and measurable AI-driven marketing performance outcomes.
Customer Data Platform Market Key Players
• Salesforce.com, Inc.
• Adobe Inc.
• Oracle Corporation
• Microsoft Corporation
• SAP SE
• Segment.io, Inc.
• Redpoint Global
• ActionIQ
• BlueConic
• Tealium
• Treasure Data
• mParticle
• Lytics Inc.
• Exponea
• Acxiom LLC
• Informatica LLC
• Klaviyo
• Totango
• FirstHive
• Amperity
Customer Data Platform Market Report Scope:
| Report Attributes | Details |
|---|---|
| Market Size in 2025 | USD 7.74 Billion |
| Market Size by 2035 | USD 137.10 Billion |
| CAGR | CAGR of 33.3% From 2026 to 2035 |
| Base Year | 2025 |
| Forecast Period | 2026-2035 |
| Historical Data | 2022-2024 |
| Report Scope & Coverage | Market Size, Segments Analysis, Competitive Landscape, Regional Analysis, DROC & SWOT Analysis, Forecast Outlook |
| Key Segments | • By Component (Solution, Services) • By Deployment (Cloud, On-Premises) • By Enterprise Size (Large Enterprises, SMEs) • By End-Use Industry (Retail & E-Commerce, BFSI, Healthcare, Telecom & IT, Media & Entertainment, Travel & Hospitality, Others) |
| Regional Analysis/Coverage | North America (US, Canada), Europe (Germany, UK, France, Italy, Spain, Russia, Poland, Rest of Europe), Asia Pacific (China, India, Japan, South Korea, Australia, ASEAN Countries, Rest of Asia Pacific), Middle East & Africa (UAE, Saudi Arabia, Qatar, South Africa, Rest of Middle East & Africa), Latin America (Brazil, Argentina, Mexico, Colombia, Rest of Latin America). |
| Company Profiles | Salesforce.com, Inc., Adobe Inc., Oracle Corporation, Microsoft Corporation, SAP SE, Segment.io, Inc., Redpoint Global, ActionIQ, BlueConic, Tealium, Treasure Data, mParticle, Lytics Inc., Exponea, Acxiom LLC, Informatica LLC, Klaviyo, Totango, FirstHive, Amperity |
Get in Touch
