Digital Therapeutics Market Report Scope & Overview:
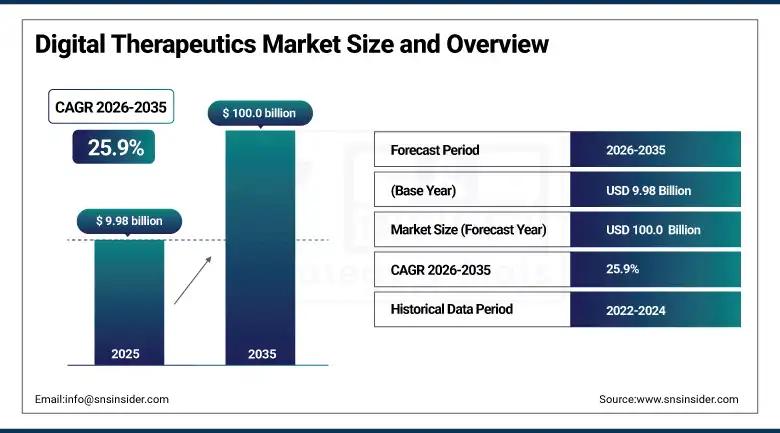
The digital therapeutics market was valued at USD 9.98 billion in 2025 and is expected to reach USD 100.0 billion by 2035, growing at a CAGR of 25.9% from 2026–2035.
Digital therapeutics represent a fundamentally distinct category within the digital health ecosystem, defined by their delivery of evidence-based therapeutic interventions directly to patients through clinically validated software programmes whose safety and efficacy have been demonstrated through rigorous randomised controlled trials comparable to the standards required for pharmaceutical drug approval. Unlike health and wellness mobile applications that provide informational content, motivational support, or basic tracking without demonstrating clinical benefit in controlled studies, digital therapeutics are characterised by their clinical evidence base, regulatory clearance or approval in major jurisdictions, their integration into clinical care pathways under physician oversight, and their demonstrated ability to prevent, manage, or treat medical conditions with outcomes data comparable to or complementary to pharmacological alternatives. The category encompasses software-delivered cognitive behavioural therapy programmes for insomnia and substance use disorders, gamified rehabilitation programmes for neurological conditions, interactive disease management programmes for diabetes and cardiovascular conditions, and AI-powered digital companions supporting oncology patients through treatment adherence and side effect management.
The FDA's Digital Health Centre of Excellence's 2025 report confirming over 40 prescription digital therapeutics had received FDA authorisation or were in active review, compared with fewer than 5 in 2020, demonstrates the regulatory system's progressive engagement with digital therapeutic evidence packages that is converting the early pioneer approvals into a systematic commercial pathway that the broader digital therapeutics development community can now navigate with defined expectations.
Market Size and Forecast
-
Market Size in 2026E: USD 12.57 Billion
-
Market Size by 2035: USD 100.0 Billion
-
CAGR: 25.9% from 2026 to 2035
-
Fastest Growing Region: Asia Pacific
-
Largest Region: North America
To Get more information On Digital Therapeutics Market - Request Free Sample Report
Digital Therapeutics Market Trends
-
Rapid expansion of prescription digital therapeutics reimbursement coverage from commercial health insurers and CMS following the accumulation of real-world evidence from commercially deployed digital therapeutic programmes demonstrating sustained clinical benefit, healthcare cost reduction, and patient engagement quality that supports payer economic model justification for formulary inclusion.
-
Growing development of AI-powered adaptive digital therapeutics that dynamically adjust intervention intensity, content selection, and engagement approach based on real-time patient behaviour data, clinical biomarker inputs, and machine learning predictions of individual patient response to specific intervention elements, delivering personalised therapeutic experiences that static protocol digital therapeutics cannot provide.
-
Increasing pharmaceutical company investment in digital therapeutic companion products that enhance the clinical effectiveness and commercial differentiation of their drug portfolios through software programmes that improve medication adherence, monitor treatment response, and manage side effects as integrated drug-device combination therapeutic packages.
-
Rising adoption of digital therapeutics in employer wellness programme contexts, where companies are purchasing prescription digital therapeutics directly from manufacturers as preventive and disease management benefits for their employee populations, creating a direct employer procurement channel that bypasses traditional pharmaceutical distribution and payer reimbursement pathways.
-
Expanding regulatory approval and reimbursement frameworks across European markets through the German DiGA pathway, the French ETAPES programme, and emerging regulatory frameworks in Japan, South Korea, and Singapore that are creating multi-jurisdictional commercial pathways for digital therapeutic programmes beyond the FDA-focused development that characterised the category's early commercial phase.
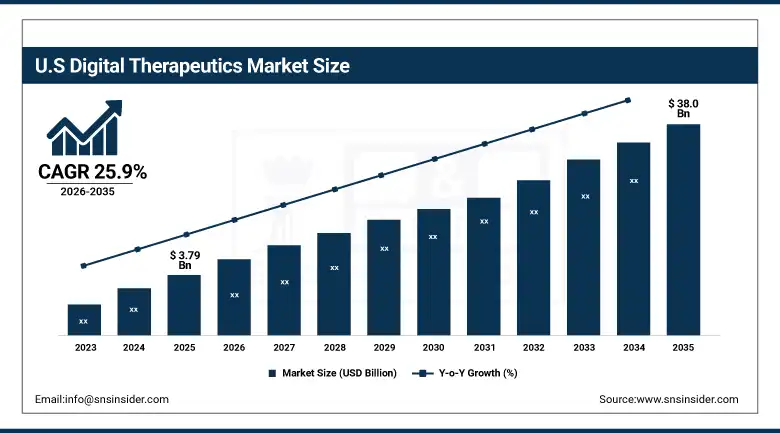
The U.S. Digital Therapeutics Market Outlook
The U.S. Digital Therapeutics Market was valued at approximately USD 3.79 billion in 2025 and is expected to reach approximately USD 38.0 billion by 2035, growing at a CAGR of 25.9%, driven by FDA prescription digital therapeutic approvals establishing commercial precedents, CMS reimbursement code development creating payer coverage frameworks, employer direct procurement providing initial revenue pathways, and the most active digital health investment ecosystem funding clinical evidence generation programmes.
The United States leads the global digital therapeutics market through the FDA's pioneering role in developing the De Novo and 510(k) regulatory frameworks through which prescription digital therapeutics demonstrate safety and efficacy, creating the world's most clearly defined regulatory pathway for digital therapeutic commercial authorisation. The FDA's authorisation of Pear Therapeutics' reSET and reSET-O for substance use disorder treatment, Somryst for chronic insomnia, EndeavorRx for paediatric ADHD, and numerous subsequent digital therapeutic products across multiple therapeutic areas has created a commercial market of FDA-authorised prescription digital therapeutics whose clinical evidence, regulatory status, and commercial experience provide the reference standards that payer coverage decisions, clinical practice guideline integration, and international regulatory authority engagement are progressively adopting.
CMS's creation of Medicare reimbursement codes for digital mental health treatment devices and the AMA's Current Procedural Terminology code development process for digital therapeutic billing represent the regulatory and billing infrastructure milestones that are progressively transforming digital therapeutics from a primarily out-of-pocket consumer purchase toward an insurer-covered clinical benefit equivalent in commercial framework to pharmaceutical drug products.
Digital Therapeutics Market Segment Analysis
-
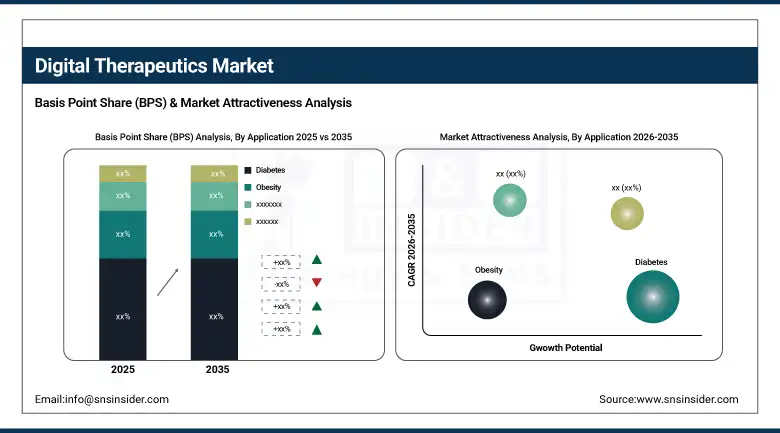
By Application, diabetes dominated with approximately 29.3% share in 2025 driven by the 500 million global diabetic patient population requiring continuous behavioural and medication management support. Diabetes is also the fastest-growing application as real-time glucose monitoring integration, AI-powered insulin optimisation coaching, and comprehensive lifestyle intervention programmes create expanding clinical evidence and patient engagement outcomes.
-
By Sales Channel, business to business dominated with approximately 66% in 2025 as the primary commercial pathway through employer benefits, payer formularies, and hospital health system procurement. Business to consumer is the fastest-growing channel as consumer awareness, direct-to-patient prescription digital therapeutic models, and DTC digital therapeutic subscription services expand.
-
By End-User, patients dominated with approximately 34.0% share in 2025 as the direct beneficiaries of digital therapeutic interventions whose engagement, adherence, and outcome data drive reimbursement and clinical adoption decisions. Providers are the fastest-growing end-user as physician prescription of digital therapeutics, EHR-integrated ordering workflows, and outcome monitoring tools expand clinical adoption beyond early-adopter specialist practices.
By Application, diabetes dominates and is expected to continue as the largest segment
Diabetes retained the dominant application position with approximately 29.3% of the digital therapeutics market in 2025, as the extraordinary global scale of the diabetic patient population, the well-documented challenge of sustained lifestyle behaviour change that is the primary determinant of glycaemic control in type 2 diabetes management, and the accumulating clinical evidence that digitally delivered structured diabetes management programmes achieve meaningful HbA1c reduction through personalised coaching, real-time feedback, and community support have collectively created the most commercially compelling and clinically validated application category in the digital therapeutics market. Digital diabetes management programmes including Livongo, Noom Medical, Virta Health's remote therapeutic management for type 2 diabetes reversal, and One Drop's AI-powered diabetes coaching have collectively enrolled millions of patients and generated the real-world evidence datasets that are driving employer, payer, and health system procurement at scales that no other digital therapeutic application category has achieved.
Obesity is the second-largest application and is experiencing rapid growth as the convergence of GLP-1 receptor agonist medication for obesity treatment with digital therapeutic behaviour change programmes creates a combined pharmacological and digital intervention approach whose synergistic outcomes are demonstrating superior weight loss maintenance and cardiometabolic risk reduction compared with either intervention alone. Digital therapeutics developers are actively partnering with GLP-1 drug manufacturers and payers to create integrated drug-digital therapeutic programmes that improve GLP-1 treatment outcomes through the behaviour change support, food relationship work, and exercise habit development that pharmaceutical treatment alone cannot provide.
By End-User, patients dominate, providers are expected to grow fastest
Patients retained the dominant end-user position with approximately 34.0% of the digital therapeutics market in 2025, as the patient as the direct consumer and beneficiary of digital therapeutic interventions represents both the primary engagement stakeholder whose sustained participation determines therapeutic outcome quality and, in the direct-to-consumer and employer-direct procurement models, the commercial decision-maker whose willingness to pay or enrol in employer-provided digital therapeutic benefits drives revenue. The patient end-user segment's commercial primacy reflects the consumer digital health market's scale, where millions of patients engage with health management applications as part of their daily health routines, and the progressive conversion of this informal health engagement into structured digital therapeutic programmes whose clinical validation, prescription model, and outcome measurement distinguish them from the general wellness applications that represent the majority of consumer digital health activity.
Providers are the fastest-growing end-user segment as the progressive integration of digital therapeutics into clinical practice guidelines, EHR-based ordering workflows that enable physician prescription of digital therapeutics through the same systems used for pharmaceutical prescriptions, and outcome monitoring dashboards that provide clinicians with patient engagement and clinical outcome data from their prescribed digital therapeutics are converting digital therapeutic prescribing from an exceptional early-adopter behaviour into a mainstream clinical tool for managing chronic disease patient populations at scale within constrained consultation time.
Regional Analysis
|
Region |
Major Country |
Share within Region, 2025 (%) |
|---|---|---|
|
North America |
United States |
86.4% |
|
Europe |
Germany |
28.7% |
|
Asia Pacific |
Japan |
32.4% |
|
Middle East & Africa |
UAE |
27.6% |
|
Latin America |
Brazil |
43.8% |
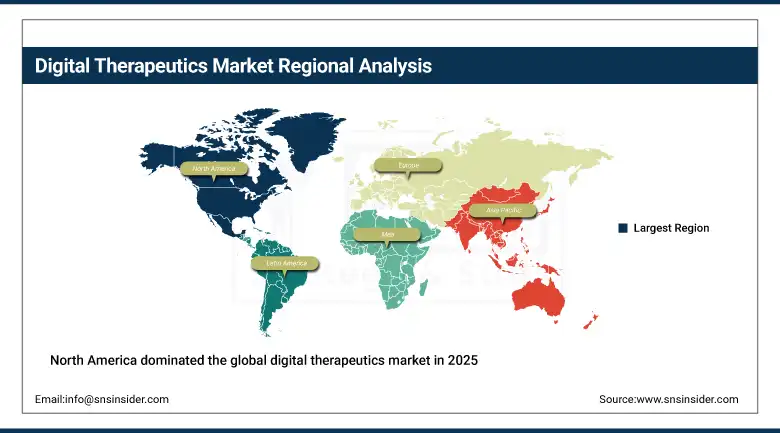
North America Digital Therapeutics Market Insights
North America dominated the global digital therapeutics market in 2025, with the United States accounting for approximately 86.4% of North American revenues as the world's most commercially developed digital therapeutics ecosystem. The region's leadership reflects the FDA's regulatory pioneering, the most active clinical evidence generation programme, the highest commercial investment in digital therapeutic product development, and the employer health benefits procurement infrastructure that provides the largest single commercial digital therapeutic procurement channel globally. CMS's development of Medicare digital health reimbursement frameworks and commercial payer coverage policy evolution are progressively creating the systemic reimbursement support that sustainable large-scale digital therapeutic commercialisation requires beyond early-adopter employer and cash-pay markets.
Get Customized Report as per Your Business Requirement - Enquiry Now
Europe Digital Therapeutics Market Insights
Europe is a rapidly growing digital therapeutics market characterised by Germany's DiGA fast track pathway that has established the world's most systematised national digital therapeutic reimbursement framework, where approved prescription digital therapeutics receive statutory health insurance coverage and NHS-equivalent national payer reimbursement that provides commercial certainty comparable to pharmaceutical drug coverage. Germany accounts for approximately 28.7% of European revenues as the pioneering DiGA market whose systematic approach to digital therapeutic evidence assessment, reimbursement, and outcome-linked pricing has created a commercial blueprint that France, the United Kingdom, Belgium, and other European countries are progressively adopting as the basis for their own national digital therapeutic frameworks.
Asia Pacific Digital Therapeutics Market Insights
Asia Pacific is the fastest-growing digital therapeutics market, driven by Japan's progressive pharmaceutical and medical device regulatory system's engagement with software as medical devices including digital therapeutics, South Korea's digital health innovation ecosystem, China's enormous chronic disease burden, and the extraordinary smartphone penetration across the region that provides the delivery infrastructure for digital therapeutic programmes to reach patient populations at scale. Japan accounts for approximately 32.4% of Asia Pacific revenues through its PMDA's progressive engagement with prescription digital therapeutics, the approval of the first digital therapeutic for nicotine dependence in Japan, and major Japanese pharmaceutical companies' partnerships with digital therapeutic developers to expand their product portfolios into software-delivered therapeutic interventions.
MEA & Latin America Digital Therapeutics Market Insights
The Middle East and Africa and Latin America are developing digital therapeutics markets where high smartphone penetration enabling digital programme access, the enormous burden of chronic diseases including diabetes and cardiovascular conditions, and growing health system investment in cost-effective scalable interventions are creating initial commercial opportunities. UAE leads MEA digital therapeutics revenues at approximately 27.6% of regional revenues through its progressive digital health regulatory environment, Vision 2030 health technology investment, and high smartphone penetration enabling digital therapeutic programme access. Brazil leads Latin American revenues at approximately 43.8% through its large digital health ecosystem, growing health technology investment, and ANVISA's progressive engagement with digital health device classification.
Market Dynamics
Growth Drivers: Escalating chronic disease burden creating unmanageable care demand at conventional healthcare service delivery
The primary structural growth drivers for the digital therapeutics market are the fundamental inadequacy of conventional healthcare service delivery capacity to manage the enormous and growing global burden of chronic diseases including diabetes, obesity, cardiovascular conditions, and mental health disorders at the scale that epidemiological prevalence requires, creating the healthcare system motivation to adopt scalable digital interventions that can provide evidence-based therapeutic support to patient populations that clinician appointment capacity cannot serve, combined with the progressive regulatory and reimbursement legitimisation of digital therapeutics that is converting what was initially viewed as a speculative technology category into a recognised clinical intervention class with defined development, approval, and coverage pathways comparable to pharmaceutical drugs.
Restraints: Payer reimbursement coverage gaps limiting commercial scaling beyond early-adopter employer and cash-pay markets, patient engagement and adherence challenges limiting therapeutic effectiveness
A significant restraint on the digital therapeutics market is the persistent gap between the regulatory authorisation of prescription digital therapeutics and the commercial payer coverage that is necessary for population-scale patient access, where even FDA-authorised digital therapeutics may lack the specific insurance coverage codes, formulary placement, and benefit design positioning that makes them accessible to patients at the zero or minimal out-of-pocket cost that drives high adoption rates in pharmaceutical drug programmes. The patient engagement and adherence challenge is inherent to software-delivered intervention models that depend on patient willingness to repeatedly interact with a digital programme over weeks, months, or years, creating real-world effectiveness disadvantages relative to the highly monitored and supported conditions of clinical trials where engagement support is systematically provided.
Opportunities: GLP-1 drug companion digital therapeutic market creating pharmaceutical partnership opportunities
The GLP-1 receptor agonist market's commercial explosion represents the most immediately significant new market development opportunity for digital therapeutics, as the tens of millions of patients initiating GLP-1 therapy for obesity and type 2 diabetes management require the sustained behaviour change support, food relationship restructuring, and lifestyle habit development that pharmacological treatment alone cannot provide but that integrated drug-digital therapeutic programmes can address through evidence-based CBT, nutritional coaching, and exercise behaviour activation that improve both immediate GLP-1 treatment outcomes and long-term weight maintenance following medication discontinuation.
Recent Developments:
-
2025: Pear Therapeutics' FDA-cleared prescription digital therapeutics for substance use disorder returned to commercial availability through new corporate ownership following the original company's bankruptcy, with the clinical evidence base and FDA authorisation of reSET and reSET-O preserved and the commercial infrastructure rebuilt under new management committed to expanding payer coverage and clinical adoption.
-
2025: Dario Health expanded its AI-powered digital therapeutics platform for cardiometabolic conditions with new GLP-1 medication companion features that provide integrated coaching and monitoring for patients on GLP-1 weight management therapy, positioning the platform at the intersection of the digital therapeutics and obesity pharmacotherapy markets.
-
2025: Somryst expanded international market access beyond the United States following European market entry through regulated digital therapeutic frameworks, with clinical outcome data from U.S. deployment demonstrating CBT-I delivery quality equivalent to therapist-delivered cognitive behavioural therapy for insomnia in real-world patient populations.
Digital Therapeutics Market Key Players are:
-
Pear Therapeutics Inc.
-
Dario Health Corp.
-
Voluntis SA
-
Livongo Health (Teladoc)
-
Virta Health Corp.
-
Noom Inc.
-
One Drop (Lifecore Health)
-
Propeller Health (ResMed)
-
Big Health Ltd.
-
Limbix Health Inc.
-
Happify Health
-
Better Therapeutics Inc.
-
Mahana Therapeutics
-
Twill Inc.
-
Kaia Health GmbH
-
Swing Therapeutics Inc.
-
Quit Genius (Moment Health)
Digital Therapeutics Market Report Scope:
| Report Attributes | Details |
|---|---|
| Market Size in 2025 | USD 9.98 Billion |
| Market Size by 2035 | USD 100.00 Billion |
| CAGR | CAGR of 25.9% From 2026 to 2035 |
| Base Year | 2025 |
| Forecast Period | 2026-2035 |
| Historical Data | 2022-2024 |
| Report Scope & Coverage | Market Size, Segments Analysis, Competitive Landscape, Regional Analysis, DROC & SWOT Analysis, Forecast Outlook |
| Key Segments | •By Application (Diabetes, Obesity, Cardiovascular Disease, CNS Disease, Respiratory Disease, Smoking Cessation, Others) •By Sales Channel (Business to Business, Business to Consumer) •By End-User (Patients, Providers, Payers, Employers) |
| Regional Analysis/Coverage | North America (US, Canada), Europe (Germany, UK, France, Italy, Spain, Russia, Poland, Rest of Europe), Asia Pacific (China, India, Japan, South Korea, Australia, ASEAN Countries, Rest of Asia Pacific), Middle East & Africa (UAE, Saudi Arabia, Qatar, South Africa, Rest of Middle East & Africa), Latin America (Brazil, Argentina, Mexico, Colombia, Rest of Latin America). |
| Company Profiles | Pear Therapeutics Inc., Dario Health Corp., Voluntis SA, Omada Health Inc., Livongo Health (Teladoc), Virta Health Corp., Noom Inc., One Drop (Lifecore Health), Welldoc Inc., Propeller Health (ResMed), Big Health Ltd., Limbix Health Inc., Happify Health, Better Therapeutics Inc., Click Therapeutics Inc., Mahana Therapeutics, Twill Inc., Kaia Health GmbH, Swing Therapeutics Inc., Quit Genius (Moment Health) |
Frequently Asked Questions
Get in Touch
