Direct to Shape Printer Market Report Scope & Overview:
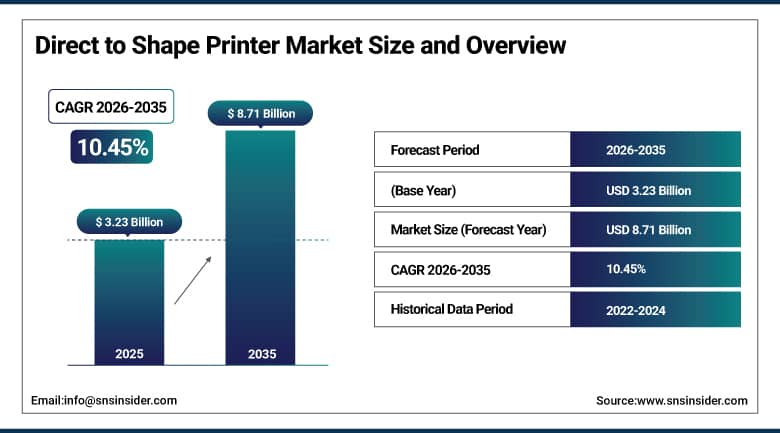
The Direct to Shape Printer Market was valued at USD 3.23 Billion in 2025 and is expected to reach USD 8.71 Billion by 2035, growing at a CAGR of 10.45% from 2026 to 2035.
Direct to shape printing technology represents a fundamental commercial and operational advance over conventional label-based product decoration by eliminating the intermediate materials, adhesives, application machinery, and waste streams associated with pressure-sensitive and heat-shrink labelling. In a direct to shape system, UV-curable or solvent-based inks are applied directly to the contoured surface of a bottle, can, container, or other three-dimensional object through precision inkjet or laser print heads that follow the object's topography with sub-millimeter registration accuracy. Consumer brand owners across beverages, cosmetics, personal care, spirits, and specialty food categories are driving the market's growth by recognizing that premium direct-printed packaging differentiates products on crowded retail shelves, creates stronger sensory engagement with consumers, and supports sustainability commitments by eliminating non-recyclable label laminate and adhesive contamination from product packaging waste streams. Pharmaceutical and personal care manufacturers are additionally drawn to direct to shape technology's serialization and variable data printing capabilities that support track-and-trace compliance without the production complexity of label-applied serialization systems.
The Durst Group unveiled the Tau RSC E digital print solution featuring direct-to-shape technology in 2025. This technology allows beverage and personal care product owners to produce full-color direct-to-container decoration at high speed with multicolor UV-LED curing taking place at the same time. The AI-powered color management system and the automated substrate detection feature facilitated fast setup when changing container formats.
Market Size and Forecast
-
Market Size in 2026E: USD 3.57 Billion
-
Market Size by 2035: USD 8.71 Billion
-
CAGR: 10.45% from 2026 to 2035
-
Fastest Growing Region: Asia Pacific
-
Largest Region: North America
To Get More Information On Direct to Shape Printer Market - Request Free Sample Report
Direct to Shape Printer Market Trends
-
UV-LED curing advancements are reducing energy consumption while improving print quality on heat-sensitive packaging substrates significantly.
-
Variable data printing enables mass customization for consumer brands requiring cost-efficient short-run packaging production capabilities.
-
Smart packaging integration is expanding direct-to-shape printing applications into consumer engagement and supply chain intelligence functions.
-
Craft beverage and premium spirits producers increasingly adopt direct-to-shape printing for distinctive cost-effective packaging differentiation.
-
E-commerce growth is increasing demand for flexible short-run packaging enabled by digital direct-to-shape printing technologies.
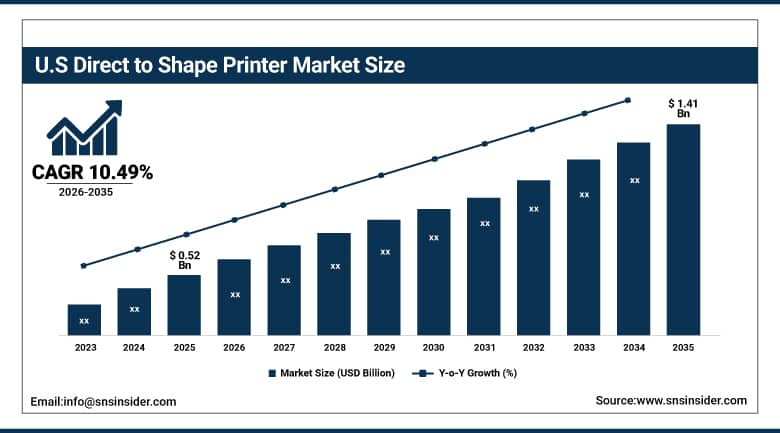
The U.S. Direct to Shape Printer Market Outlook
The U.S. direct to shape printer market was valued at approximately USD 0.52 Billion in 2025 and is expected to reach approximately USD 1.41 Billion by 2035, growing at a CAGR of approximately 10.49%.
The United States is the world's most commercially mature market for direct to shape printing technology. The U.S. Food and Drug Administration's evolving serialisation and traceability requirements for pharmaceutical and food packaging are creating additional demand for direct to shape printing's integrated variable data capability. Domestic manufacturers of direct to shape systems including INX International and Xerox Corporation have established strong reference customer networks across U.S. beverage, cosmetics, and food manufacturing sectors whose visible commercial success is accelerating adoption by brand owners who were previously evaluating the technology from a distance.
INX International Ink Co. advanced its InxFlex direct to shape printing programme in 2025 through expanded partnerships with U.S. craft brewery and beverage co-packer networks, deploying its UV-LED direct printing systems at multiple high-volume canning facilities. The programme's commercial success demonstrated that direct to shape printing could deliver economically viable per-can decoration costs at batch sizes as small as 50 cases, opening the technology to the long tail of small-production craft beverage brands that conventional label supply chains could not efficiently serve.
Direct to Shape Printer Market Segment Analysis
-
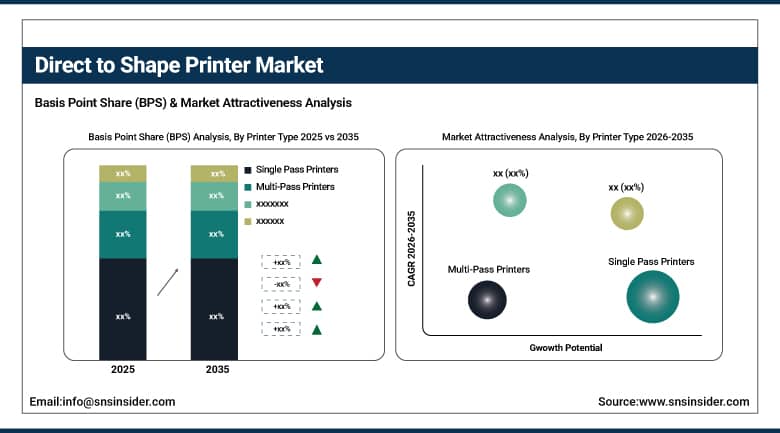
By Printer Type, the single pass printers segment dominated the market with 62.84% share in 2025, while the multi-pass printers segment addresses precision decoration requirements for specialty applications.
-
By Technology, the inkjet printing segment dominated the market with 74.36% share in 2025, while the laser printing segment is growing in specialty substrate applications.
-
By Ink Type, the UV-curable inks segment dominated the market with 58.47% share in 2025, while the aqueous-based inks segment is the fastest growing ink type during 2026 to 2035.
-
By Application, the bottles & containers segment dominated the market with 43.00% share in 2025, while the cosmetic & personal care packaging segment is the fastest growing application during 2026 to 2035.
-
By End User, the food & beverage industry segment dominated the market with 36.84% share in 2025, while the cosmetics & personal care segment is the fastest growing end user during 2026 to 2035.
By Printer Type, single pass printers dominate, multi-pass printers grows fastest
Single pass printers generated 62.84% of direct to shape printer market revenue in 2025. Their commercial dominance reflects the production efficiency of architectures in which the print substrate passes beneath a stationary print head array that covers the full print width in one movement, enabling production-line-compatible throughput speeds that multi-pass traverse systems cannot match. Direct to shape systems integrated into beverage can and bottle lines operate at several hundred units per minute, making single pass the preferred architecture for major food and beverage manufacturers whose scale demands compatibility with existing high-speed packaging equipment.
The multi-pass process delivers high-quality prints on a per-unit basis while being able to decorate more complex designs for less frequent printing jobs such as bottles for premium spirits, cosmetics, and pharmaceuticals.
By Application, bottles & containers dominate, cosmetic & personal care packaging grows fastest
Bottles and containers accounted for 43.00% of direct to shape printer market revenue in 2025, anchored by the beverage industry's extensive adoption of direct-to-bottle and direct-to-can printing technology across both large-scale industrial and craft production environments. The commercial logic is compelling for beverage producers whose brand identity is often expressed most powerfully through the visual and tactile quality of their primary container decoration.
Cosmetic and personal care packaging is growing fastest as the premium beauty and personal care sector's intense focus on product presentation quality, unboxing experience, and surface differentiation creates strong commercial demand for direct printing's ability to deliver full-coverage, high-resolution decoration on complex container geometries including oval, square, and uniquely shaped cosmetic bottles whose label application quality frequently disappoints relative to the brand's visual positioning ambitions.
Regional Analysis
|
Region |
Major Country |
Share within Region, 2025 (%) |
|---|---|---|
|
North America |
United States |
82.47% |
|
Europe |
Germany |
28.73% |
|
Asia Pacific |
China |
38.47% |
|
Middle East & Africa |
UAE |
22.84% |
|
Latin America |
Brazil |
43.84% |
North America Direct to Shape Printer Market Insights
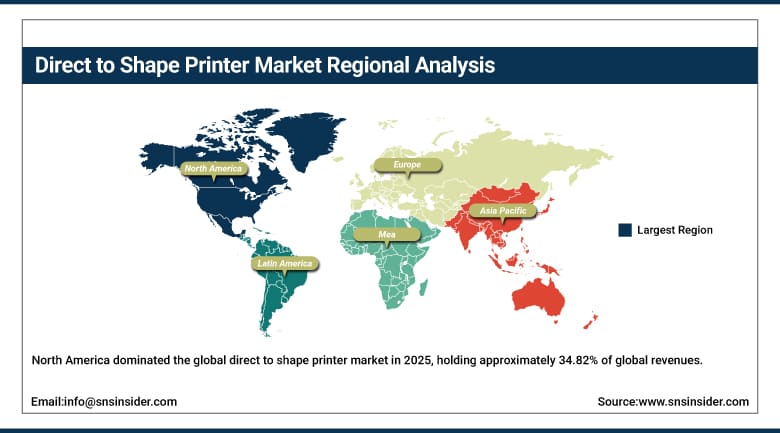
North America dominated the global direct to shape printer market in 2025, holding approximately 34.82% of global revenues. The United States accounts for approximately 82.47% of regional revenue through its concentration of major consumer goods brand owners, the commercial maturity of its craft beverage sector, and the depth of its digital printing technology innovation ecosystem. The region's packaging industry has been among the global leaders in sustainability-driven packaging format transition, and direct to shape printing's elimination of label materials and adhesives aligns with the sustainability commitments that major U.S. brand owners have publicly adopted. Canada contributes supplementary demand through its growing craft beverage sector and its well-developed food and personal care manufacturing industries whose packaging requirements increasingly specify premium decoration solutions.
Get Customized Report as Per Your Business Requirement - Enquiry Now
Europe Direct to Shape Printer Market Insights
Europe held approximately 28.47% of global Direct to Shape Printer revenues in 2025. The region's packaging regulations under the EU Green Deal, which impose recyclability and material reduction requirements on consumer product packaging, create regulatory-driven demand for label-elimination technologies that direct to shape printing delivers. Germany, France, Italy, and the United Kingdom are the leading national markets, each hosting significant beverage, cosmetics, and pharmaceutical manufacturing sectors whose decoration requirements are being progressively addressed by direct to shape technology adoption. European printing equipment manufacturers including Koenig and Bauer, Durst, and Hinterkopf have developed strong direct to shape system portfolios that serve both domestic and international markets from their European technology development base.
Asia Pacific Direct to Shape Printer Market Insights
Asia Pacific is the fastest-growing regional direct to shape printer market, projected to expand at a CAGR of approximately 12.84% through 2035, driven by the rapid growth of its beverage, personal care, and pharmaceutical manufacturing sectors, expanding middle-class consumer demand for premium branded products, and government manufacturing excellence and packaging quality improvement programmes in China, India, Japan, South Korea, and Southeast Asian nations. China accounts for approximately 38.47% of Asia Pacific revenues through its enormous manufacturing base, growing e-commerce driven brand differentiation demand, and the progressive adoption of European and domestic direct to shape printing technology at its packaging production facilities. India is growing fastest within the region as its expanding food, beverage, and personal care manufacturing sectors seek packaging quality improvements that differentiate products in a competitive domestic retail environment.
MEA & Latin America Direct to Shape Printer Market Insights
Middle East and Latin America are growing direct to shape printer markets where expanding manufacturing sectors, premium brand proliferation, and growing regulatory attention to packaging sustainability are creating incremental demand for advanced packaging decoration technology. The UAE leads MEA revenues at approximately 22.84% of the regional total through its concentration of premium consumer goods manufacturing and distribution operations in its free trade zone industrial clusters whose international brand owner tenants specify world-class packaging decoration quality. Brazil leads Latin American revenues at approximately 43.84% of the regional total through its large beverage, personal care, and food manufacturing sector that collectively represents a significant potential direct to shape printing adopter base as the technology's commercial economics become progressively more accessible to mid-scale domestic manufacturers.
Market Dynamics
Growth Drivers: Consumer demand for premium customized packaging and brand sustainability commitments driving label elimination are creating market expansion.
The convergence of brand owner interest in premium packaging differentiation and regulatory pressure to reduce label material waste is creating a uniquely aligned dual-driver commercial environment for direct to shape printing. Brand owners are investing in packaging quality as a competitive differentiator at the retail point of sale, and digital printing's flexibility and variable data capability are uniquely suited to delivering that differentiation. Drivers based on compliance with EU Packaging Directive, UK Plastic Packaging Tax, as well as similar regulations in Australia and Canada, provide an additional rationale for getting rid of labels whose superiority is evident compared to direct-to-shape printing, where packages are manufactured without labels.
Restraints: High capital investment requirements for production-grade direct to shape systems and the technical complexity of integrating digital printing constrain adoption among mid-scale manufacturers.
Production-grade direct to shape printing systems capable of operating at speeds compatible with existing high-volume packaging lines represent capital investments of USD 500,000 to USD 3 million or more per installation depending on throughput specification, substrate versatility, and automation level. These investment thresholds restrict early adoption to larger manufacturers with the capital resources and production volumes to justify the ROI within commercially acceptable payback periods. Technical integration of direct to shape printing into existing container production and filling line configurations requires engineering customization, safety validation, and production process qualification that adds both time and cost to the adoption journey. Ink adhesion and regulatory compliance qualification for direct-to-container food and pharmaceutical packaging requires materials testing and documentation that adds further technical barrier for new entrant applications.
Opportunities: Smart packaging integration and expansion into pharmaceutical serialization applications represent high-value growth for direct to shape printing.
Integration of direct to shape printing with smart packaging functionalities will result in a business breakthrough in terms of increasing the application of the technology from being limited to only decorating objects into providing supply chain transparency, customer interaction, and product authentication. The ability to print a different QR code, NFC-capable logo, or digital watermark on each product coming out of the line can offer features that cannot be easily provided using label printing. Serialization, customer interaction, and product authentication cannot be as efficiently and effectively done without using digital direct to shape printing technologies. Serialization and tracking of products based on regulations such as DSCSA (US) and FMD (Europe) in the pharmaceutical industry constitute an important segment in the market with the increasing need for variable data printing.
Recent Developments:
-
2025: Durst Group launched its Tau RSC E direct to shape digital printing platform with AI-driven color management and automated substrate detection, enabling high-speed full-color direct-to-container decoration.
-
2025: INX International expanded its InxFlex direct to shape printing programme across U.S. craft brewery and beverage co-packer networks, demonstrating economically viable direct-to-can decoration.
-
2024: Koenig and Bauer AG launched an updated version of its DirectJet direct to shape printing system with enhanced UV-LED curing efficiency and improved substrate registration accuracy for asymmetric container geometries, targeting the premium spirits and cosmetics packaging segments.
Direct to Shape Printer Market key players are:
-
Durst Group AG
-
Koenig and Bauer AG
-
OMSO S.p.A.
-
Xerox Corporation
-
Hinterkopf GmbH
-
Velox Ltd.
-
Tonejet Ltd.
-
Colordyne Technologies
-
Engineered Printing Solutions
-
Kammann Maschinenbau GmbH
-
Mimaki Engineering Co. Ltd.
-
Machines Dubuit SAS
-
Sun Chemical Corporation
-
Printware LLC
-
MS Printing Solutions S.r.l.
-
Digital Printing Systems GmbH
-
Scodix Ltd.
-
Deco Technology Group Inc.
-
Markem-Imaje SAS
-
Alltub Group
Direct to Shape Printer Market Report Scope:
| Report Attributes | Details |
|---|---|
| Market Size in 2025 | USD 3.23 Billion |
| Market Size by 2035 | USD 8.71 Billion |
| CAGR | CAGR of 10.45% From 2026 to 2035 |
| Base Year | 2025 |
| Forecast Period | 2026-2035 |
| Historical Data | 2022-2024 |
| Report Scope & Coverage | Market Size, Segments Analysis, Competitive Landscape, Regional Analysis, DROC & SWOT Analysis, Forecast Outlook |
| Key Segments | • By Printer Type (Single Pass Printers, Multi-Pass Printers) • By Technology (Inkjet Printing, Laser Printing) • By Ink Type (UV-Curable Inks, Solvent-Based Inks, Aqueous-Based Inks, Others) • By Application (Bottles & Containers, Cans & Cylindrical Objects, Cosmetic & Personal Care Packaging, Pharmaceutical Packaging, Others) • By End User (Food & Beverage Industry, Cosmetics & Personal Care, Pharmaceuticals, Industrial & Automotive, Others) |
| Regional Analysis/Coverage | North America (US, Canada), Europe (Germany, UK, France, Italy, Spain, Russia, Poland, Rest of Europe), Asia Pacific (China, India, Japan, South Korea, Australia, ASEAN Countries, Rest of Asia Pacific), Middle East & Africa (UAE, Saudi Arabia, Qatar, South Africa, Rest of Middle East & Africa), Latin America (Brazil, Argentina, Mexico, Colombia, Rest of Latin America). |
| Company Profiles | Durst Group AG, Koenig and Bauer AG, OMSO S.p.A., Xerox Corporation, Hinterkopf GmbH, Velox Ltd., Tonejet Ltd., Colordyne Technologies, Engineered Printing Solutions, Kammann Maschinenbau GmbH, Mimaki Engineering Co. Ltd., Machines Dubuit SAS, Sun Chemical Corporation, Printware LLC, MS Printing Solutions S.r.l., Digital Printing Systems GmbH, Scodix Ltd., Deco Technology Group Inc., Markem-Imaje SAS, Alltub Group |
Frequently Asked Questions
North America dominated the market in 2025, holding approximately 34.82% of global revenues.
The bottles & containers segment dominated the market with 43.00% share in 2025.
The primary growth factors are growing brand owner demand for premium customized packaging decoration that eliminates label limitations, sustainability-driven regulatory pressure to reduce packaging material complexity.
The direct to shape printer market was valued at USD 3.23 Billion in 2025.
The direct to shape printer market is expected to grow at a CAGR of 10.45% from 2026 to 2035.
Get in Touch
