Drone-Based Floodplain Mapping Market Size & Growth:
The Drone-Based Floodplain Mapping Market was valued at USD 1.24 billion in 2025 and is expected to reach USD 6.90 billion by 2035, growing at a CAGR of 18.73% from 2026-2035.
The Drone-Based Floodplain Mapping market is rapidly expanding due to the increasing demand for accurate, real-time flood risk assessment and disaster management solutions. As drone technologies allow for rapid large-area surveying, and as early warning systems and predictive flood modeling become essential in vulnerable and disaster-prone regions, Flood Scope will be increasingly relevant. Market growth is being driven by increasing investments in training and capacity-building to enable autonomous and effective operation of drones. Governmental emphasis on developing climate resilience, sustainable development and technological advancement contributes significantly to the adoption.
In order to improve real-time disaster monitoring and early warning as well as flood resilience, the African Development Bank, Mozambique and Korea today launched a drone-based flood management project in the southern region of the African nation. The USD 967,000 program will involve training local professionals and is designed to scale-up drone technology for climate disaster preparedness throughout Africa.
Drone-Based Floodplain Mapping Market Size and Forecast
-
Market Size in 2025: USD 1.24 Billion
-
Market Size by 2035: USD 6.90 Billion
-
CAGR: 18.73% from 2026 to 2035
-
Base Year: 2025
-
Forecast Period: 2026–2035
-
Historical Data: 2022–2024

To Get more information On Drone-Based Floodplain Mapping Market - Request Free Sample Report
Drone-Based Floodplain Mapping Market Trends
-
Rising need for accurate flood risk assessment and disaster management is driving the drone-based floodplain mapping market.
-
Growing adoption of UAVs equipped with LiDAR, multispectral, and high-resolution imaging is boosting market growth.
-
Expansion across government agencies, environmental organizations, and urban planning authorities is fueling deployment.
-
Increasing focus on real-time data collection, GIS integration, and predictive modeling is shaping adoption trends.
-
Advancements in AI, machine learning, and remote sensing technologies are enhancing mapping accuracy and efficiency.
-
Rising investments in climate resilience, flood monitoring, and infrastructure planning are supporting market expansion.
-
Collaborations between drone manufacturers, software providers, and research institutions are accelerating innovation and global adoption.
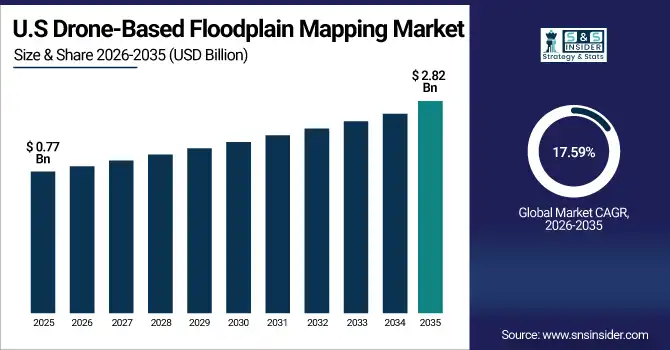
The U.S Drone-Based Floodplain Mapping Market size was valued at USD 0.77 Billion in 2025 and is projected to reach USD 2.82 Billion by 2035, growing at a CAGR of 17.59% during 2026-2033. driven by the growing need for precise and timely flood risk assessments to protect vulnerable communities and infrastructure. The increasing frequency of climate-related disasters and supportive government initiatives promoting advanced disaster management technologies fuel Drone-Based Floodplain Mapping Market Growth. Enhanced drone capabilities, including high-resolution imaging and real-time data processing, enable efficient large-area monitoring and early warning systems.
Drone-Based Floodplain Mapping Market Growth Drivers:
-
Enhanced Technical Capacity Boosts Demand for Drone-Based Floodplain Mapping
The growing demand for accurate and timely flood risk assessment is driving the adoption of drone-based floodplain mapping solutions. Enhancing technical expertise in orthophoto mapping through drones enables more precise and high-resolution data collection, which is vital for effective flood risk analysis and early response. Consequently, governments and agencies are increasingly investing in drone technology training and infrastructure to strengthen climate resilience. This improvement in flood monitoring accuracy and responsiveness fosters greater adoption of drone-based mapping services, creating a positive feedback loop that accelerates market growth and supports sustainable disaster risk management worldwide.
Specialized drone basic training from Belize's Ministry of Sustainable Development is practicing proper detail flood mapping of isolated flooded areas through orthophoto mapping to enhance the flood warning systems. It further strengthens domestic capacity to undertake precise flood risk assessments and preparedness for flooding between various relevant government agencies.
Drone-Based Floodplain Mapping Market Restraints:
-
Regulatory Restrictions and Technical Challenges Limit Drone-Based Floodplain Mapping Growth
The Drone-Based Floodplain Mapping market faces significant restraints due to strict regulatory frameworks governing drone operations, including airspace restrictions, privacy laws, and complex licensing processes. These regulations often delay project approvals and increase operational costs, restricting market expansion. Additionally, technical challenges such as limited drone battery life, adverse weather conditions, and complexities in data processing and analysis reduce mapping efficiency and accuracy. These constraints hinder the continuous and large-scale deployment of drones for flood monitoring, limiting the technology’s ability to provide real-time, comprehensive floodplain data. As a result, regulatory and technical barriers collectively slow market growth by impeding the widespread adoption of drone-based floodplain mapping solutions worldwide.
Drone-Based Floodplain Mapping Market Opportunities:
-
Enhanced Real-Time Flood Warning Capabilities Drive Growth in Drone-Based Alert Systems Market
These factors are contributing towards the increasing adoption of such systems and thus, driving the global demand for drone-based alert technologies. As a more sophisticated solution, these systems cover the gaps of the traditional warning techniques in two ways; they can issue warnings instantaneously and in realtime (i.e., during the event), and in turn, ones that boost public safety and disaster turnout. This leaves immense potential for drone-based disaster alert systems —particularly in at-risk coastal areas around the globe. The expanded availability will enhance resilience in local communities, lower the risk from disasters, and allow for more effective emergency management to save lives and reduce property damage during natural disasters.
Japan uses drone patrols with speakers linked to the national J-Alert system to warn beachgoers of tsunamis, enhancing real-time evacuation efforts. This innovative approach improves disaster response by overcoming limitations of traditional alert methods, ensuring timely and effective warnings in coastal areas.
Drone-Based Floodplain Mapping Market Challenges:
-
Regulatory and Technical Barriers Limit Drone-Based Floodplain Mapping Expansion
The growth of drone-based floodplain mapping faces significant challenges due to strict regulatory constraints, including airspace restrictions, privacy concerns, and complex licensing processes. Airspace and privacy restrictions along with cumbersome licensing and approval processes make widespread use of drones for even local and inexpensive mapping in conditions of normal operation highly problematic. Combined, they postpone deployments and elevate cost of operations and thus, limiting the widespread market usage. It also needs more skilled operators, and heavier upfront capital cost, which is a barrier for smaller organizations. The confluence of these regulatory and technical barriers thus engenders a fundamentally market-inhibiting friction that delays the incorporation of drone technology in flood management systems, and suppresses the technology's ability to deliver market-agnostic on-demand comprehensive flood risk information critical to achieving the necessary level of preparedness and response.
Drone-Based Floodplain Mapping Market Segmentation Outlook:
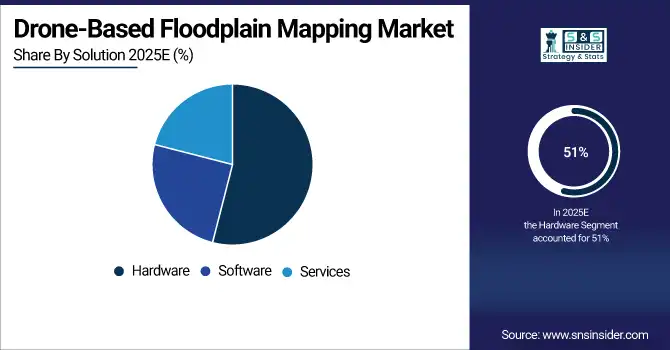
By Solution
In 2025, the Hardware segment accounted for approximately 51% of the Drone-Based Floodplain Mapping Market share, wing to the to the rising demand for the analysis, mapping, and consulting services which require high-specialization data. While more and more organizations are utilizing drones for this type of technology they are often looking to expert dedicated service providers to manage the more complex data processing and interpretation and to provide converted tailor made flood risk assessments. With growing need for real - time monitoring and disaster response support the demand for elastic and on-demand services is driving up.
The Services segment is expected to experience the fastest growth in Drone-Based Floodplain Mapping Market over 2026-2035 with a CAGR of 21.92%, due to increasing demand for specialized data analysis, real-time flood monitoring, and tailored mapping solutions. Organizations often lack the in-house expertise and rely on external service providers to handle complex data processing and deliver actionable insights. This reliance accelerates adoption of drone-based floodplain mapping, enabling faster, more efficient disaster preparedness and response while reducing operational burdens and costs across various industries and government agencies.
By Application
In 2025, the Flood Risk Assessment segment accounted for approximately 30% of the Drone-Based Floodplain Mapping Market share, ue to the critical need for timely and accurate flood risk data for supporting disaster preparedness and mitigation. The rising level of floods across the globe is forcing the authorities and agencies to adjust more sophisticated drone mapping solutions that offer high-resolution, timely data for accurate risk assessment. This facilitates planning, infrastructure design, and emergency response, driving the need and growth of flood risk assessment applications under this market.
The Disaster Management segment is expected to experience the fastest growth in Drone-Based Floodplain Mapping Market over 2026-2035 with a CAGR of 19.59%, as a rapid, accurate data is required to improve emergency response and recovery efforts during floods and natural disasters. The drone data provides real-time mapping of the floodplain allowing authorities to repair damage, distribute resources, and coordinate rescue efforts. The increased government investment in disaster resilience and efforts to promote and adopt state-of-the-art technologies will continue to support and drive demand, and made this area a fastest-growing segment for drone-based floodplain mapping market.
By End User
In 2025, the Government & Public Safety segment accounted for approximately 35% of the Drone-Based Floodplain Mapping Market share, due to growing application of drone-based floodplain mapping for disaster preparedness, emergency response, and infrastructure planning. With an increased need to keep communities and critical assets safe, governments continue to allocate more funds towards drone technology to improve public safety and environmental monitoring abilities, especially through precise and real-time data collection.
The Agriculture segment is expected to experience the fastest growth in Drone-Based Floodplain Mapping Market over 2026-2035 with a CAGR of 19.99%, driven by the the need for accurate flood risk data to protect crops, manage irrigation, and maximizing land use continue to increase. Floodplain mapping with drones assists farmers in evaluating water impact, minimizing soil erosion, and improving yield estimation leading to high adoption, The growing focus on climate-resilient and sustainable agricultural practices also drives market growth in the agriculture sector.
By Platform
In 2025, the Fixed-Wing Drones segment accounted for approximately 45% of the Drone-Based Floodplain Mapping Market share, owing to longer flight endurance and making it most suitable choice for covering greater floodplain areas in an efficient manner. Such drones are highly accurate mapping which are critical for detailed flood risk assessment and disaster management through normal high resolution mapping data. Wide usage of drones that are cost-effective and suitable for large-scale monitoring of flood plains is resulting in huge adoption of drones for floodplain mapping, which is contributing significantly towards growth of the market.
The Hybrid Drones segment is expected to experience the fastest growth in Drone-Based Floodplain Mapping Market over 2026-2035 with a CAGR of 21.36%, growing on account of the features of endurance of fixed-wing drones, and vertical takeoff and landing capabilities of rotary wing drones, combined in hybrid drones. This flexibility enables deployment over a range of terrain types while enhancing performance in challenging floodplain structures. Due to its flexibility and quick set-up in case of flooding or disaster response, such drones are highly demanded from Central Government, which results in rapid growth for the segment in the market.
Drone-Based Floodplain Mapping Market Regional Insights:
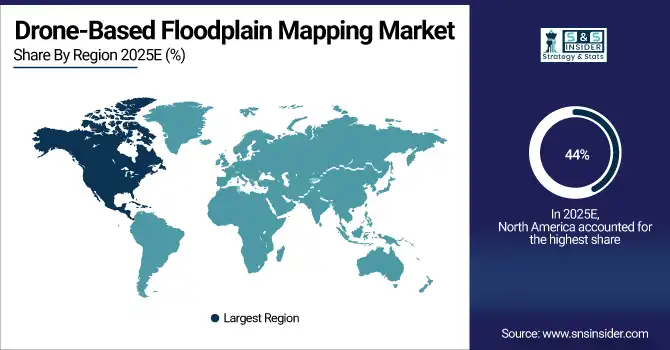
North America Drone-Based Floodplain Mapping Market Insights
In 2025 North America dominated the Drone-Based Floodplain Mapping Market and accounted for 44% of revenue share, due to developed technological infrastructure, high government investment in disaster management as well as increase in use of drone technology for flood monitoring across the region. The region has been emphasizing on strengthening public safety and the existing regulatory framework along with established domestic drone manufacturers are expected to provide a high pace of integration of drone based solutions, such as floodplain mapping, and thus, significant market growth and revenue share.
Get Customized Report as per Your Business Requirement - Enquiry Now
Asia Pacific Drone-Based Floodplain Mapping Market Insights
Asia-Pacific is expected to witness the fastest growth in the Drone-Based Floodplain Mapping Market over 2026-2035, with a projected CAGR of 20.58%, growing demand for advanced drone technologies, and escalating adoption of climate change-related risks awareness. Proliferating government efforts to strengthen disaster preparedness coupled with the region's susceptibility to regular flood threat are key drivers augmenting demand for fast, on-demand floodplain mapping solutions propelling market growth.
Europe Drone-Based Floodplain Mapping Market Insights
In 2025, Europe emerged as a promising region in the Drone-Based Floodplain Mapping Market, driven by strong emphasis on climate resilience, sustainability, and digital transformation. Government policies supporting advanced environmental monitoring, coupled with ongoing investments in smart infrastructure and disaster management technologies, are accelerating adoption. Collaborative research initiatives and growing awareness of flood risks further boost demand for innovative drone mapping solutions across the region.
Middle East & Africa and Latin America Drone-Based Floodplain Mapping Market Insights
Latin America (LATAM) and the Middle East & Africa (MEA) regions are witnessing steady growth in the Drone-Based Floodplain Mapping Market, due to increasing investments in disaster management and flood risk mitigation. Expanding telecom infrastructure, urbanization, and rising climate vulnerability drive demand for efficient drone-based mapping solutions. Supportive government initiatives and growing awareness of environmental risks further promote adoption of advanced floodplain monitoring technologies in these regions.
Drone-Based Floodplain Mapping Market Competitive Landscape:
DJI Innovations
DJI Innovations is a global leader in civilian drones and aerial imaging technology. Its enterprise and consumer drones serve mapping, surveying, inspection, and media industries, integrating advanced sensors, AI, and intelligent flight systems. DJI develops software, payloads, and automation tools that enhance efficiency and precision in aerial data capture, GIS, and photogrammetry workflows. Its solutions support industries from agriculture and construction to emergency response and environmental monitoring worldwide.
-
2025 – DJI launched the Matrice 4 Series drones with AI-enabled Smart 3D Capture for high-resolution mapping and automated aerial survey workflows.
-
2025 – DJI updated its U.S. geofencing system to align with FAA Remote ID rules, enhancing flight safety and operator responsibility.
Wingtra AG
Wingtra AG specializes in fixed-wing VTOL drones for professional mapping and surveying. Its WingtraOne series integrates LiDAR and photogrammetry payloads, enabling large-area, high-precision 3D terrain capture. Wingtra focuses on geospatial, floodplain, and industrial survey applications, providing automated workflows, centimeter-level accuracy, and advanced data processing. The company’s drones deliver efficient, scalable mapping solutions while combining long endurance, vertical takeoff capabilities, and high-resolution data acquisition for topographic, environmental, and infrastructure projects.
-
2025 – Wingtra launched a LiDAR payload for WingtraOne GEN II, improving photogrammetric and LiDAR workflows for precise 3D terrain and floodplain mapping.
-
2024 – WingtraOne GEN II LiDAR payload release enhanced large-area topographic survey efficiency, enabling automated, high-resolution terrain modeling for mapping projects.
-
2023 – WingtraOne GEN II drone achieved C3 class certification in Europe, enabling broader commercial aerial surveys and large-area mapping operations.
Trimble Inc. (with DroneDeploy)
Trimble provides geospatial, construction, and survey solutions integrating GNSS, LiDAR, and drone technologies. Its platforms deliver precise positioning, automated mapping workflows, and real-time data capture for construction, floodplain modeling, and terrain analysis. Trimble partners with DroneDeploy to enhance cloud-based reality capture and centimeter-level survey accuracy. Its tools streamline data collection, post-processing, and GIS integration, enabling enterprises to improve efficiency, accuracy, and scalability in aerial mapping and infrastructure monitoring projects.
-
2024 – Trimble and DroneDeploy launched cloud-based PPK GNSS services delivering centimeter-level drone mapping accuracy without base stations.
-
2024 – Trimble integrated Applanix POSPac Cloud PPK with DroneDeploy platform, streamlining high-precision workflows for aerial terrain and floodplain surveys.
Key Players
Some of the Drone-Based Floodplain Mapping Market Companies
-
Parrot SA
-
Trimble Inc.
-
AeroVironment Inc.
-
senseFly
-
PrecisionHawk
-
Delair
-
3D Robotics
-
Teledyne FLIR
-
AgEagle Aerial Systems
-
Microdrones
-
RIEGL Laser Measurement Systems
-
DroneDeploy
-
Pix4D
-
Skycatch
-
Kespry
-
Terra Drone Corporation
-
Topcon Positioning Systems
-
Wingtra
| Report Attributes | Details |
|---|---|
| Market Size in 2025 | USD 1.24 Billion |
| Market Size by 2035 | USD 6.90 Billion |
| CAGR | CAGR of 18.73 % From 2026 to 2035 |
| Base Year | 2025 |
| Forecast Period | 2026-2035 |
| Historical Data | 2022-2024 |
| Report Scope & Coverage | Market Size, Segments Analysis, Competitive Landscape, Regional Analysis, DROC & SWOT Analysis, Forecast Outlook |
| Key Segments | • By Solution(Hardware, Software, Services) • By Application(Flood Risk Assessment, Disaster Management, Urban Planning, Environmental Monitoring, Others) • By End User(Government & Public Safety, Agriculture, Insurance, Construction and Others) • By Platform(Fixed-Wing Drones, Rotary-Wing Drones, Hybrid Drones) |
| Regional Analysis/Coverage | North America (US, Canada), Europe (Germany, UK, France, Italy, Spain, Russia, Poland, Rest of Europe), Asia Pacific (China, India, Japan, South Korea, Australia, ASEAN Countries, Rest of Asia Pacific), Middle East & Africa (UAE, Saudi Arabia, Qatar, South Africa, Rest of Middle East & Africa), Latin America (Brazil, Argentina, Mexico, Colombia, Rest of Latin America). |
| Company Profiles | The Drone-Based Floodplain Mapping market Companies are DJI Innovations, Parrot SA, Trimble Inc., AeroVironment Inc., senseFly, PrecisionHawk, Delair, Quantum Systems, 3D Robotics, Teledyne FLIR, AgEagle Aerial Systems, Microdrones, RIEGL Laser Measurement Systems, DroneDeploy, Pix4D, Skycatch, Kespry, Terra Drone Corporation, Topcon Positioning Systems, Wingtra. and Others. |
Frequently Asked Questions
North America dominated the Drone-Based Floodplain Mapping Market in 2025.
Hardware segment dominated the Drone-Based Floodplain Mapping Market in 2025.
Growing need for accurate, real-time flood risk assessment, disaster management efficiency, and cost-effective large-area surveying.
The Drone-Based Floodplain Mapping Market was valued at USD 1.24 billion in 2025 and is expected to reach USD 6.90 billion by 2035, growing at a CAGR of 18.73% from 2026-2035.
The Drone-Based Floodplain Mapping Market is expected to grow at a CAGR of 18.73% during 2026-2035.
Get in Touch
