Space Power Electronics Market Report Scope & Overview:
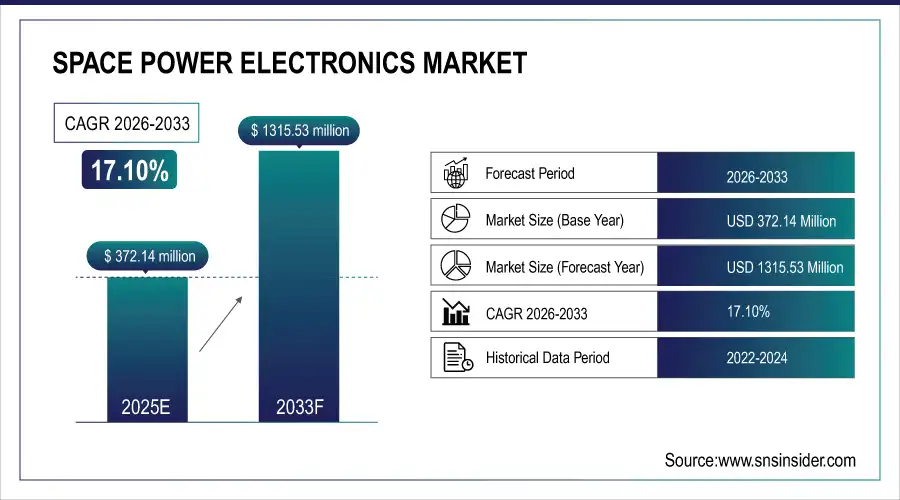
The Space Power Electronics Market size was valued at USD 372.14 Million in 2025E and is projected to reach USD 1315.53 Million by 2033, growing at a CAGR of 17.10% during 2026–2033.
The Space Power Electronics market is witnessing rapid growth driven by the increasing demand for high-efficiency, compact, and reliable power solutions for satellites, spacecraft, and space-grade systems. Radiation-tolerant and radiation-hardened components are critical for ensuring mission reliability in harsh orbital environments, including LEO, MEO, and GEO. The trend toward advanced on-board processing, AI integration, and high-performance communication payloads is fueling the adoption of modular, high-density power architectures. Rising investments from government space programs, commercial satellite operators, and defense initiatives further propel market expansion. Innovations in power management systems, converters, inverters, and thermal management solutions are shaping the competitive landscape.
In August 2025 – Spirit Electronics partners with Vicor to offer radiation-tolerant modular power solutions, enabling high-efficiency, high-density power delivery for satellites, advanced processors, and space-grade applications.
Space Power Electronics Market Size and Forecast:
-
Market Size in 2025E: USD 372.14 Million
-
Market Size by 2033: USD 1315.53 Million
-
CAGR: 17.10% from 2026 to 2033
-
Base Year: 2025E
-
Forecast Period: 2026–2033
-
Historical Data: 2022–2024

To Get more information On Nuclear-Radiation Transducers Market - Request Free Sample Report
Space Power Electronics Market Highlights:
-
Rising demand for compact, high-reliability, radiation-hardened power electronics for satellites, spacecraft, and space-grade systems.
-
Adoption of advanced power management solutions ensures system resilience, reduces mission failure risks, and enables efficient, lightweight designs.
-
High costs, complex manufacturing, and strict space-grade compliance pose challenges for developing radiation-tolerant and radiation-hardened components.
-
Continuous innovation in radiation-hardened and modular power solutions drives market growth and supports commercial and government space programs.
-
Expansion of LEO, GEO, and interplanetary missions creates opportunities for high-performance, durable, and cost-effective space power electronics.
-
Increasing integration of AI, FPGA/ASIC payloads, and advanced satellite processing fuels demand for high-density, low-noise power delivery architectures.
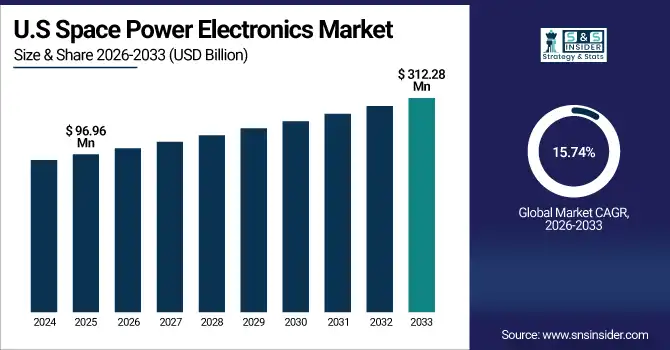
The U.S. Space Power Electronics Market size was valued at USD 96.96 Million in 2025E and is projected to reach USD 312.28 Million by 2033, growing at a CAGR of 15.74% during 2026–2033. Growth is driven by increasing satellite deployments, expansion of commercial and government space programs, and rising demand for high-efficiency, radiation-tolerant, and compact power electronics. Advanced power management systems, converters, inverters, and modular solutions are being adopted to support LEO, MEO, and GEO missions, ensuring reliability, efficiency, and high-performance operations in harsh space environments.

Space Power Electronics Market Drivers:
-
Rising Demand for Radiation-Hardened Space Power Electronics
The Space Power Electronics market is driven by growing demand for compact, high-reliability, and radiation-hardened power management solutions for satellites, spacecraft, and space-grade electronics. These components ensure system resilience, reduce mission failure risks, and enable lighter, more efficient designs, supporting distributed satellite systems, FPGA/ASIC payloads, and deep-space exploration. Increasing commercial and government space programs, coupled with stringent reliability requirements in harsh radiation environments, fuel adoption of advanced power electronics. Continuous innovation in radiation-tolerant components and integrated power management solutions further propels market growth and strengthens the capabilities of modern space missions worldwide.
In October 2025, Infineon launches the RIC70847 rad-hard buck controller with integrated gate driver, enabling high-reliability, compact power management for satellites, FPGAs, and space-grade electronics in harsh radiation environments.
Space Power Electronics Market Restraints:
-
Challenges in Developing Radiation-Hardened Power Solutions for Space Missions
The Space Power Electronics market faces challenges due to the high costs of designing, testing, and manufacturing radiation-tolerant and radiation-hardened components. Strict compliance with space-grade standards, extensive reliability testing, and limited availability of specialized materials increase production complexity and expenses. Additionally, long development cycles, rapid technological changes, and the need for ultra-reliable performance in harsh space environments constrain adoption. Smaller companies and emerging markets may struggle to invest in these high-cost solutions. These technical and financial barriers limit market penetration, slow commercialization, and pose significant challenges for new entrants seeking to compete in the space power electronics industry.
Space Power Electronics Market Opportunities:
-
Growing Demand for Radiation-Hardened Space Power Electronics
The increasing complexity of space missions and rising adoption of satellites, deep-space exploration, and advanced spacecraft are driving demand for radiation-tolerant and radiation-hardened components. These components mitigate total ionizing dose and single-event effects, ensuring mission reliability and longevity. As commercial space programs expand alongside government initiatives, the need for resilient, high-performance power electronics presents significant market opportunities. Manufacturers can capitalize on the trend by developing cost-effective, durable components suitable for harsh orbital environments. Growth is further supported by LEO, GEO, and interplanetary mission expansions, creating a robust market for advanced space power electronics solutions.
In June 2025 – Radiation-tolerant and radiation-hardened components ensure reliable space power systems by mitigating radiation effects, reducing mission failure risks, and supporting long-term, cost-effective operations in harsh space environments.
Space Power Electronics Market Segment Highlights:
-
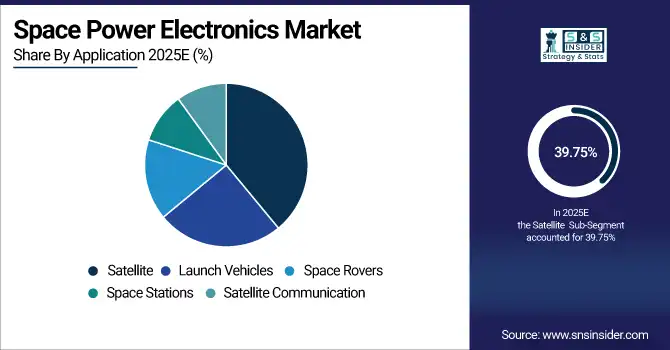
By Product Type: Dominant – Power Management Systems (35.38% in 2025 → 37.63% in 2032); Fastest-Growing – Inverters (CAGR 19.10%)
-
By Component: Dominant – Semiconductors (40.25% in 2025 → 41.56% in 2032); Fastest-Growing – Thermal Management Components (CAGR 19.97%)
-
By Application: Dominant – Satellite (39.75% in 2025 → 38.44% in 2032); Fastest-Growing – Space Rovers (CAGR 19.10%)
-
By End Use: Dominant – Government Space Agencies (49.38% in 2025 → 46.09% in 2032); Fastest-Growing – Commercial Space Companies (CAGR 19.69%)
Space Power Electronics Market Segment Analysis:
By Product Type, Power Management Systems Dominating and Inverters Fastest-Growing
Power Management Systems remain the dominant product type in both 2025 and 2032, holding the largest market share due to their critical role in providing efficient power regulation, distribution, and reliability across space missions. Inverters represent the fastest-growing segment, driven by increasing adoption in satellite power systems, propulsion units, and spacecraft energy conversion needs, supporting higher efficiency and operational flexibility in next-generation space platforms.
By Component, Semiconductors Dominating and Thermal Management Components Fastest‐Growing
Semiconductors remain the dominant component segment in both 2025 and 2032, supported by their essential role in spacecraft control, signal processing, power conversion and communication architectures. Meanwhile, Thermal Management Components form the fastest-growing segment, driven by increasing heat dissipation demands in high-power satellite systems, electric propulsion units and radiation-intense deep-space missions.
By Application, Satellite Dominating and Space Rovers Fastest‐Growing
Satellite continues to dominate the application segment in 2025 and 2032 due to sustained government funding, strong commercial satellite constellations and rising demand for navigation, communication and Earth observation platforms. In comparison, Space Rovers are the fastest-growing application, propelled by expanding lunar and Mars exploration programs and investments in autonomous robotic spacecraft technologies.

By End Use, Government Space Agencies Dominating and Commercial Space Companies Fastest‐Growing
Government Space Agencies remain the dominant end-use segment in 2025 and 2032, supported by major national investments in deep-space missions, satellite defense networks and scientific exploration initiatives. Meanwhile, Commercial Space Companies lead growth, fueled by private launch services, satellite manufacturing expansion and increasing capital inflow into commercial space ventures.
Space Power Electronics Market Regional Highlights:
-
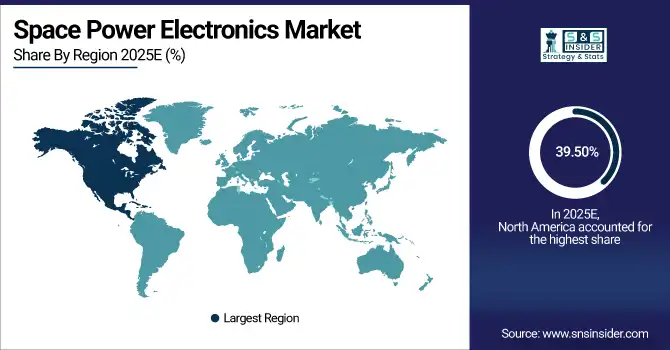
North America: In 2025 39.50% → 36.50% in 2033, Dominating Region, Moderate Decline (CAGR 15.95%)
-
Asia-Pacific: In 2025 30.63% → 34.38% in 2033, Fastest-Growing Region, Strong Expansion (CAGR 18.79%)
-
Europe: In 2025 19.88% → 19.13% in 2033, Stable Second-Tier Market, Slight Decline (CAGR 16.54%)
-
Latin America: In 2025 5.13% → 5.88% in 2033, Emerging Market, Strong Growth (CAGR 19.10%)
-
Middle East & Africa: In 2025 4.88% → 4.13% in 2033, Small Developing Market, Mild Decline (CAGR 14.66%)
Space Power Electronics Market Regional Analysis:
North America Space Power Electronics Market Insights:
North America dominates the Space Power Electronics market, driven by strong government funding, advanced satellite launch programs, and the presence of major aerospace and semiconductor companies. Robust R&D investments, rapid technology adoption, and expanding commercial space initiatives further enhance regional leadership and sustain long-term growth momentum.

Get Customized Report as per Your Business Requirement - Enquiry Now
United States Space Power Electronics Market Insights:
The United States leads the Space Power Electronics market owing to strong NASA and defense funding, advanced manufacturing capabilities, major industry players, and growing commercial space activities driving continuous innovation and market expansion.
Asia-Pacific Space Power Electronics Market Insights:
Asia-Pacific is the fastest-growing region in the Space Power Electronics market, driven by rapid satellite deployment, expanding national space programs, increasing investments from China, India, and Japan, and strong government funding. Growing commercial space startups and rising demand for launch services further accelerate market expansion across the region.
China Space Power Electronics Market Insights:
China dominates the Space Power Electronics market presence through strong manufacturing capacity, competitive pricing, and technology exports, supporting satellite components, semiconductor supply, and increasing collaboration with U.S. aerospace companies.
Europe Space Power Electronics Market Insights:
The Europe Space Power Electronics market is witnessing emerging trends driven by increasing satellite missions, defense modernization, and investments in advanced power management systems. Growth is supported by government space programs, R&D initiatives, collaborations between aerospace companies, and the adoption of innovative electronics technologies for satellites, launch vehicles, and space stations.
Germany Space Power Electronics Market Insights:
Germany dominates the Space Power Electronics market due to strong aerospace infrastructure, advanced R&D capabilities, government-backed space programs, and the presence of leading electronics manufacturers driving innovation and high-quality spacecraft components.
Latin America Space Power Electronics Market Insights:
The Latin America Space Power Electronics market is steadily expanding, driven by growing government investments in satellite technology, emerging commercial space ventures, and regional collaborations. Increasing demand for communication satellites, defense applications, and space research initiatives is accelerating market growth and fostering development of local electronics manufacturing capabilities.
Brazil Space Power Electronics Market Insights:
Brazil is the dominant country in the Latin America Space Power Electronics market, supported by government space programs, satellite development initiatives, and strong aerospace infrastructure driving regional growth and technological advancements.
Middle East & Africa Space Power Electronics Market Insights:
The Middle East and Africa Space Power Electronics market is witnessing moderate growth, driven by increasing investments in satellite communication, defense modernization, and regional space initiatives. Expanding government programs, partnerships with global aerospace companies, and gradual adoption of advanced electronics technologies are supporting steady market development across the region.
United Arab Emirates (UAE) Space Power Electronics Market Insights:
The United Arab Emirates (UAE) is generally considered the dominant country, driven by its strong investments in satellite programs, space exploration initiatives like the Mars Hope Probe, and partnerships with international aerospace companies.
Space Power Electronics Market Competitive Landscape:
Honeywell International Inc., established in 1906 and headquartered in the U.S., is a major aerospace and space electronics provider offering avionics, navigation, power, and satellite communication systems. It supports commercial, defense, and space programs globally, delivering high-reliability technologies and improving aerospace electronics supply efficiency in the space power electronics market.
-
In October 2025, Honeywell reports improvement in aerospace electronics supply chain, particularly avionics, navigation, and satellite communications, despite ongoing material and labor shortages
Safran, established in 2005, is a global high-technology group specializing in aviation, defense, and space solutions. The company delivers advanced aerospace systems, avionics, electronics, propulsion, and safety equipment to international markets. Safran focuses on innovation, R&D excellence, and strong industrial partnerships to enhance operational efficiency, sustainability, and mission-critical performance worldwide.
-
In February 2025 – Safran Electronics & Defense announced the opening of a new electronics production site and an R&D center in Bengaluru, strengthening local manufacturing and innovation under the Make in India initiative.
Space Power Electronics Market Key Players:
-
Infineon Technologies AG
-
Texas Instruments Incorporated
-
STMicroelectronics N.V.
-
Onsemi
-
Renesas Electronics Corporation
-
BAE Systems plc
-
Analog Devices, Inc.
-
Microchip Technology Inc.
-
Cobham Limited
-
RUAG Group
-
Mitsubishi Electric Corporation
-
Heico Corporation
-
Honeywell International Inc.
-
TT Electronics
-
Toshiba Corporation
-
Harris Corporation
-
Safran SA
-
Skyworks Solutions, Inc.
-
Maxim Integrated (now part of Analog Devices)
-
NXP Semiconductors
| Report Attributes | Details |
| Market Size in 2025E | USD 372.14 Million |
| Market Size by 2033 | USD 1315.53 Million |
| CAGR | CAGR of 17.10% From 2026 to 2033 |
| Base Year | 2025E |
| Forecast Period | 2026-2033 |
| Historical Data | 2022-2024 |
| Report Scope & Coverage | Market Size, Segments Analysis, Competitive Landscape, Regional Analysis, DROC & SWOT Analysis, Forecast Outlook |
| Key Segments | • By Product Type(Power Distribution Units, Power Conditioning Units, Power Management Systems, Converters and Inverters) • By Component(Semiconductors, Passive Components, Magnetic Components, Connectors and Thermal Management Components) • By Application(Satellite, Launch Vehicles, Space Rovers, Space Stations and Satellite Communication) • By End Use(Government Space Agencies, Commercial Space Companies, Educational Institutions and Research Organizations) |
| Regional Analysis/Coverage | North America (US, Canada), Europe (Germany, UK, France, Italy, Spain, Russia, Poland, Rest of Europe), Asia Pacific (China, India, Japan, South Korea, Australia, ASEAN Countries, Rest of Asia Pacific), Middle East & Africa (UAE, Saudi Arabia, Qatar, South Africa, Rest of Middle East & Africa), Latin America (Brazil, Argentina, Mexico, Colombia, Rest of Latin America). |
| Company Profiles | Key players in the Space Power Electronics market include Infineon Technologies AG, Texas Instruments Incorporated, STMicroelectronics N.V., Onsemi, Renesas Electronics Corporation, BAE Systems plc, Analog Devices, Inc., Microchip Technology Inc., Cobham Limited, RUAG Group, Mitsubishi Electric Corporation, Heico Corporation, Honeywell International Inc., TT Electronics, Toshiba Corporation, Harris Corporation, Safran SA, Skyworks Solutions, Inc., Maxim Integrated (now part of Analog Devices), and NXP Semiconductors. |

