Incident and Emergency Management Market Size & Trends:
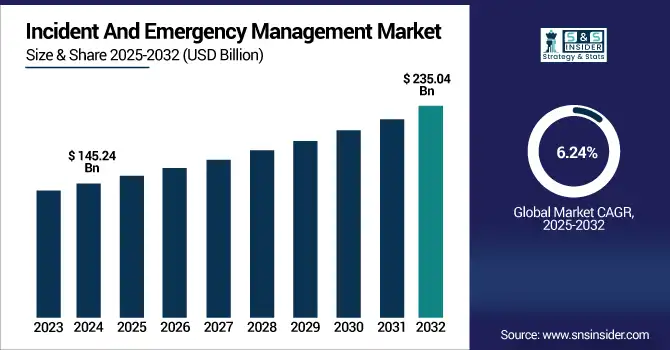
The Incident and Emergency Management Market Size was valued at USD 145.24 billion in 2024 and is expected to reach USD 235.04 billion by 2032 and grow at a CAGR of 6.24% over the forecast period 2025-2032.
To Get more information on Incident and Emergency Management Market - Request Free Sample Report
The Global Market for Incident and Emergency Management report includes a thorough segmentation of the various component types, simulation tools, major verticals, and across regions. Global demand is being driven by increasing climate-related disasters, rapid urbanization, and geopolitical tensions. Incident And Emergency Management Market analysis highlights evolving technology adoption trends globally. In different operational environments, governments, defense forces, healthcare institutions, and utility providers are leveraging AI-enabled and digital solutions to improve situational awareness, response time, and post-incident recovery.
According to a 2024 report by IACP, 72% of public safety departments in developed countries use digital command systems for coordinated incident management.
The U.S. Incident And Emergency Management Market size was USD 39.53 billion in 2024 and is expected to reach USD 62.35 billion by 2032, growing at a CAGR of 5.90% over the forecast period of 2025–2032.
The U.S. market showcased robust growth due to increased investment for the improvement of public safety infrastructure, smart city initiatives, and advanced communication systems. The demand for emergency response solutions is growing even further with frequent natural disasters, civil unrest, and federal programs such as FEMA and homeland security. As the country is a forerunner in implementing advanced technologies for managing incidents, it strengthens its ground for driving steady growth of the regional market in North America.
According to a 2023 PERF study, over 80% of U.S. law enforcement agencies use real-time crime centers and AI-based surveillance.
Incident and Emergency Management Market Dynamics:
Key Drivers:
-
Rising Frequency and Intensity of Natural Disasters are Compelling Governments to Invest in Disaster Preparedness and Response Systems
With wildfires, floods, hurricanes, and earthquakes becoming more frequent, public and private agencies are faced with the challenge of upgrading their emergency management systems. Such threats induced by climate change need real-time information, evacuation planning, and incident response technologies. Government budgets for public safety tools are increasing, and global agencies are promoting the use of risk reduction strategies. In addition to this, climate uncertainty and population in vulnerable areas mean predictive analytics, geospatial tracking, and simulated preparedness will be required to control disaster risk and avoid loss of life.
According to a 2024 Geospatial World study, 70% of disaster management agencies globally now rely on GIS for response and planning.
Restraints:
-
Lack of Awareness and Coordination Among Multiple Agencies Results in Fragmented Emergency Response Operations
The key to effective incident management is a unified collaboration of all the stakeholders involved in an incident, including police, fire departments, medical, and even disaster relief, to secure the information needed to deal with these incidents efficiently. These entities work in silos with systems and protocols that are not in sync and have not updated since the late 1990s in many areas. Which in turn increases response time, duplicating efforts and misallocate resources. Further, poor training, lack of inter-agency data sharing, and vague command hierarchies add to the inefficiencies. These shortcomings in the organization must be remedied to exploit the full potential of emergency management systems.
Opportunities:
-
Integration of AI, IoT, And Data Analytics Presents New Growth Avenues for Real-Time Emergency Response Optimization
The landscape of incident management is changing with emerging technologies. Predictive models powered by AI can predict disaster impact zones whereas IoT-enabled sensors can ensure infrastructure prone to natural calamities can deliver real-time data. Situational awareness is enhanced through physical features such as drones and facial recognition and smart surveillance, while risk trends are identified using big data analytics. Incident And Emergency Management Market growth is being fueled by such innovations. Cloud Based Platforms Enable Remote Command Centers. With this convergence of tech, scalable, intelligent, and automated response solutions will exponentially speed up, improve the accuracy of, and reduce the cost of operations in various industries and parts of the world.
According to the World Economic Forum (2023), AI-powered models have improved disaster impact prediction accuracy by over 30% in high-risk zones.
Challenges:
-
Cybersecurity Threats Targeting Emergency Infrastructure Systems Pose Risks to Operational Reliability and Public Safety
Emergency management systems are largely digital and increasingly connected, so they can easily be the target of cyberattacks. For instance, during crisis events a hacker that is targeting critical communication networks, surveillance platforms, or command centers can cause limitations. Public safety departments in countries across the globe have already fallen victim to ransomware, data breaches, and DDoS attacks. If a disaster scenario involves a compromised system, it can leads to chaos, misinformation and life-threatening delays. At the same time, the need for strong cyber defense and redundancy in the system is a growing challenge for various stakeholders in the ecosystem.
Incident and Emergency Management Market Segmentation Analysis:
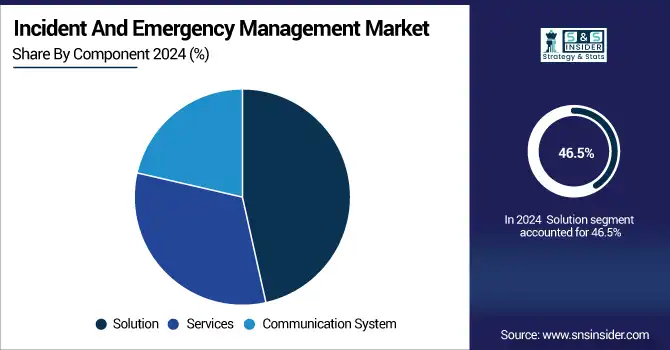
By Component
The solution segment led the Incident and Emergency Management Market share in 2024 by 46.5%. This is driven by growth in the adoption of command and control center, surveillance platforms and emergency response applications. Motorola Solutions, the software giant, is known for ensuring integrated emergency management tools that most defense, government, and industrial sectors use widely. These solutions facilitate decision-making, enhance coordination, and prepare users for multiple incident response scenarios, proving to be vital for efficient disaster management and recovery.
The communication system segment is projected to have the highest CAGR of 6.84% during the period 2024-2032. This is driven by the increasing requirement for seamless, real-time communication during a crisis event. Cisco Systems, a leader in secure and scalable communication platforms, powers numerous emergency operations with its IP-based, wireless networking solutions. Growing need for resilient communication in smart cities and high-risk areas is fueling investments towards solutions that ensure continuous alerting and coordination during geo-hazard events.
By Vertical
The Government & public sector segment held the largest revenue share of 28.3% of the market. Emergency preparedness by governments continues to be led through command centres, deployment of surveillance and mass notification systems. Incident And Emergency Management Market trends reflect growing government focus on resilience. Hexagon AB is a major solution provider for national agencies utilizing advanced GIS and situational intelligence tools. However, the rising regulatory requirements and large-scale infrastructure protection make this segment the centre of attraction among market vendors, especially in natural disaster-prone and civil disturbance regions.
The healthcare and lifesciences segment is anticipated to register the fastest CAGR of 8.44% during the forecast period 2024 –2032. Increasing demand due to growing concern regarding pandemics, biothreats and emergency medical preparedness. Everbridge is a global crisis management platform built to help hospitals activate real-time alerting and coordinate patient movement. Healthcare systems are investing in these types of tools as they need to do disaster drills, rapid evacuation plans, and system-wide response plans for mass casualty and infectious disease events.
By Simulation
In 2024, the incident and evacuation simulation tools segment accounted for the largest Incident and Emergency Management Market share of 42.7%. They are an essential part of pre-incident planning and assistance with risk assessments and evacuation drills. Simulation software provider, AnyLogic also plays an important role helping governments and businesses model real-world emergencies to better prepare for the challenges ahead. The increasing usage in schools, stadiums, airports, and public areas for compliance and risk avoidance makes this segment impossible to be without in modern day emergency management.
The traffic simulation systems segment is estimated to be the fastest-growing segment with a significant CAGR of 7.27% from 2024 to 2032. Traffic flow simulation during disasters with urban congestion for more vehicle density and demand for smart mobility simulation require tools to predict traffic flow. Municipalities have started using traffic modeling solutions by PTV Group to design emergency evacuation routes and traffic control strategies. They are being integrated into smart city infrastructures to facilitate rapid emergency vehicle entry and more efficient urban resilience operations.
Incident and Emergency Management Market Regional Analysis:
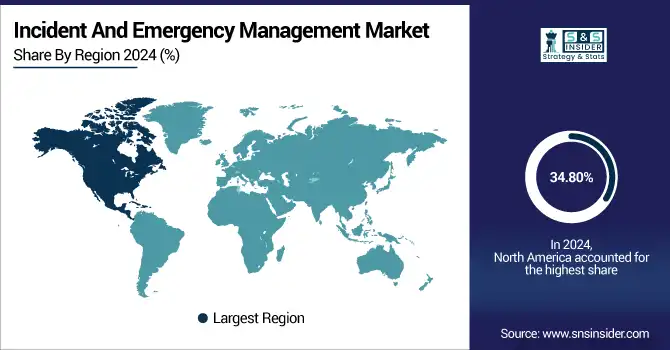
North America accounted for the largest revenue share of 34.80% in the Incident and Emergency Management Market. Ecosystem strength is attributed to existing emergency frameworks and tech vendors in home countries and large investments made in disaster preparedness from the public sector. This is fortuitous for the region, being an early adopter of AI-based surveillance, digital command centers, and state-of-the-art emergency communication systems. Federal and local agencies work together in concert to provide a responsive and efficient incident management infrastructure.
-
The U.S. dominates the North American market due to high federal funding, robust emergency infrastructure, and strong adoption of advanced technologies. Agencies such as FEMA and Homeland Security drive large-scale deployments of surveillance, communication, and incident management systems nationwide.
Asia Pacific region is expected to be growing at the highest CAGR of 7.51% during 2024-2032. Increasing urbanisation, rampant natural disasters such as typhoons and earthquakes and escalating infrastructure vulnerabilities have propelled the rapid growth. Governments are increasing funding for early warning systems, evacuation technologies and civil preparedness. Further, smart city initiatives and global collaborations in disaster resilience technologies are enhancing us readiness capability and spurring market demand in the region.
-
China leads the Asia Pacific market owing to rapid urbanization, frequent natural disasters, and government investment in smart city and emergency preparedness initiatives. The country integrates AI, IoT, and real-time alert systems across cities to enhance national disaster response and resilience.
Europe is a major player in the Incident and Emergency Management industry owing to its regulatory frameworks which require cross-border emergency coordination as well as robust public safety initiatives. Disaster risk reduction, cyber-resilience, and crisis preparedness sector-wise are underscored by the region. Germany, France, the UK–they all have active investments in tools for simulation, warning and multi-agency response, etc.
-
Germany dominates the European Incident and Emergency Management Market due to its robust civil protection systems, strong government funding, and advanced technology adoption. The country emphasizes disaster preparedness, simulation tools, and inter-agency coordination, making it a regional leader in emergency response.
The UAE is leading the Middle East & Africa market as smart city development projects gain momentum and demand continues to rise for civil defense infrastructure as well as emergency systems. Brazil leads in Latin America, with strong federal response frameworks, often numerous local natural hazards and growing interest in disaster prevention and public safety technologies across large urban areas.
Get Customized Report as per Your Business Requirement - Enquiry Now
Incident and Emergency Management Companies are:
Major Key Players in Incident and Emergency Management Market are Honeywell International Inc., Motorola Solutions, Inc., Siemens AG, IBM Corporation, Hexagon AB, NEC Corporation, Everbridge, Inc., Johnson Controls, Esri (Environmental Systems Research Institute), Cisco Systems, Inc and others.
Recent Developments:
-
In October 2024, Honeywell released Pro-Watch 6.5, introducing an Intelligent Command web interface that replaces named pipes with a new Message Broker service—simplifying security administration across distributed sites.
-
In March 2025, Motorola rolled out tactical enhancements in CommandCentral Aware, featuring new color-coded markup on tactical maps, Envysion VMS integration, and enhanced license plate recognition alerts.
| Report Attributes | Details |
|---|---|
| Market Size in 2024 | USD 145.24 Billion |
| Market Size by 2032 | USD 235.04 Billion |
| CAGR | CAGR of 6.24% From 2025 to 2032 |
| Base Year | 2024 |
| Forecast Period | 2025-2032 |
| Historical Data | 2021-2023 |
| Report Scope & Coverage | Market Size, Segments Analysis, Competitive Landscape, Regional Analysis, DROC & SWOT Analysis, Forecast Outlook |
| Key Segments | • By Component (Solution, Services and Communication System) • By Vertical (Commercial and Industrial, IT and Telecom, Energy and Utilities, Healthcare and Lifesciences, Defense and Military, Transportation and Logistics, Government and Public Sector and Others (BFSI, ITES, and Hospitality)) • By Simulation (Traffic Simulation Systems, Hazard Propagation Simulation Tools and Incident and Evacuation Simulation Tools) |
| Regional Analysis/Coverage | North America (US, Canada, Mexico), Europe (Germany, France, UK, Italy, Spain, Poland, Turkey, Rest of Europe), Asia Pacific (China, India, Japan, South Korea, Singapore, Australia, Taiwan, Rest of Asia Pacific), Middle East & Africa (UAE, Saudi Arabia, Qatar, South Africa, Rest of Middle East & Africa), Latin America (Brazil, Argentina, Rest of Latin America) |
| Company Profiles | Honeywell International Inc., Motorola Solutions, Inc., Siemens AG, IBM Corporation, Hexagon AB, NEC Corporation, Everbridge, Inc., Johnson Controls International, Esri (Environmental Systems Research Institute), Cisco Systems, Inc. |
Frequently Asked Questions
Ans: North America dominated the Incident and Emergency Management Market in 2024.
Ans: Government and Public Sector segment dominated the Incident and Emergency Management Market.
Ans: The major growth factor is increasing frequency of natural disasters and terrorist attacks, prompting advanced preparedness and real-time response solutions globally.
Ans: The Incident and Emergency Management Market Size was USD 145.24 billion in 2024 and is expected to reach USD 235.04 billion by 2032.
Ans: The Incident and Emergency Management Marketis expected to grow at a CAGR of 6.24 % from 2025-2032.
Get in Touch
