
Dynamic Line Rating Market Report Scope and Overview:
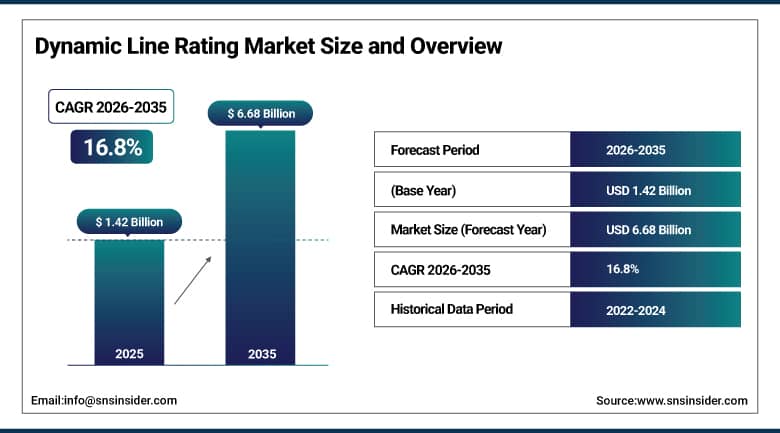
The Dynamic Line Rating Market size was worth USD 1.42 Billion in 2025 and is projected to reach USD 6.68 Billion by 2035, registering a 16.8% CAGR during 2026-2035.
Dynamic Line Rating Market is revolutionizing the way power utilities manage old transmission and distribution lines as it moves away from traditional and cautious ampacity levels to capacity ratings that are weather-dependent and determined using data from actual sensor readings and forecasts. The market can be characterized by increased deployment of non-contact sensors in the power lines that have many renewable sources; increased usage of DLR solutions by combining them with SCADA/energy management systems, and increased mandates on utilities to relieve congestion through non-incremental means such as DLR; and increasing use of DLR technology to fast-track interconnection queues for wind/solar projects.
In June 2026, GE Vernova launched GridOS for Transmission, combining Digital Dynamic Line Rating with sophisticated energy management and forecasting along with other applications related to power grids. This solution offers utilities a single operating environment for making decisions as the demand for electricity rises and transmission network becomes more complex.
To Get More Information On Dynamic Line Rating Market - Request Free Sample Report
Dynamic Line Rating Market Trends
-
Utilities are increasingly deploying non-contact overhead line sensors to unlock hidden thermal headroom on existing corridors.
-
Growing integration of DLR software with SCADA and ADMS platforms continues to shorten renewable interconnection queues.
-
Rising adoption of forecast-based, ahead-of-time DLR is reducing utility reliance on real-time-only rating systems.
-
Expanding FERC Order 881-style mandates are compelling U.S. transmission owners to adopt ambient-adjusted line ratings.
-
Widening wind and solar interconnection backlogs continue driving utility capital allocation toward grid-enhancing technologies.
U.S. Dynamic Line Rating Market Outlook
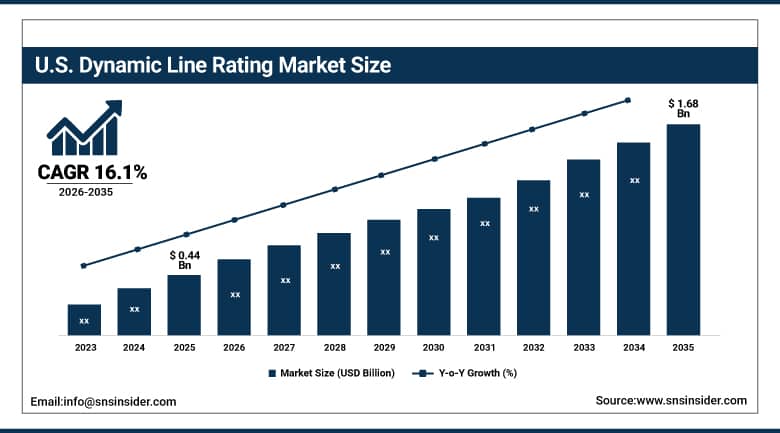
The U.S. Dynamic Line Rating Market was valued at approximately USD 0.44 Billion in 2025 and is projected to reach approximately USD 1.68 Billion by 2035, registering a 16.1% CAGR from 2026 to 2035.
The demand across the U.S. is still being driven by the ambient adjusted rating requirement set out by FERC Order 881, heavy backlog on the interconnection queue for ISO-New England, PJM and ERCOT, and increasing investments by utilities in the non-contact sensors to avoid additional construction of new transmission lines. The increasing cooperation between the transmission companies and the vendors of grid enhancement technologies, along with the clean energy mandate in states, has solidified the nation’s leadership role as the biggest addressable market in North America.
In March 2026, The Tennessee Valley Authority (TVA) has started a pilot project to test Dynamic Line Rating on a 13-mile transmission line. This is in line with the overall initiative of the organization towards technologies that enhance their network capabilities.
Dynamic Line Rating Market Segment Analysis
-
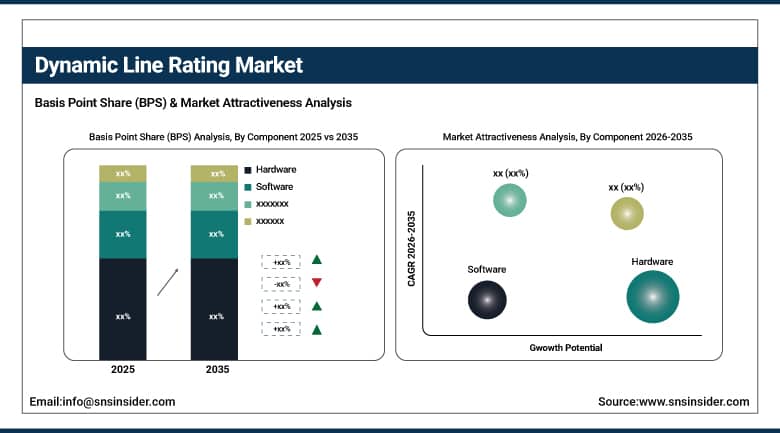
By Component, Hardware segment dominated the Dynamic Line Rating Market in 2025 with 44% share; Software segment is the fastest growing segment, registering a CAGR of 18.9% from 2026 to 2035.
-
By Technology, Sensor-Based Systems segment dominated the market in 2025 with 52% share; Hybrid Systems segment is the fastest growing segment, registering a CAGR of 19.2% from 2026 to 2035.
-
By Application, Transmission Lines segment dominated the market in 2025 with 58% share; Renewable Energy Integration segment is the fastest growing segment, registering a CAGR of 19.6% from 2026 to 2035.
-
By End-User, Utilities segment dominated the market in 2025 with 76% share; Industrial segment is the fastest growing segment, registering a CAGR of 18.7% from 2026 to 2035.
-
By Deployment Type, Retrofit segment dominated the market in 2025 with 63% share; New Installation segment is also the fastest growing segment, registering a CAGR of 18.4% from 2026 to 2035.
By Component, Hardware Leads, While Software Grows Fastest
Hardware was the largest segment of the DLR market in 2025, with dominant offerings consisting of non-contact sensors attached to overhead power lines, weather stations, and conductor-mounted sensor assemblies supplied by suppliers such as Heimdall Power and LineVision. The deployment of sensors remains the key focus for utilities launching their DLR initiatives because the generation of an accurate ampacity forecast hinges on the availability of reliable temperature, sag, and wind-speed measurements in the field prior to any analytics being applied.
Software is the fastest-growing segment due to utilities progressing from single-sensor deployments to enterprise-wide DLR solutions using feeds from weather forecasting services, historical data on loading and SCADA telemetry to create ampacity forecasts. Leading software providers include Ampacimon and Sentient Energy. They are ramping up their cloud-based analytics offerings that integrate seamlessly into current energy management system infrastructure.
By Technology, Sensor-Based Systems Dominate, Hybrid Systems Emerge Fastest
Sensors-based systems were the leading segment in 2025 due to the utilities preference of measuring temperature, sag, and tension via direct, conductor-level sensors instead of purely relying on the weather-model approach. Well-tested non-contact and clamp-mount sensor solutions provided by known players were a low-risk entry into dynamic line rating for utilities while avoiding modification of the current SCADA platform.
The Hybrid Systems combine physical sensors and weather models and demonstrate the highest growth rate among other categories since utilities strive to achieve both accurate real-time data and ampacity forecast for the next day due to congestion planning. Both GE Vernova and Hitachi Energy offered hybrid DLR products combining forecast modeling and physical validation points and thus minimizing the number of required sensors per mile.
By Application, Transmission Lines Lead, While Renewable Energy Integration Grows Fastest
Transmission Lines represented the largest application segment in 2025 due to utilities focusing on decongestion of high-voltage corridors transporting bulk energy from generating stations to consumption centers. The aging state of transmission corridors across North America and Europe, along with the long time required to obtain permits for new lines, has led to dynamic line rating being a quicker way to expand capacity compared to greenfield projects.
Renewable Energy Integration is the fastest-growing application due to delays associated with interconnections for renewables projects. Smart Wires and CTC Global have both noted growth in renewables integration projects using DLR technology to increase capacity on transmission corridors serving wind-rich areas such as the U.S. Midwest and the German northern grid.
By End-User, Utilities Dominate, Industrial Segment Gains Fastest Traction
The utilities became the largest end-users for 2025, since they owned directly transmission and distribution infrastructure and had the regulatory mandate for reliable grid operation. Utilities in investor-owned and public power form in the U.S., UK, and China spearheaded DLR adoption, starting with the implementation of the technology on several congested lines prior to rolling it out network-wide.
The Industrial sector is becoming increasingly attracted to DLR because of the need to see the available capacity in real time on dedicated feeders that serve large facilities, such as data centers or manufacturing campuses. Increasing electricity requirements in industries as a result of data center expansion has motivated some large consumers to deploy DLR together with their utility partners.
By Deployment Type, Retrofit Dominates, New Installation Also Grows Fastest
Retrofit deployment segment was the most commonly deployed in the Dynamic Line Rating Market in 2025 since the utilities preferred to deploy DLR sensors on existing conductors rather than build additional lines, considering the multi-year timeframe required for permits and rights of way acquisition in case of new constructions. Retrofit solutions also have a faster return on investment since the capacity increase would be achieved for already operational and revenue-generating circuits.
The New Installation segment was also developing rapidly due to the increasing number of DLR-compatible design standards that utilities adopted while designing transmission and distribution networks. The growing interest in DLR-compatible conductors and structures was reported by Southwire Company and Valmont Industries in the context of greenfield renewable energy integration.
Regional Analysis:
|
Region |
Major Country |
Share within Region, 2025 (%) |
|---|---|---|
|
North America |
United States |
83.20% |
|
Europe |
Germany |
22.40% |
|
Asia Pacific |
China |
41.50% |
|
Middle East and Africa |
Saudi Arabia |
26.30% |
|
Latin America |
Brazil |
31.80% |
North America Dynamic Line Rating Market Insights
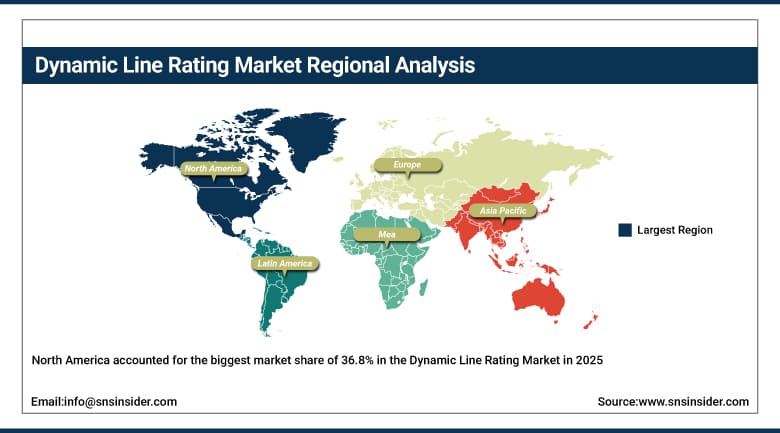
North America accounted for the biggest market share of 36.8% in the Dynamic Line Rating Market in 2025 due to existing early investments by utility companies in advanced grid technologies, mandatory requirement for ambient adjusted rating according to FERC Order 881, and significant backlog of wind and solar projects waiting for interconnection approvals in different independent system operator areas. Pilots that were originally conducted only in congested lines now turn into large-scale implementation of DLR in the whole networks, making the region the leader in terms of addressable market.
The U.S. is a dominant player among countries within the region due to large-scale aging transmission infrastructure, interconnection backlog, and active participation of vendors of grid enhancing technologies, such as LineVision and Smart Wires. Canada, although accounting for smaller share of the market, is also a growing one because of Hydro-Quebec and other provincial utilities, which conduct pilots of DLR in order to trade renewable power between the northeastern US and Canada.
Get Customized Report as Per Your Business Requirement - Enquiry Now
Europe Dynamic Line Rating Market Insights
In 2025, Europe had a considerable market share in the Dynamic Line Rating Market due to ambitious targets for renewables within the European Green Deal and REPowerEU initiative, coupled with regulatory push from the national transmission system operators to avoid expensive overhead lines construction. Interconnector congestion and growing number of offshore wind farms in the North Sea coastlines have fueled utilities' interest in real-time and predictive ampacity solutions for an old high voltage network infrastructure in Europe.
Germany was the top revenue-generating country in Europe, due to northern wind corridors in the country and government support towards building up capacity in the absence of overhead line permits. UK and Nordic countries have also added value to the revenues in the European DLR Market, with the presence of dynamic rating projects with National Grid ESO and some Nordic transmission system operators.
Asia Pacific Dynamic Line Rating Market Insights
The Asia Pacific region is expected to grow at the highest rate in the Dynamic Line Rating market due to huge investments in grid modernization, capacity additions from wind and solar energy sources, and smart grids initiatives backed by governments in China, Japan, and South Korea. Increasing requirements for cross-province transmission of electricity and renewable energy integration policies have assured the region's growth rate exceeds those of others in the market.
China is the top country in the region owing to its huge investments in grid modernization and capacity build-outs of wind and solar energy sources, with NARI Technology providing dynamic rating solutions for State Grid Corporation projects. Japan and South Korea have made significant contributions, too, as Toshiba Corporation provides monitoring systems in utilities scale and Korean grid operators pilot DLR to tackle renewable energy curtailment.
MEA and Latin America Dynamic Line Rating Market Insights
The Middle East & Africa and Latin America both witnessed continuous expansion in the dynamic line rating market due to their growing renewable energy projects, increased investments in grid interconnectivity, and partnerships between regional utilities and overseas providers of grid enhancement solutions. The necessity of real-time capacity assessment turned into a practical priority for utilities in these regions who have traditionally used conservative static line ratings for network planning.
Among MEA countries, Saudi Arabia can be considered the largest market due to the massive renewable energy development in the country according to Vision 2030 and expansion of the transmission grid by the Saudi Electricity Company. Among Latin American countries, Brazil is the biggest contributor to the revenues of this market due to its hydro power transmission grid and wind generation capacity in its northeastern territories.
Market Dynamics:
Growth Drivers: Rising Transmission Congestion and Expanding Renewable Interconnection Backlogs
The drivers of the market include increasing transmission congestion through aging transmission corridors, long multi-year interconnection queues for wind and solar farms, and increasing regulatory pressure like the Federal Energy Regulatory Commission (FERC) Order 881 that requires transmission owners to move towards dynamic line rating from their conventional and cautious ratings. With the increasing electrification needs of data centers, electric vehicles, and industrial reshoring by utilities, DLR represents a much quicker and cost-effective way to boost the transmission capacity compared to building new lines.
Collaborations between the transmission owners and the vendors of grid-technology solutions fuel this trend further with more and more utilities adopting network-level implementations of DLR solutions after having conducted pilot tests on a single corridor basis. Increasing venture capital and corporate investments in the production of sensors, cloud computing solutions, and forecasts is also diversifying the vendor solution set further.
Restraints: Integration Complexity and Utility Risk-Aversion to Real-Time Ratings
Integration with existing SCADA and energy management systems continues to be a real limitation to the growth of the market, since most of the utility companies have control rooms built over decades ago and which are not able to receive high-frequency data from sensors. That is why there is a prolonged period of pilot-to-scale for many transmission owners due to the fact that IT and OT integration often take more time and money than actual installation of the sensors.
Risk averseness of the utility companies to transmitting electricity on transmission lines through dynamic ratings is yet another constraint to the growth of the market, since the operator should make sure of the sensor reliability and stability of communication channels to transmit electricity on ratings which exceed conservative static ones.
Opportunities: AI-Driven Forecasting and Expanding Data Center Interconnection Demand
Increased funding into AI-powered ampacity predictions is truly an opportunity in itself as vendors evolve from just focusing on sag analysis using physics to building more reliable machine learning models that incorporate factors, such as weather predictions, load data, and sensing telemetry to give future predictions of capacity days in advance. Vendors who succeed in creating competitive advantages in the area of predictive models can have an outsized piece of the pie as the industry matures.
Another major growth opportunity is linked to the increasing power requirements of data centers as well as industrial clients who desire to monitor capacity on the feeder supplying power to their facility in real-time. Those vendors who can offer solutions that include rapid deployment DLRs along with easy-to-deploy connections are well placed to exploit these opportunities.
Recent Developments:
-
2026: LineVision, Inc. launched its next-generation LV-Series non-contact sensor platform with integrated AI-based ampacity forecasting, enabling utilities to generate day-ahead capacity forecasts alongside real-time ratings on a single deployed unit.
-
2026: Heimdall Power AS announced the commercial rollout of its Ariel Neuron edge-computing module, allowing its magnetic field-based line sensors to process ampacity calculations on-device and reduce data transmission requirements for remote transmission corridors.
-
2026: Smart Wires Inc. deployed its SmartValve power-flow control units alongside dynamic line rating sensors on a Midwest ISO transmission corridor, combining congestion management and real-time capacity monitoring within a single grid-enhancing technology package.
Dynamic Line Rating Market key players are:
-
LineVision, Inc.
-
Heimdall Power AS
-
Ampacimon SA
-
Nexans S.A.
-
Prysmian Group
-
General Electric (GE Vernova)
-
Siemens Energy AG
-
Hitachi Energy Ltd
-
ABB Ltd
-
Schneider Electric SE
-
Smart Wires Inc.
-
Sentient Energy, Inc.
-
Southwire Company, LLC
-
CTC Global Corporation
-
Valmont Industries, Inc.
-
Lindsey Manufacturing Company
-
Toshiba Corporation
-
Landis+Gyr Group AG
-
Emerson Electric Co.
-
NARI Technology Co., Ltd.
Dynamic Line Rating Market Report Scope:
| Report Attributes | Details |
|---|---|
| Market Size in 2025 | USD 1.42 Billion |
| Market Size by 2035 | USD 6.68 Billion |
| CAGR | 16.8% from 2026 to 2035 |
| Base Year | 2025 |
| Forecast Period | 2026-2035 |
| Historical Data | 2022-2024 |
| Report Scope & Coverage | Market Size, Segments Analysis, Competitive Landscape, Regional Analysis, DROC & SWOT Analysis, Forecast Outlook |
| Key Segments |
|
| Regional Analysis/Coverage | North America (US, Canada), Europe (Germany, UK, France, Italy, Spain, Russia, Poland, Rest of Europe), Asia Pacific (China, India, Japan, South Korea, Australia, ASEAN Countries, Rest of Asia Pacific), Middle East & Africa (UAE, Saudi Arabia, Qatar, South Africa, Rest of Middle East & Africa), Latin America (Brazil, Argentina, Mexico, Colombia, Rest of Latin America). |
| Company Profiles | LineVision, Inc., Heimdall Power AS, Ampacimon SA, Nexans S.A., Prysmian Group, General Electric (GE Vernova), Siemens Energy AG, Hitachi Energy Ltd, ABB Ltd, Schneider Electric SE, Smart Wires Inc., Sentient Energy, Inc., Southwire, Company, LLC, CTC Global Corporation, Valmont Industries, Inc., Lindsey Manufacturing Company, Toshiba Corporation, Landis+Gyr Group AG, Emerson Electric Co., and NARI Technology Co., Ltd. |

Frequently Asked Questions
Key players include LineVision, Inc., Heimdall Power AS, Ampacimon SA, Nexans S.A., Prysmian Group, and General Electric (GE Vernova), among others.
Key opportunities include increasing grid congestion, renewable energy integration, transmission capacity optimization, grid modernization investments, and growing adoption of real-time monitoring technologies.
The major growth factor is rising transmission congestion, expanding renewable interconnection backlogs, and growing regulatory mandates such as FERC Order 881 pushing utilities away from static line ratings.
The Hardware segment dominated the Dynamic Line Rating Market by component, representing the largest share of revenue in 2025.
North America dominated the Dynamic Line Rating Market in 2025, holding an estimated 36.8% share of total global market revenue.
