Dynamic Vision Sensors Market Report Scope & Overview:
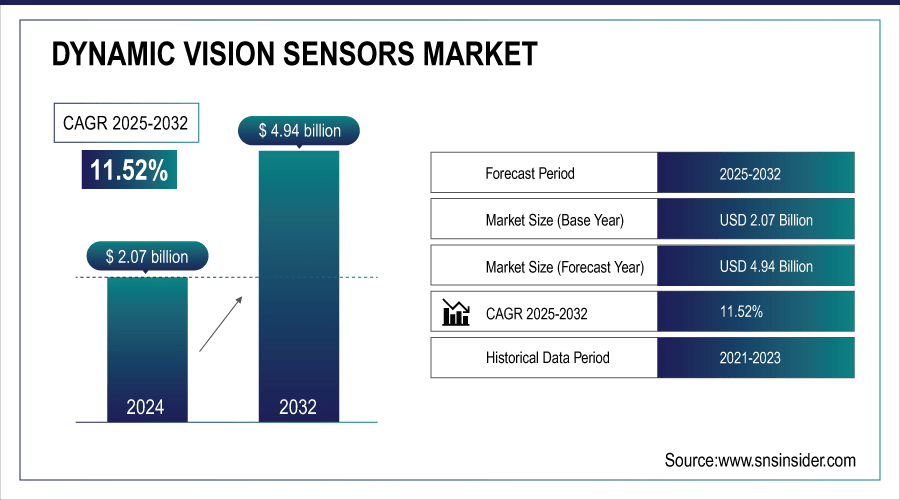
The dynamic vision sensors market size was valued at USD 2.07 billion in 2024 and is expected to reach USD 4.94 billion by 2032 and grow at a CAGR of 11.52% over the forecast period 2025-2032.
The global market is witnessing rapid expansion globally, primarily driven by the accelerative growth in neuromorphic computing, real-time analytical, and high-speed imaging technologies. The report covers regional insights and trends for various components, technologies, applications, and end-user segments. It also provides the key drivers, restraints, opportunities, and challenges that affect the industry. The increasing usage of dynamic vision sensors in industrial automation, defense, and healthcare verticals is contributing to the global dynamic vision sensors market growth.
For instance, modern dynamic vision sensors can detect over 120 million events per second, making them ideal for ultra-fast motion tracking.
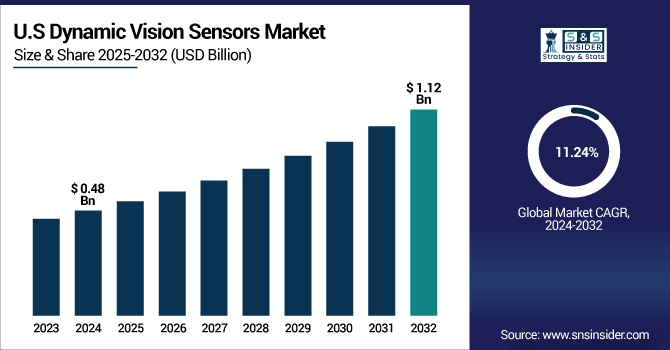
The U.S. dynamic vision sensors market size was USD 0.48 billion in 2024 and is expected to reach USD 1.12 billion by 2032, growing at a CAGR of 11.24% over the forecast period of 2025–2032.
The U.S. market is growing rapidly, driven by the scaling of vision-based AI systems in autonomous vehicles, manufacturing robotics and intelligent surveillance. Heavy government and private investment in defense related technologies, healthcare AI and industrial automation is increasing adoption. Such considerations have established the U.S. as a dominant figure in dynamic vision sensor innovation and commercialization across top priority, and advanced technology domains.
For instance, over 65% of dynamic vision sensor-based systems developed in the U.S. are used in defense-grade applications.
Dynamic Vision Sensors Market Drivers:
-
Industrial Automation is Rapidly Accelerating the Demand and Integration of Dynamic Vision Sensor Technologies Globally
There is a growing demand for intelligent visual perception systems for manufacturing environments, which will lead the DVS market. They have a low latency, high temporal resolution, and the instant capture of data, which is essential for robotic process automation and machine vision tasks. DVS is being applied in pick-and-place operations, quality inspections, and predictive maintenance systems across sectors. Their efficiency in high-speed and high-vibration environments brings a logical fit for Industry 4.0 applications, as precise and rapid response is essential in smart factories and autonomous systems. Dynamic Vision Sensors Market analysis highlights rising deployment in industrial automation.
For instance, over 45% of the U.S. smart factories are incorporating DVS in at least one robotic application as of 2024.
Dynamic Vision Sensors Market Restraints:
-
High Cost of Integration and Deployment Is Restricting Market Accessibility in Budget-Constrained Environments
Dynamic vision sensor (DVS) is a sophisticated neuromorphic architecture with an advanced CMOS fabrication process, which results in high costs. Such high-end automation systems carry a hefty price tag, which limits widespread adoption among small and medium enterprises. Additionally, the total cost of ownership increases when factoring in integration with the existing infrastructure, maintenance, and the necessary upgrades to the software. Yet, in fast-developing economies or other price-sensitive sectors, these financial challenges can be a barrier to adoption, even when the technological advantages of Dynamic Vision Sensors offer a potential advantage. Dynamic vision sensors market trends show cost barriers affecting SME adoption.
Dynamic Vision Sensors Market Opportunities:
-
Growing Smart Wearables Ecosystem is Opening New Frontiers for Miniaturized Dynamic Vision Sensor Adoption
Dynamic vision sensors have new applications with the rise of wearable devices and electronics infused with AI features. These sensors can be integrated into miniaturized devices, such as AR/VR headsets, smart glasses, and smartphones to be used for direct motion capture, facial recognition, and gesture control. Dynamic vision sensors are the next frontier of user experiences with the shift in consumer preference towards immersive technologies and touchless interfaces. It fits well with innovation in next-gen consumer product innovation, and with personalized user interaction, providing another alternative for this powerful vision at scale and on low-power.
For instance, more than 35% of advanced AR headsets in development pipelines integrate event-based vision sensors.
Dynamic Vision Sensors Market Challenges:
-
Complex Data Processing Architecture Requires Infrastructure Upgrades and Advanced Event-Based Software Compatibility
DVS produce high-frequency event-based data streams that differ substantially from traditional, frame-based imaging systems. The complexity of this data processing and analysis requires custom algorithms, hardware, and event-based processing frameworks. Adds pressure to IT infrastructure and forces the integration with high performance computing or with neuromorphic processors to facilitate the neuroplasticity process. Such capabilities are lacking among a high number of end-users, holding adoption back. Overcoming this barrier calls for an ecosystem-level preparedness and investment into compatible processing conditions.
Dynamic Vision Sensors Market, By Component
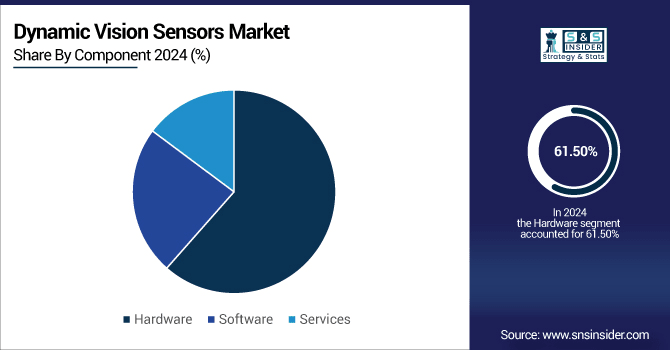
The hardware segment held the highest Dynamic Vision Sensors Market share at 61.50% in 2024. There is an increasing demand for specialized vision hardware, neuromorphic chips, and DVS-enabled cameras among others. The hardware segment continues to consolidate its stronghold on domestic and cross-border sensor deployments in mission-critical environments driven by a steady stream of heavy R&D investments by leading providers including Sony Corporation on novel high-speed, low-latency hardware solutions, and accelerated adoption of powerful hardware solutions optimized for real-time vision applications.
The services segment is estimated to register the highest CAGR of 12.49% during the forecast period of 2024–2032 owing to the growing demand for integration and maintenance between smart factory and AI ecosystem. As organizations transition to more advanced vision-based systems, demand for technical consulting, system updates, and lifecycle support increases. Waltham, Cognex Corporation, the leader in industrial machine vision systems, has announced new services for deployment optimization and system calibration as part of its DVS services portfolio that extend the DVS value proposition to increasingly customized, service-driven needs across automotive, healthcare, and logistics verticals.
Dynamic Vision Sensors Market, By Application
Industrial automation accounted for the largest market share of 33.20% in the year 2024, owing to the use of DVS in precise human motion capture, machine monitoring, defect detection, and tracking across industries. With continuous improvements in robotics and factory digitization, demand is growing at an increasing rate. Basler AG is a leader in industrial vision systems. Dynamic vision sensors are integrated into production environments to improve inspection performance, minimize error rates, and enable real-time process control, all of which fortifies the leadership of this segment in manufacturing and automation-oriented industries.
Aerospace & defense is projected to be the fastest-growing segment over the forecast period with the highest CAGR of 12.99% during 2024-2032, as they can be used for different applications, such as surveillance drones, autonomous navigation, and missile guidance systems. This kind of low-latency and low-power visual input systems need your innovation. Teledyne FLIR, a leader in imaging systems for defense applications, has integrated dynamic vision sensor technologies into sophisticated airborne and ground-based platforms to enhance tracking capability and situational awareness in complicating environments.
Dynamic Vision Sensors Market, By Technology
The CMOS sensors segment held the largest share of 47.6% in 2024 due to its energy efficiency, lower cost of production, and shorter readout times. CMOS-based DVS devices are the standard of high-speed imaging, being widely adopted in consumer electronics, automotive, and machine vision systems. Samsung Electronics’ investment in high-end CMOS sensor research and development, with the addition of neuromorphic compute capabilities, through the use of in-pixel and in-sensor computation, improves performance for compact, energy efficient, and scalable dynamic vision devices in key markets.
Time-of-Flight (ToF) sensors will grow with the highest CAGR of 12.44% throughout the forecast period of 2024-2032. A major growth driver is their increasing adoption in depth sensing, gesture recognition, and 3D mapping applications across robotics and AR/VR. Infineon Technologies is providing high performance integrated ToF solutions using dynamic sensing, expanding their use cases further in autonomous navigation systems, industrial robotics, and healthcare diagnostics, to enable high precision spatial awareness and real time response required for autonomous systems.
Dynamic Vision Sensors Market, By End-User
The manufacturing segment recorded the highest share (34.10%) in 2024 and is expected to witness the highest market growth due to the adaptation of Industry 4.0 standards, automated production lines, and predictive maintenance. DVS-based systems are employed in real-time process monitoring, motion tracking, and for controlling robots. Dynamic vision-based automation solutions from Omron Corporation, built to keep downtime minimum and through put maximum, intelligently enhances the manufacturing environments to be more effective and ready to act over the rapidly changing production needs.
The healthcare services domain is expected to register the highest CAGR of 12.89% over 2024-2032. Dynamic vision sensors are revolutionising medical technologies, including surgical navigation, diagnostic imaging, and patient monitoring. Prophesee, the leader in neuromorphic vision, is creating tools, enhanced by DVS, that offer superior temporal resolution and low-light capability to enable more accurate real-time imaging in minimally invasive procedures and next-gen healthcare.
Dynamic Vision Sensors Market Regional Analysis
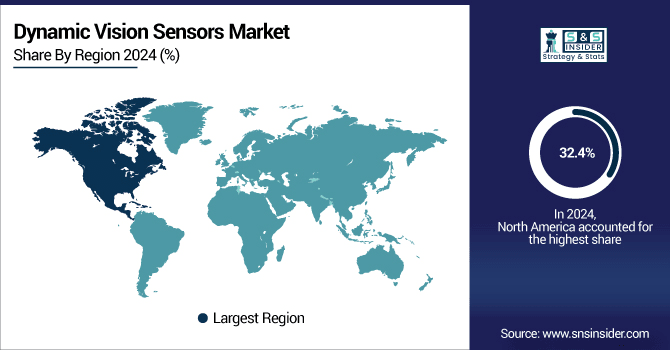
North America dominated the market with over 32.4% revenue share in 2024 owing to the early adoption of advanced sensor technologies across multiple verticals. Well-developed infrastructure, presence of top AI and semiconductor companies, and significant investments in defense, health care automation, and autonomous mobility ensure regional dominance. Specifically, the U.S. is the heart of the global innovation ecosystem and the demand for DVS-enabled solutions across smart manufacturing, intelligent surveillance, and next-gen robotics is driving the market leadership of the region.
-
The U.S. leads North America's Dynamic Vision Sensors industry due to robust industrial automation, strong defense investments, and advanced AI infrastructure. Strategic initiatives by companies such as Prophesee and Teledyne bolster its leadership in high-performance vision technologies.
Asia Pacific is expected to experience the fastest CAGR of 12.79% during the forecast period, 2024-2032, due to factors, such as the diversification of industries, growing tech-driven economies in countries including China and India, and growing semiconductor production in the region. China, Japan, and South Korea are already investing heavily in AI, automotive automation, and consumer electronics based on DVS. The adoption is being driven by government plans for smart factories, widening use of robotics, and modernization of defense. Moreover, the proliferation of regional startups and OEMs contributes to the innovations and cost competitiveness within the rapidly changing vision sensor environment.
-
China dominates the Asia Pacific market due to its massive manufacturing base, government-backed AI initiatives, and expanding robotics sector. Companies such as Hikvision integrate dynamic vision sensors into surveillance and automation systems, driving rapid domestic adoption and export-oriented growth.
The Europe dynamic vision sensors market is driven by the increasing adoption of autonomous systems, growing industrial robotics, and automotive requisites driving the market dynamically in the growing region during the forecast period 2024-2026. Countries, such as Germany and France are spending money spending on Smart manufacturing and AI Integration. Innovation and adoption are particularly prevalent in precision applications in automotive, healthcare imaging and aerospace throughout the region including some key companies, such as Bosch and Sony Europe.
-
Germany dominates Europe’s Dynamic Vision Sensors Market due to its strong industrial base, leadership in automotive innovation, and early Industry 4.0 adoption. Companies such as Bosch drive advancements in sensor technology, boosting applications in manufacturing automation, autonomous vehicles, and industrial robotics.
UAE dominates the Middle East & Africa market with high investments in AI, smart surveillance and healthcare innovation Brazil maintains the top position in Latin America but other nearby nations such as Colombia, Mexico and Argentina are also catching on in various industries, such as automotive, manufacturing and agriculture amid local players including Intelbras fostering the development of more advanced sensor technologies that will increase their convergence characteristics.
Dynamic Vision Sensors Market Key Players:
Major Key Players in Dynamic Vision Sensors companies are:
-
Sony Corporation
-
Prophesee
-
Samsung Electronics
-
OmniVision Technologies
-
Intel Corporation
-
Bosch Sensortec
-
Panasonic Corporation
-
STMicroelectronics
-
ON Semiconductor
-
Teledyne FLIR
-
ams-OSRAM
-
Himax Technologies
-
Cognex Corporation
-
Analog Devices, Inc.
-
Texas Instruments
-
Teli (Tokyo Electron Ltd.)
-
Basler AG
-
Xperi Corporation
-
Omni Design Technologies
-
Qualcomm Technologies, Inc.
Dynamic Vision Sensors Market Recent Developments:
-
In January 2025, Samsung showcased Android XR, an extended reality platform designed for AI‑powered XR devices including smart glasses and headsets. These devices are expected to integrate advanced vision sensors, such as ISOCELL ToF and dynamic image sensors, for gesture and motion detection in upcoming smart wearables.
-
In October 2024, Sony Semiconductor Solutions announced ISX038, the first automotive CMOS image sensor that simultaneously processes RAW and YUV outputs, simplifying ADAS camera architectures and enhancing dynamic vision in vehicles.
Report Attributes | Details |
---|---|
Market Size in 2024 | USD 2.07 Billion |
Market Size by 2032 | USD 4.94 Billion |
CAGR | CAGR of 11.52% From 2025 to 2032 |
Base Year | 2024 |
Forecast Period | 2025-2032 |
Historical Data | 2021-2023 |
Report Scope & Coverage | Market Size, Segments Analysis, Competitive Landscape, Regional Analysis, DROC & SWOT Analysis, Forecast Outlook |
Key Segments | • By Component (Hardware, Software and Services) • By Application (Industrial Automation, Automotive, Consumer Electronics, Healthcare and Aerospace & Defense) • By Technology (CMOS Sensors, CCD Sensors, Hybrid Sensors and Time-of-Flight Sensors) • By End-User (Manufacturing, Logistics & Transportation, Smart Home Applications, Retail & E-commerce and Healthcare Services) |
Regional Analysis/Coverage | North America (US, Canada, Mexico), Europe (Germany, France, UK, Italy, Spain, Poland, Turkey, Rest of Europe), Asia Pacific (China, India, Japan, South Korea, Singapore, Australia,Taiwan, Rest of Asia Pacific), Middle East & Africa (UAE, Saudi Arabia, Qatar, South Africa, Rest of Middle East & Africa), Latin America (Brazil, Argentina, Rest of Latin America) |
Company Profiles | Sony Corporation, Prophesee, Samsung Electronics, OmniVision Technologies, Intel Corporation, Bosch Sensortec, Panasonic Corporation, STMicroelectronics, ON Semiconductor, Teledyne FLIR, ams-OSRAM, Himax Technologies, Cognex Corporation, Analog Devices, Inc., Texas Instruments, Teli (Tokyo Electron Ltd.), Basler AG, Xperi Corporation, Omni Design Technologies and Qualcomm Technologies, Inc. |
Table Of Contents
1. Introduction
1.1 Market Definition & Scope
1.2 Research Assumptions & Abbreviations
1.3 Research Methodology
2. Executive Summary
2.1 Market Snapshot
2.2 Market Absolute $ Opportunity Assessment & Y-o-Y Analysis, 2021–2032
2.3 Market Size & Forecast, By Segmentation, 2021–2032
2.3.1 Market Size By Component
2.3.2 Market Size By Application
2.3.3 Market Size By Technology
2.3.4 Market Size By End-User
2.4 Market Share & Bps Analysis By Region, 2024
2.5 Industry Growth Scenarios – Conservative, Likely & Optimistic
2.6 Industry CxO’s Perspective
3. Market Overview
3.1 Market Dynamics
3.1.1 Drivers
3.1.2 Restraints
3.1.3 Opportunities
3.1.4 Key Market Trends
3.2 Industry PESTLE Analysis
3.3 Key Industry Forces (Porter’s) Impacting Market Growth
3.4 Industry Supply Chain Analysis
3.4.1 Raw Material Suppliers
3.4.2 Manufacturers
3.4.3 Distributors/Suppliers
3.4.4 Customers/End-Users
3.5 Industry Life Cycle Assessment
3.6 Parent Market Overview
3.7 Market Risk Assessment
4. Statistical Insights & Trends Reporting
4.1 Technology Penetration Statistics
4.1.1 Overview
4.1.2 Technology Adoption Rate By Industry
4.1.3 Penetration Rate In AR/VR, IoT, and Automotive Sectors
4.1.4 Adoption Comparison: DVS vs Traditional Vision Sensors
4.2 R&D Investment Trends
4.2.1 Overview
4.2.2 R&D Spending By Key Companies
4.2.3 R&D Investment Share In Total Revenue
4.2.4 Innovation Trends In Sensor Architecture and Neuromorphic Design
4.3 Deployment Metrics
4.3.1 Overview
4.3.2 Number of DVS Units Deployed By Application
4.3.3 Deployment Share By Region
4.3.4 Industrial Automation vs Consumer Electronics Deployment Comparison
4.4 Cost Structure Breakdown
4.4.1 Overview
4.4.2 Cost Contribution: Hardware, Software, and Integration
4.4.3 Total Cost of Ownership (TCO) Analysis
4.4.4 Cost Trends Across High-Volume and Low-Volume Applications
5. Dynamic Vision Sensors Market Segmental Analysis & Forecast, By Component, 2021 – 2032, Value (Usd Billion)
5.1 Introduction
5.2 Hardware
5.2.1 Key Trends
5.2.2 Market Size & Forecast, 2021 – 2032
5.3 Software
5.3.1 Key Trends
5.3.2 Market Size & Forecast, 2021 – 2032
5.4 Services
5.4.1 Key Trends
5.4.2 Market Size & Forecast, 2021 – 2032
6. Dynamic Vision Sensors Market Segmental Analysis & Forecast, By Application, 2021 – 2032, Value (Usd Billion)
6.1 Introduction
6.2 Industrial Automation
6.2.1 Key Trends
6.2.2 Market Size & Forecast, 2021 – 2032
6.3 Automotive
6.3.1 Key Trends
6.3.2 Market Size & Forecast, 2021 – 2032
6.4 Consumer Electronics
6.4.1 Key Trends
6.4.2 Market Size & Forecast, 2021 – 2032
6.5 Healthcare
6.5.1 Key Trends
6.5.2 Market Size & Forecast, 2021 – 2032
6.6 Aerospace & Defense
6.6.1 Key Trends
6.6.2 Market Size & Forecast, 2021 – 2032
7. Dynamic Vision Sensors Market Segmental Analysis & Forecast, By Technology, 2021 – 2032, Value (Usd Billion)
7.1 Introduction
7.2 CMOS Sensors
7.2.1 Key Trends
7.2.2 Market Size & Forecast, 2021 – 2032
7.3 CCD Sensors
7.3.1 Key Trends
7.3.2 Market Size & Forecast, 2021 – 2032
7.4 Hybrid Sensors
7.4.1 Key Trends
7.4.2 Market Size & Forecast, 2021 – 2032
7.5 Time-of-Flight Sensors
7.5.1 Key Trends
7.5.2 Market Size & Forecast, 2021 – 2032
8. Dynamic Vision Sensors Market Segmental Analysis & Forecast, By End-User, 2021 – 2032, Value (Usd Billion)
8.1 Introduction
8.2 Manufacturing
8.2.1 Key Trends
8.2.2 Market Size & Forecast, 2021 – 2032
8.3 Logistics & Transportation
8.3.1 Key Trends
8.3.2 Market Size & Forecast, 2021 – 2032
8.4 Smart Home Applications
8.4.1 Key Trends
8.4.2 Market Size & Forecast, 2021 – 2032
8.5 Retail & E-commerce
8.5.1 Key Trends
8.5.2 Market Size & Forecast, 2021 – 2032
8.6 Healthcare Services
8.6.1 Key Trends
8.6.2 Market Size & Forecast, 2021 – 2032
9. Dynamic Vision Sensors Market Segmental Analysis & Forecast By Region, 2021 – 2025, Value (Usd Billion)
9.1 Introduction
9.2 North America
9.2.1 Key Trends
9.2.2 Dynamic Vision Sensors Market Size & Forecast, By Component, 2021 – 2032
9.2.3 Dynamic Vision Sensors Market Size & Forecast, By Application, 2021 – 2032
9.2.4 Dynamic Vision Sensors Market Size & Forecast, By Technology, 2021 – 2032
9.2.5 Dynamic Vision Sensors Market Size & Forecast, By End-User, 2021 – 2032
9.2.6 Dynamic Vision Sensors Market Size & Forecast, By Country, 2021 – 2032
9.2.6.1 USA
9.2.6.1.1 Dynamic Vision Sensors Market Size & Forecast, By Component, 2021 – 2032
9.2.6.1.2 Dynamic Vision Sensors Market Size & Forecast, By Application, 2021 – 2032
9.2.6.1.3 Dynamic Vision Sensors Market Size & Forecast, By Technology, 2021 – 2032
9.2.6.1.4 Dynamic Vision Sensors Market Size & Forecast, By End-User, 2021 – 2032
9.2.6.2 Canada
9.2.6.2.1 Dynamic Vision Sensors Market Size & Forecast, By Component, 2021 – 2032
9.2.6.2.2 Dynamic Vision Sensors Market Size & Forecast, By Application, 2021 – 2032
9.2.6.2.3 Dynamic Vision Sensors Market Size & Forecast, By Technology, 2021 – 2032
9.2.6.2.4 Dynamic Vision Sensors Market Size & Forecast, By End-User, 2021 – 2032
9.3 Europe
9.3.1 Key Trends
9.3.2 Dynamic Vision Sensors Market Size & Forecast, By Component, 2021 – 2032
9.3.3 Dynamic Vision Sensors Market Size & Forecast, By Application, 2021 – 2032
9.3.4 Dynamic Vision Sensors Market Size & Forecast, By Technology, 2021 – 2032
9.3.5 Dynamic Vision Sensors Market Size & Forecast, By End-User, 2021 – 2032
9.3.6 Dynamic Vision Sensors Market Size & Forecast, By Country, 2021 – 2032
9.3.6.1 Germany
9.3.6.1.1 Dynamic Vision Sensors Market Size & Forecast, By Component, 2021 – 2032
9.3.6.1.2 Dynamic Vision Sensors Market Size & Forecast, By Application, 2021 – 2032
9.3.6.1.3 Dynamic Vision Sensors Market Size & Forecast, By Technology, 2021 – 2032
9.3.6.1.4 Dynamic Vision Sensors Market Size & Forecast, By End-User, 2021 – 2032
9.3.6.2 UK
9.3.6.2.1 Dynamic Vision Sensors Market Size & Forecast, By Component, 2021 – 2032
9.3.6.2.2 Dynamic Vision Sensors Market Size & Forecast, By Application, 2021 – 2032
9.3.6.2.3 Dynamic Vision Sensors Market Size & Forecast, By Technology, 2021 – 2032
9.3.6.2.4 Dynamic Vision Sensors Market Size & Forecast, By End-User, 2021 – 2032
9.3.6.3 France
9.3.6.3.1 Dynamic Vision Sensors Market Size & Forecast, By Component, 2021 – 2032
9.3.6.3.2 Dynamic Vision Sensors Market Size & Forecast, By Application, 2021 – 2032
9.3.6.3.3 Dynamic Vision Sensors Market Size & Forecast, By Technology, 2021 – 2032
9.3.6.3.4 Dynamic Vision Sensors Market Size & Forecast, By End-User, 2021 – 2032
9.3.6.4 Italy
9.3.6.4.1 Dynamic Vision Sensors Market Size & Forecast, By Component, 2021 – 2032
9.3.6.4.2 Dynamic Vision Sensors Market Size & Forecast, By Application, 2021 – 2032
9.3.6.4.3 Dynamic Vision Sensors Market Size & Forecast, By Technology, 2021 – 2032
9.3.6.4.4 Dynamic Vision Sensors Market Size & Forecast, By End-User, 2021 – 2032
9.3.6.5 Spain
9.3.6.5.1 Dynamic Vision Sensors Market Size & Forecast, By Component, 2021 – 2032
9.3.6.5.2 Dynamic Vision Sensors Market Size & Forecast, By Application, 2021 – 2032
9.3.6.5.3 Dynamic Vision Sensors Market Size & Forecast, By Technology, 2021 – 2032
9.3.6.5.4 Dynamic Vision Sensors Market Size & Forecast, By End-User, 2021 – 2032
9.3.6.6 Russia
9.3.6.6.1 Dynamic Vision Sensors Market Size & Forecast, By Component, 2021 – 2032
9.3.6.6.2 Dynamic Vision Sensors Market Size & Forecast, By Application, 2021 – 2032
9.3.6.6.3 Dynamic Vision Sensors Market Size & Forecast, By Technology, 2021 – 2032
9.3.6.6.4 Dynamic Vision Sensors Market Size & Forecast, By End-User, 2021 – 2032
9.3.6.7 Poland
9.3.6.7.1 Dynamic Vision Sensors Market Size & Forecast, By Component, 2021 – 2032
9.3.6.7.2 Dynamic Vision Sensors Market Size & Forecast, By Application, 2021 – 2032
9.3.6.7.3 Dynamic Vision Sensors Market Size & Forecast, By Technology, 2021 – 2032
9.3.6.7.4 Dynamic Vision Sensors Market Size & Forecast, By End-User, 2021 – 2032
9.3.6.8 Rest of Europe
9.3.6.8.1 Dynamic Vision Sensors Market Size & Forecast, By Component, 2021 – 2032
9.3.6.8.2 Dynamic Vision Sensors Market Size & Forecast, By Application, 2021 – 2032
9.3.6.8.3 Dynamic Vision Sensors Market Size & Forecast, By Technology, 2021 – 2032
9.3.6.8.4 Dynamic Vision Sensors Market Size & Forecast, By End-User, 2021 – 2032
9.4 Asia-Pacific
9.4.1 Key Trends
9.4.2 Dynamic Vision Sensors Market Size & Forecast, By Component, 2021 – 2032
9.4.3 Dynamic Vision Sensors Market Size & Forecast, By Application, 2021 – 2032
9.4.4 Dynamic Vision Sensors Market Size & Forecast, By Technology, 2021 – 2032
9.4.5 Dynamic Vision Sensors Market Size & Forecast, By End-User, 2021 – 2032
9.4.6 Dynamic Vision Sensors Market Size & Forecast, By Country, 2021 – 2032
9.4.6.1 China
9.4.6.1.1 Dynamic Vision Sensors Market Size & Forecast, By Component, 2021 – 2032
9.4.6.1.2 Dynamic Vision Sensors Market Size & Forecast, By Application, 2021 – 2032
9.4.6.1.3 Dynamic Vision Sensors Market Size & Forecast, By Technology, 2021 – 2032
9.4.6.1.4 Dynamic Vision Sensors Market Size & Forecast, By End-User, 2021 – 2032
9.4.6.2 India
9.4.6.2.1 Dynamic Vision Sensors Market Size & Forecast, By Component, 2021 – 2032
9.4.6.2.2 Dynamic Vision Sensors Market Size & Forecast, By Application, 2021 – 2032
9.4.6.2.3 Dynamic Vision Sensors Market Size & Forecast, By Technology, 2021 – 2032
9.4.6.2.4 Dynamic Vision Sensors Market Size & Forecast, By End-User, 2021 – 2032
9.4.6.3 Japan
9.4.6.3.1 Dynamic Vision Sensors Market Size & Forecast, By Component, 2021 – 2032
9.4.6.3.2 Dynamic Vision Sensors Market Size & Forecast, By Application, 2021 – 2032
9.4.6.3.3 Dynamic Vision Sensors Market Size & Forecast, By Technology, 2021 – 2032
9.4.6.3.4 Dynamic Vision Sensors Market Size & Forecast, By End-User, 2021 – 2032
9.4.6.4 South Korea
9.4.6.4.1 Dynamic Vision Sensors Market Size & Forecast, By Component, 2021 – 2032
9.4.6.4.2 Dynamic Vision Sensors Market Size & Forecast, By Application, 2021 – 2032
9.4.6.4.3 Dynamic Vision Sensors Market Size & Forecast, By Technology, 2021 – 2032
9.4.6.4.4 Dynamic Vision Sensors Market Size & Forecast, By End-User, 2021 – 2032
9.4.6.5 Australia
9.4.6.5.1 Dynamic Vision Sensors Market Size & Forecast, By Component, 2021 – 2032
9.4.6.5.2 Dynamic Vision Sensors Market Size & Forecast, By Application, 2021 – 2032
9.4.6.5.3 Dynamic Vision Sensors Market Size & Forecast, By Technology, 2021 – 2032
9.4.6.5.4 Dynamic Vision Sensors Market Size & Forecast, By End-User, 2021 – 2032
9.4.6.6 ASEAN Countries
9.4.6.6.1 Dynamic Vision Sensors Market Size & Forecast, By Component, 2021 – 2032
9.4.6.6.2 Dynamic Vision Sensors Market Size & Forecast, By Application, 2021 – 2032
9.4.6.6.3 Dynamic Vision Sensors Market Size & Forecast, By Technology, 2021 – 2032
9.4.6.6.4 Dynamic Vision Sensors Market Size & Forecast, By End-User, 2021 – 2032
9.4.6.7 Rest of Asia-Pacific
9.4.6.7.1 Dynamic Vision Sensors Market Size & Forecast, By Component, 2021 – 2032
9.4.6.7.2 Dynamic Vision Sensors Market Size & Forecast, By Application, 2021 – 2032
9.4.6.7.3 Dynamic Vision Sensors Market Size & Forecast, By Technology, 2021 – 2032
9.4.6.7.4 Dynamic Vision Sensors Market Size & Forecast, By End-User, 2021 – 2032
9.5 Latin America
9.5.1 Key Trends
9.5.2 Dynamic Vision Sensors Market Size & Forecast, By Component, 2021 – 2032
9.5.3 Dynamic Vision Sensors Market Size & Forecast, By Application, 2021 – 2032
9.5.4 Dynamic Vision Sensors Market Size & Forecast, By Technology, 2021 – 2032
9.5.5 Dynamic Vision Sensors Market Size & Forecast, By End-User, 2021 – 2032
9.5.6 Dynamic Vision Sensors Market Size & Forecast, By Country, 2021 – 2032
9.5.6.1 Brazil
9.5.6.1.1 Dynamic Vision Sensors Market Size & Forecast, By Component, 2021 – 2032
9.5.6.1.2 Dynamic Vision Sensors Market Size & Forecast, By Application, 2021 – 2032
9.5.6.1.3 Dynamic Vision Sensors Market Size & Forecast, By Technology, 2021 – 2032
9.5.6.1.4 Dynamic Vision Sensors Market Size & Forecast, By End-User, 2021 – 2032
9.5.6.2 Argentina
9.5.6.2.1 Dynamic Vision Sensors Market Size & Forecast, By Component, 2021 – 2032
9.5.6.2.2 Dynamic Vision Sensors Market Size & Forecast, By Application, 2021 – 2032
9.5.6.2.3 Dynamic Vision Sensors Market Size & Forecast, By Technology, 2021 – 2032
9.5.6.2.4 Dynamic Vision Sensors Market Size & Forecast, By End-User, 2021 – 2032
9.5.6.3 Mexico
9.5.6.3.1 Dynamic Vision Sensors Market Size & Forecast, By Component, 2021 – 2032
9.5.6.3.2 Dynamic Vision Sensors Market Size & Forecast, By Application, 2021 – 2032
9.5.6.3.3 Dynamic Vision Sensors Market Size & Forecast, By Technology, 2021 – 2032
9.5.6.3.4 Dynamic Vision Sensors Market Size & Forecast, By End-User, 2021 – 2032
9.5.6.4 Colombia
9.5.6.4.1 Dynamic Vision Sensors Market Size & Forecast, By Component, 2021 – 2032
9.5.6.4.2 Dynamic Vision Sensors Market Size & Forecast, By Application, 2021 – 2032
9.5.6.4.3 Dynamic Vision Sensors Market Size & Forecast, By Technology, 2021 – 2032
9.5.6.4.4 Dynamic Vision Sensors Market Size & Forecast, By End-User, 2021 – 2032
9.5.6.5 Rest of Latin America
9.5.6.5.1 Dynamic Vision Sensors Market Size & Forecast, By Component, 2021 – 2032
9.5.6.5.2 Dynamic Vision Sensors Market Size & Forecast, By Application, 2021 – 2032
9.5.6.5.3 Dynamic Vision Sensors Market Size & Forecast, By Technology, 2021 – 2032
9.5.6.5.4 Dynamic Vision Sensors Market Size & Forecast, By End-User, 2021 – 2032
9.6 Middle East & Africa
9.6.1 Key Trends
9.6.2 Dynamic Vision Sensors Market Size & Forecast, By Component, 2021 – 2032
9.6.3 Dynamic Vision Sensors Market Size & Forecast, By Application, 2021 – 2032
9.6.4 Dynamic Vision Sensors Market Size & Forecast, By Technology, 2021 – 2032
9.6.5 Dynamic Vision Sensors Market Size & Forecast, By End-User, 2021 – 2032
9.6.6 Dynamic Vision Sensors Market Size & Forecast, By Country, 2021 – 2032
9.6.6.1 UAE
9.6.6.1.1 Dynamic Vision Sensors Market Size & Forecast, By Component, 2021 – 2032
9.6.6.1.2 Dynamic Vision Sensors Market Size & Forecast, By Application, 2021 – 2032
9.6.6.1.3 Dynamic Vision Sensors Market Size & Forecast, By Technology, 2021 – 2032
9.6.6.1.4 Dynamic Vision Sensors Market Size & Forecast, By End-User, 2021 – 2032
9.6.6.2 Saudi Arabia
9.6.6.2.1 Dynamic Vision Sensors Market Size & Forecast, By Component, 2021 – 2032
9.6.6.2.2 Dynamic Vision Sensors Market Size & Forecast, By Application, 2021 – 2032
9.6.6.2.3 Dynamic Vision Sensors Market Size & Forecast, By Technology, 2021 – 2032
9.6.6.2.4 Dynamic Vision Sensors Market Size & Forecast, By End-User, 2021 – 2032
9.6.6.3 Qatar
9.6.6.3.1 Dynamic Vision Sensors Market Size & Forecast, By Component, 2021 – 2032
9.6.6.3.2 Dynamic Vision Sensors Market Size & Forecast, By Application, 2021 – 2032
9.6.6.3.3 Dynamic Vision Sensors Market Size & Forecast, By Technology, 2021 – 2032
9.6.6.3.4 Dynamic Vision Sensors Market Size & Forecast, By End-User, 2021 – 2032
9.6.6.4 Egypt
9.6.6.4.1 Dynamic Vision Sensors Market Size & Forecast, By Component, 2021 – 2032
9.6.6.4.2 Dynamic Vision Sensors Market Size & Forecast, By Application, 2021 – 2032
9.6.6.4.3 Dynamic Vision Sensors Market Size & Forecast, By Technology, 2021 – 2032
9.6.6.4.4 Dynamic Vision Sensors Market Size & Forecast, By End-User, 2021 – 2032
9.6.6.5 South Africa
9.6.6.5.1 Dynamic Vision Sensors Market Size & Forecast, By Component, 2021 – 2032
9.6.6.5.2 Dynamic Vision Sensors Market Size & Forecast, By Application, 2021 – 2032
9.6.6.5.3 Dynamic Vision Sensors Market Size & Forecast, By Technology, 2021 – 2032
9.6.6.5.4 Dynamic Vision Sensors Market Size & Forecast, By End-User, 2021 – 2032
9.6.6.6 Rest of Middle East & Africa
9.6.6.6.1 Dynamic Vision Sensors Market Size & Forecast, By Component, 2021 – 2032
9.6.6.6.2 Dynamic Vision Sensors Market Size & Forecast, By Application, 2021 – 2032
9.6.6.6.3 Dynamic Vision Sensors Market Size & Forecast, By Technology, 2021 – 2032
9.6.6.6.4 Dynamic Vision Sensors Market Size & Forecast, By End-User, 2021 – 2032
10. Competitive Landscape
10.1 Key Players' Positioning
10.2 Competitive Developments
10.2.1 Key Strategies Adopted (%), By Key Players, 2024
10.2.2 Year-Wise Strategies & Development, 2021 – 2025
10.2.3 Number Of Strategies Adopted By Key Players, 2024
10.3 Market Share Analysis, 2024
10.4 Product/Service & Application Benchmarking
10.4.1 Product/Service Specifications & Features By Key Players
10.4.2 Product/Service Heatmap By Key Players
10.4.3 Application Heatmap By Key Players
10.5 Industry Start-Up & Innovation Landscape
10.6 Key Company Profiles
10.6.1 Sony Corporation
10.6.1.1 Company Overview & Snapshot
10.6.1.2 Product/Service Portfolio
10.6.1.3 Key Company Financials
10.6.1.4 SWOT Analysis
10.6.2 Prophesee
10.6.2.1 Company Overview & Snapshot
10.6.2.2 Product/Service Portfolio
10.6.2.3 Key Company Financials
10.6.2.4 SWOT Analysis
10.6.3 Samsung Electronics
10.6.3.1 Company Overview & Snapshot
10.6.3.2 Product/Service Portfolio
10.6.3.3 Key Company Financials
10.6.3.4 SWOT Analysis
10.6.4 OmniVision Technologies
10.6.4.1 Company Overview & Snapshot
10.6.4.2 Product/Service Portfolio
10.6.4.3 Key Company Financials
10.6.4.4 SWOT Analysis
10.6.5 Intel Corporation
10.6.5.1 Company Overview & Snapshot
10.6.5.2 Product/Service Portfolio
10.6.5.3 Key Company Financials
10.6.5.4 SWOT Analysis
10.6.6 Bosch Sensortec
10.6.6.1 Company Overview & Snapshot
10.6.6.2 Product/Service Portfolio
10.6.6.3 Key Company Financials
10.6.6.4 SWOT Analysis
10.6.7 Panasonic Corporation
10.6.7.1 Company Overview & Snapshot
10.6.7.2 Product/Service Portfolio
10.6.7.3 Key Company Financials
10.6.7.4 SWOT Analysis
10.6.8 STMicroelectronics
10.6.8.1 Company Overview & Snapshot
10.6.8.2 Product/Service Portfolio
10.6.8.3 Key Company Financials
10.6.8.4 SWOT Analysis
10.6.9 ON Semiconductor
10.6.9.1 Company Overview & Snapshot
10.6.9.2 Product/Service Portfolio
10.6.9.3 Key Company Financials
10.6.9.4 SWOT Analysis
10.6.10 Teledyne FLIR
10.6.10.1 Company Overview & Snapshot
10.6.10.2 Product/Service Portfolio
10.6.10.3 Key Company Financials
10.6.10.4 SWOT Analysis
10.6.11 ams-OSRAM
10.6.11.1 Company Overview & Snapshot
10.6.11.2 Product/Service Portfolio
10.6.11.3 Key Company Financials
10.6.11.4 SWOT Analysis
10.6.12 Himax Technologies
10.6.12.1 Company Overview & Snapshot
10.6.12.2 Product/Service Portfolio
10.6.12.3 Key Company Financials
10.6.12.4 SWOT Analysis
10.6.13 Cognex Corporation
10.6.13.1 Company Overview & Snapshot
10.6.13.2 Product/Service Portfolio
10.6.13.3 Key Company Financials
10.6.13.4 SWOT Analysis
10.6.14 Analog Devices, Inc.
10.6.14.1 Company Overview & Snapshot
10.6.14.2 Product/Service Portfolio
10.6.14.3 Key Company Financials
10.6.14.4 SWOT Analysis
10.6.15 Texas Instruments
10.6.15.1 Company Overview & Snapshot
10.6.15.2 Product/Service Portfolio
10.6.15.3 Key Company Financials
10.6.15.4 SWOT Analysis
10.6.16 Teli (Tokyo Electron Ltd.)
10.6.16.1 Company Overview & Snapshot
10.6.16.2 Product/Service Portfolio
10.6.16.3 Key Company Financials
10.6.16.4 SWOT Analysis
10.6.17 Basler AG
10.6.17.1 Company Overview & Snapshot
10.6.17.2 Product/Service Portfolio
10.6.17.3 Key Company Financials
10.6.17.4 SWOT Analysis
10.6.18 Xperi Corporation
10.6.18.1 Company Overview & Snapshot
10.6.18.2 Product/Service Portfolio
10.6.18.3 Key Company Financials
10.6.18.4 SWOT Analysis
10.6.19 Omni Design Technologies
10.6.19.1 Company Overview & Snapshot
10.6.19.2 Product/Service Portfolio
10.6.19.3 Key Company Financials
10.6.19.4 SWOT Analysis
10.6.20 Qualcomm Technologies, Inc.
10.6.20.1 Company Overview & Snapshot
10.6.20.2 Product/Service Portfolio
10.6.20.3 Key Company Financials
10.6.20.4 SWOT Analysis
11. Analyst Recommendations
11.1 SNS Insider Opportunity Map
11.2 Industry Low-Hanging Fruit Assessment
11.3 Market Entry & Growth Strategy
11.4 Analyst Viewpoint & Suggestions On Market Growth
12. Assumptions
13. Disclaimer
14. Appendix
14.1 List Of Tables
14.2 List Of Figures
Key Segments:
By Component
-
Hardware
-
Software
-
Services
By Application
-
Industrial Automation
-
Automotive
-
Consumer Electronics
-
Healthcare
-
Aerospace & Defense
By Technology
-
CMOS Sensors
-
CCD Sensors
-
Hybrid Sensors
-
Time-of-Flight Sensors
By End-User
-
Manufacturing
-
Logistics & Transportation
-
Smart Home Applications
-
Retail & E-commerce
-
Healthcare Services
Request for Segment Customization as per your Business Requirement: Segment Customization Request
Regional Coverage:
North America
-
US
-
Canada
Europe
-
Germany
-
UK
-
France
-
Italy
-
Spain
-
Russia
-
Poland
-
Rest of Europe
Asia Pacific
-
China
-
India
-
Japan
-
South Korea
-
Australia
-
ASEAN Countries
-
Rest of Asia Pacific
Middle East & Africa
-
UAE
-
Saudi Arabia
-
Qatar
-
South Africa
-
Rest of Middle East & Africa
Latin America
-
Brazil
-
Argentina
-
Mexico
-
Colombia
-
Rest of Latin America
Request for Country Level Research Report: Country Level Customization Request
Available Customization
With the given market data, SNS Insider offers customization as per the company’s specific needs. The following customization options are available for the report:
-
Detailed Volume Analysis
-
Criss-Cross segment analysis (e.g. Product X Application)
-
Competitive Product Benchmarking
-
Geographic Analysis
-
Additional countries in any of the regions
-
Customized Data Representation
-
Detailed analysis and profiling of additional market players
An accurate research report requires proper strategizing as well as implementation. There are multiple factors involved in the completion of good and accurate research report and selecting the best methodology to compete the research is the toughest part. Since the research reports we provide play a crucial role in any company’s decision-making process, therefore we at SNS Insider always believe that we should choose the best method which gives us results closer to reality. This allows us to reach at a stage wherein we can provide our clients best and accurate investment to output ratio.
Each report that we prepare takes a timeframe of 350-400 business hours for production. Starting from the selection of titles through a couple of in-depth brain storming session to the final QC process before uploading our titles on our website we dedicate around 350 working hours. The titles are selected based on their current market cap and the foreseen CAGR and growth.
The 5 steps process:
Step 1: Secondary Research:
Secondary Research or Desk Research is as the name suggests is a research process wherein, we collect data through the readily available information. In this process we use various paid and unpaid databases which our team has access to and gather data through the same. This includes examining of listed companies’ annual reports, Journals, SEC filling etc. Apart from this our team has access to various associations across the globe across different industries. Lastly, we have exchange relationships with various university as well as individual libraries.

Step 2: Primary Research
When we talk about primary research, it is a type of study in which the researchers collect relevant data samples directly, rather than relying on previously collected data. This type of research is focused on gaining content specific facts that can be sued to solve specific problems. Since the collected data is fresh and first hand therefore it makes the study more accurate and genuine.
We at SNS Insider have divided Primary Research into 2 parts.
Part 1 wherein we interview the KOLs of major players as well as the upcoming ones across various geographic regions. This allows us to have their view over the market scenario and acts as an important tool to come closer to the accurate market numbers. As many as 45 paid and unpaid primary interviews are taken from both the demand and supply side of the industry to make sure we land at an accurate judgement and analysis of the market.
This step involves the triangulation of data wherein our team analyses the interview transcripts, online survey responses and observation of on filed participants. The below mentioned chart should give a better understanding of the part 1 of the primary interview.

Part 2: In this part of primary research the data collected via secondary research and the part 1 of the primary research is validated with the interviews from individual consultants and subject matter experts.
Consultants are those set of people who have at least 12 years of experience and expertise within the industry whereas Subject Matter Experts are those with at least 15 years of experience behind their back within the same space. The data with the help of two main processes i.e., FGDs (Focused Group Discussions) and IDs (Individual Discussions). This gives us a 3rd party nonbiased primary view of the market scenario making it a more dependable one while collation of the data pointers.
Step 3: Data Bank Validation
Once all the information is collected via primary and secondary sources, we run that information for data validation. At our intelligence centre our research heads track a lot of information related to the market which includes the quarterly reports, the daily stock prices, and other relevant information. Our data bank server gets updated every fortnight and that is how the information which we collected using our primary and secondary information is revalidated in real time.

Step 4: QA/QC Process
After all the data collection and validation our team does a final level of quality check and quality assurance to get rid of any unwanted or undesired mistakes. This might include but not limited to getting rid of the any typos, duplication of numbers or missing of any important information. The people involved in this process include technical content writers, research heads and graphics people. Once this process is completed the title gets uploader on our platform for our clients to read it.
Step 5: Final QC/QA Process:
This is the last process and comes when the client has ordered the study. In this process a final QA/QC is done before the study is emailed to the client. Since we believe in giving our clients a good experience of our research studies, therefore, to make sure that we do not lack at our end in any way humanly possible we do a final round of quality check and then dispatch the study to the client.