image

E-Scooter Sharing Market Size & Overview:

E-Scooter-Sharing-Market Revenue Analysis

To get more information on E-Scooter Sharing Market - Request Sample Report

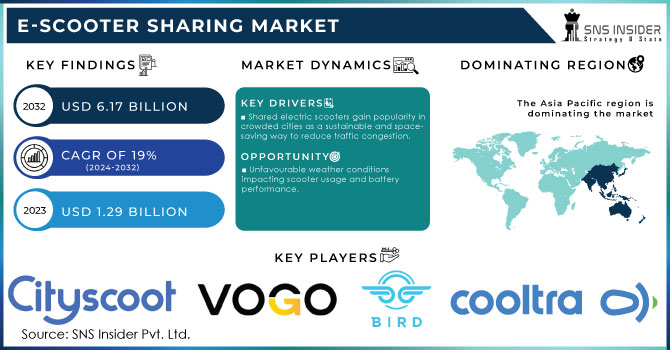
The E-Scooter Sharing Market Size was valued at USD 1.29 billion in 2023 and is expected to reach USD 5.19 billion by 2031 and grow at a CAGR of 19% over the forecast period 2024-2031.

The electric scooters are the sort of electric vehicles that uses rechargeable battery and electric engine instead of the gasoline motor. They can be plugged into external power source to revive the battery. Compared to the conventional gasoline-powered vehicles, electric bikes offer significant cost savings whereas delivering similar performance. An exciting development in electric scooter technology is the potential for coordination solar panels. While currently limited to electric cars, solar panels on scooters are anticipated to extend their range by 15-20%.

Driven by the worldwide push to the decreased carbon emissions, electric mobility solutions like electric scooters are gaining traction as a sustainable alternative. Governments around the world are setting the ambitious target for the adoption of electric vehicles, making a strong administrative environment. The development of the renewable energy sector provides a reliable source of clean power to charge the electric bikes, advance upgrading their natural benefits.

MARKET DYNAMICS:

KEY DRIVERS:

  • Shared electric scooters gain popularity in crowded cities as a sustainable and space-saving way to reduce traffic congestion.

Traffic congestion in cities is a major problem, especially during rush hour. To tackle this, shared electric scooters are becoming increasingly popular. Governments and scooter companies are promoting them as a sustainable commuting option. These compact scooters take up less space on roads and in parking, allowing users to rush through traffic and avoid contributing to air pollution. This eco-friendly mode of transport is useful for commuters and the environment.

  • E-scooter tech advancements like extended battery life in shared vehicles fuel market growth.

RESTRAINTS:

  • Limited range of e-scooters compared to other electric vehicles.

  • Unfavourable weather conditions impacting scooter usage and battery performance.

OPPORTUNITIES:

  • Integration of solar panels could extend e-scooter range and boost their eco-friendly appeal.

  • Incorporation of AI and IoT features can enhance safety, security, and user experience in e-scooters.

The future of e-scooter sharing is bright due to the potential of Artificial Intelligence and the Internet of Things. Coordination these technologies can move forward the security, safety, and user experience. AI can analyse riding patterns to identify potential hazards and alert riders in real-time. IoT sensors could detect malfunctions or accidents, allowing for immediate intervention and preventing further issues. Thus, AI could personalize user experiences by suggesting optimal routes based on traffic and weather conditions. This integration of advanced innovation has the potential to make e-scooters a more secure, more safe, and more enjoyable way to explore urban environments.

CHALLENGES:

  • Limited battery range can restrict trip planning and discourage users from relying solely on e-scooters.

  • Inclement weather conditions like rain and snow can impact e-scooter functionality and user comfort.

IMPACT OF RUSSIA-UKRAINE WAR

The war in Russia-Ukraine has disrupted the E-scooter sharing market in several ways. The global economic disruptions caused by the conflict have led to the rise in material and production costs. This can potentially slow down the development and rollout of new e-scooter models, especially those boasting advanced features. Sanctions imposed on Russia, a significant e-scooter sharing market, have stopped operations and limited growth opportunities in the region. The pre-war projections for Russia's e-scooter market share are likely to be reduced. The war has exacerbated the global supply chain crisis, making it more difficult for manufacturers to obtain essential components for e-scooter production. This can lead to potential slowdown in market growth of around 5-10%, with a full recovery hinging on the war's resolution and global economic stabilization.

IMPACT OF ECONOMIC SLOWDOWN

An economic slowdown can cast a slow down the e-scooter sharing market in a few key ways. With limiting budgets, consumers might prioritize essential spending over discretionary leisure activities, potentially leading to fewer e-scooter rides. This could be reflected in a 10-15% of decline in ridership during a slowdown. The companies themselves might face financial constraints. Investment in new scooter fleets or technological advancements could slow down, hindering market growth. During economic hardship, some cities might be less receptive to expanding e-scooter programs due to concerns about potential lost revenue from parking or traffic congestion. This could lead to stagnation or even a 5-7% decrease in the number of cities offering e-scooter sharing programs.

KEY MARKET SEGMENTS:
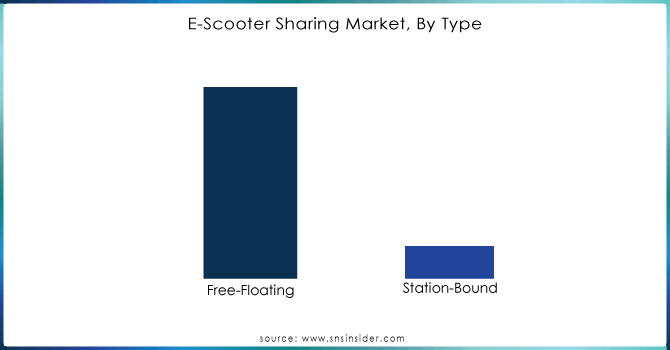
By Type

Free-Floating is the dominating sub-segment in the E-Scooter Sharing Market by type holding around 90-95% of market share. Free-floating e-scooter sharing offers unparalleled flexibility and convenience. Users can locate, unlock, and abandon scooters anywhere within the designated service area, eliminating the need to search for docking stations. This spontaneous pick-up-and-drop-off system is particularly attractive for short, unplanned trips.

E-Scooter-Sharing-Market-Segmentation-By-Type

To Get Customized Report as per your Business Requirement - Request For Customized Report

By Distribution Channel
Online is the dominating sub-segment in the E-Scooter Sharing Market by distribution channel holding around 80-85% of market share. Online platforms provide a seamless user experience. Booking, unlocking, payment, and real-time scooter availability and location tracking can all be done through user-friendly apps. This eliminates the need for physical interaction with kiosks or personnel, making the entire process swift and convenient.
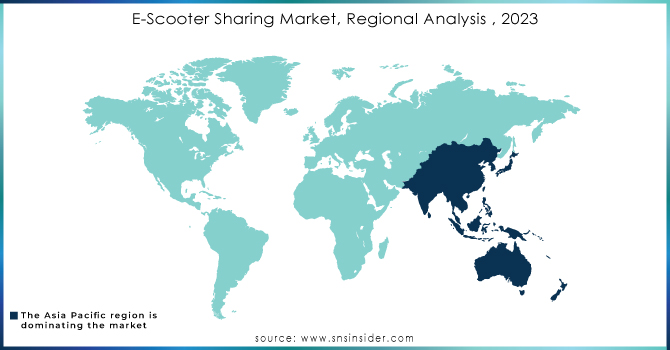
REGIONAL ANALYSES

The Asia Pacific is the dominating region in the E-Scooter Sharing Market holding around 70-75% of market share, particularly China, due to a thriving manufacturing base, supportive government policies for traffic and pollution reduction, and dense urban environments ideal for short e-scooter trips.

Europe is the second highest region in this market with 15-20% of share, leveraging its established sharing economy with existing bike-sharing programs, environmentally conscious consumers, and a focus on sustainable transportation.

North America is experiencing the fastest growth with 5-10% of share due to increasing urbanization in major cities, heavy investment in e-scooter companies, and advancements in e-scooter technology.

E-Scooter-Sharing-Market-By-Region

KEY PLAYERS

The major key players are Neutron Holdings Inc, Cityscoot, Cooltra Motosharing SLU, Bird Global Inc, Vogo Automotive Pvt Ltd, Go To Global Mobility Ltd, Lyft Inc, VOI Technology and other key players.

Neutron Holdings Inc-Company Financial Analysis

Company Landscape Analysis

RECENT DEVELOPMENT

  • In May 2022: San Francisco is testing technology with Lime, Spin, and Scoot to automatically slow e-scooters on sidewalks, prioritizing pedestrian safety and reducing the need for riders to navigate traffic.

  • In April 2022: Bird, a company offering shared electric scooters, is expanding to Indio, California, known for hosting the Coachella and Stagecoach music festivals. This move provides residents and festivalgoers with a new eco-friendly transportation option.

E-Scooter Sharing Market Report Scope: 

Report Attributes Details
Market Size in 2023 US$ 1.29 Billion
Market Size by 2031 US$ 5.19 Billion
CAGR CAGR of 19% From 2024 to 2031
Base Year 2023
Forecast Period 2024-2031
Historical Data 2020-2022
Report Scope & Coverage Market Size, Segments Analysis, Competitive Landscape, Regional Analysis, DROC & SWOT Analysis, Forecast Outlook
Key Segments • By Type (Free-Floating, Station Bound)
• by Distribution Channel (Online, Offline)
Regional Analysis/Coverage North America (US, Canada, Mexico), Europe (Eastern Europe [Poland, Romania, Hungary, Turkey, Rest of Eastern Europe] Western Europe] Germany, France, UK, Italy, Spain, Netherlands, Switzerland, Austria, Rest of Western Europe]), Asia Pacific (China, India, Japan, South Korea, Vietnam, Singapore, Australia, Rest of Asia Pacific), Middle East & Africa (Middle East [UAE, Egypt, Saudi Arabia, Qatar, Rest of Middle East], Africa [Nigeria, South Africa, Rest of Africa], Latin America (Brazil, Argentina, Colombia, Rest of Latin America)
Company Profiles Neutron Holdings Inc, Cityscoot, Cooltra Motosharing SLU, Bird Global Inc, Vogo Automotive Pvt Ltd, Go To Global Mobility Ltd, Lyft Inc, VOI Technology
Key Drivers • Shared electric scooters gain popularity in crowded cities as a sustainable and space-saving way to reduce traffic congestion.
• E-scooter tech advancements like extended battery life in shared vehicles fuel market growth.
RESTRAINTS • Limited range of e-scooters compared to other electric vehicles.
• Unfavourable weather conditions impacting scooter usage and battery performance.

Frequently Asked Questions

Ans: The expected CAGR of the global E-Scooter Sharing Market during the forecast period is 19%.

Ans: The E-Scooter Sharing Market was valued at USD 1.29 billion in 2023.

Ans: Integrating solar panels for extended range and using AI/IoT for improved safety and user experience.

Ans: Limited battery range and the impact of bad weather on functionality and user comfort.

Ans: Asia Pacific, due to manufacturing base, supportive policies, and dense urban environments.

Table of Contents

1. Introduction
1.1 Market Definition
1.2 Scope
1.3 Research Assumptions

2. Industry Flowchart

3. Research Methodology

4. Market Dynamics
4.1 Drivers
4.2 Restraints
4.3 Opportunities
4.4 Challenges

5. Impact Analysis
5.1 Impact of Russia Ukraine Crisis
5.2 Impact of Economic Slowdown on Major Countries
5.2.1 Introduction
5.2.2 United States
5.2.3 Canada
5.2.4 Germany
5.2.5 France
5.2.6 UK
5.2.7 China
5.2.8 Japan
5.2.9 South Korea
5.2.10 India

6. Value Chain Analysis

7. Porter’s 5 Forces Model

8.  Pest Analysis

9. E-Scooter Sharing Market Segmentation, By Type
9.1 Introduction
9.2 Trend Analysis
9.3 Free-Floating
9.4 Station-Bound

10. E-Scooter Sharing Market Segmentation, By Distribution Channel
10.1 Introduction
10.2 Trend Analysis
10.3 Online
10.4 Offline

11. Regional Analysis
11.1 Introduction
11.2 North America
11.2.1 Trend Analysis
11.2.2 North America E-Scooter Sharing Market Segmentation, by Country
11.2.3 North America E-Scooter Sharing Market Segmentation, By Type
11.2.4 North America E-Scooter Sharing Market Segmentation, By Distribution Channel
11.2.5 USA
11.2.5.1 USA E-Scooter Sharing Market Segmentation, By Type
11.2.5.2 USA E-Scooter Sharing Market Segmentation, By Distribution Channel
11.2.6 Canada
11.2.6.1 Canada E-Scooter Sharing Market Segmentation, By Type
11.2.6.2 Canada E-Scooter Sharing Market Segmentation, By Distribution Channel
11.2.7 Mexico
11.2.7.1 Mexico E-Scooter Sharing Market Segmentation, By Type
11.2.7.2 Mexico E-Scooter Sharing Market Segmentation, By Distribution Channel
11.3 Europe
11.3.1 Trend Analysis
11.3.2 Eastern Europe
11.3.2.1 Eastern Europe E-Scooter Sharing Market Segmentation, by Country
11.3.2.2 Eastern Europe E-Scooter Sharing Market Segmentation, By Type
11.3.2.3 Eastern Europe E-Scooter Sharing Market Segmentation, By Distribution Channel
11.3.2.4 Poland
11.3.2.4.1 Poland E-Scooter Sharing Market Segmentation, By Type
11.3.2.4.2 Poland E-Scooter Sharing Market Segmentation, By Distribution Channel
11.3.2.5 Romania
11.3.2.5.1 Romania E-Scooter Sharing Market Segmentation, By Type
11.3.2.5.2 Romania E-Scooter Sharing Market Segmentation, By Distribution Channel
11.3.2.6 Hungary
11.3.2.6.1 Hungary E-Scooter Sharing Market Segmentation, By Type
11.3.2.6.2 Hungary E-Scooter Sharing Market Segmentation, By Distribution Channel
11.3.2.7 Turkey
11.3.2.7.1 Turkey E-Scooter Sharing Market Segmentation, By Type
11.3.2.7.2 Turkey E-Scooter Sharing Market Segmentation, By Distribution Channel
11.3.2.8 Rest of Eastern Europe
11.3.2.8.1 Rest of Eastern Europe E-Scooter Sharing Market Segmentation, By Type
11.3.2.8.2 Rest of Eastern Europe E-Scooter Sharing Market Segmentation, By Distribution Channel
11.3.3 Western Europe
11.3.3.1 Western Europe E-Scooter Sharing Market Segmentation, by Country
11.3.3.2 Western Europe E-Scooter Sharing Market Segmentation, By Type
11.3.3.3 Western Europe E-Scooter Sharing Market Segmentation, By Distribution Channel
11.3.3.4 Germany
11.3.3.4.1 Germany E-Scooter Sharing Market Segmentation, By Type
11.3.3.4.2 Germany E-Scooter Sharing Market Segmentation, By Distribution Channel
11.3.3.5 France
11.3.3.5.1 France E-Scooter Sharing Market Segmentation, By Type
11.3.3.5.2 France E-Scooter Sharing Market Segmentation, By Distribution Channel
11.3.3.6 UK
11.3.3.6.1 UK E-Scooter Sharing Market Segmentation, By Type
11.3.3.6.2 UK E-Scooter Sharing Market Segmentation, By Distribution Channel
11.3.3.7 Italy
11.3.3.7.1 Italy E-Scooter Sharing Market Segmentation, By Type
11.3.3.7.2 Italy E-Scooter Sharing Market Segmentation, By Distribution Channel
11.3.3.8 Spain
11.3.3.8.1 Spain E-Scooter Sharing Market Segmentation, By Type
11.3.3.8.2 Spain E-Scooter Sharing Market Segmentation, By Distribution Channel
11.3.3.9 Netherlands
11.3.3.9.1 Netherlands E-Scooter Sharing Market Segmentation, By Type
11.3.3.9.2 Netherlands E-Scooter Sharing Market Segmentation, By Distribution Channel
11.3.3.10 Switzerland
11.3.3.10.1 Switzerland E-Scooter Sharing Market Segmentation, By Type
11.3.3.10.2 Switzerland E-Scooter Sharing Market Segmentation, By Distribution Channel
11.3.3.11 Austria
11.3.3.11.1 Austria E-Scooter Sharing Market Segmentation, By Type
11.3.3.11.2 Austria E-Scooter Sharing Market Segmentation, By Distribution Channel
11.3.3.12 Rest of Western Europe
11.3.3.12.1 Rest of Western Europe E-Scooter Sharing Market Segmentation, By Type
11.3.2.12.2 Rest of Western Europe E-Scooter Sharing Market Segmentation, By Distribution Channel
11.4 Asia-Pacific
11.4.1 Trend Analysis
11.4.2 Asia Pacific E-Scooter Sharing Market Segmentation, by Country
11.4.3 Asia Pacific E-Scooter Sharing Market Segmentation, By Type
11.4.4 Asia Pacific E-Scooter Sharing Market Segmentation, By Distribution Channel
11.4.5 China
11.4.5.1 China E-Scooter Sharing Market Segmentation, By Type
11.4.5.2 China E-Scooter Sharing Market Segmentation, By Distribution Channel
11.4.6 India
11.4.6.1 India E-Scooter Sharing Market Segmentation, By Type
11.4.6.2 India E-Scooter Sharing Market Segmentation, By Distribution Channel
11.4.7 Japan
11.4.7.1 Japan E-Scooter Sharing Market Segmentation, By Type
11.4.7.2 Japan E-Scooter Sharing Market Segmentation, By Distribution Channel
11.4.8 South Korea
11.4.8.1 South Korea E-Scooter Sharing Market Segmentation, By Type
11.4.8.2 South Korea E-Scooter Sharing Market Segmentation, By Distribution Channel
11.4.9 Vietnam
11.4.9.1 Vietnam E-Scooter Sharing Market Segmentation, By Type
11.4.9.2 Vietnam E-Scooter Sharing Market Segmentation, By Distribution Channel
11.4.10 Singapore
11.4.10.1 Singapore E-Scooter Sharing Market Segmentation, By Type
11.4.10.2 Singapore E-Scooter Sharing Market Segmentation, By Distribution Channel
11.4.11 Australia
11.4.11.1 Australia E-Scooter Sharing Market Segmentation, By Type
11.4.11.2 Australia E-Scooter Sharing Market Segmentation, By Distribution Channel
11.4.12 Rest of Asia-Pacific
11.4.12.1 Rest of Asia-Pacific E-Scooter Sharing Market Segmentation, By Type
11.4.12.2 Rest of Asia-Pacific E-Scooter Sharing Market Segmentation, By Distribution Channel
11.5 Middle East & Africa
11.5.1 Trend Analysis
11.5.2 Middle East
11.5.2.1 Middle East E-Scooter Sharing Market Segmentation, by Country
11.5.2.2 Middle East E-Scooter Sharing Market Segmentation, By Type
11.5.2.3 Middle East E-Scooter Sharing Market Segmentation, By Distribution Channel
11.5.2.4 UAE
11.5.2.4.1 UAE E-Scooter Sharing Market Segmentation, By Type
11.5.2.4.2 UAE E-Scooter Sharing Market Segmentation, By Distribution Channel
11.5.2.5 Egypt
11.5.2.5.1 Egypt E-Scooter Sharing Market Segmentation, By Type
11.5.2.5.2 Egypt E-Scooter Sharing Market Segmentation, By Distribution Channel
11.5.2.6 Saudi Arabia
11.5.2.6.1 Saudi Arabia E-Scooter Sharing Market Segmentation, By Type
11.5.2.6.2 Saudi Arabia E-Scooter Sharing Market Segmentation, By Distribution Channel
11.5.2.7 Qatar
11.5.2.7.1 Qatar E-Scooter Sharing Market Segmentation, By Type
11.5.2.7.2 Qatar E-Scooter Sharing Market Segmentation, By Distribution Channel
11.5.2.8 Rest of Middle East
11.5.2.8.1 Rest of Middle East E-Scooter Sharing Market Segmentation, By Type
11.5.2.8.2 Rest of Middle East E-Scooter Sharing Market Segmentation, By Distribution Channel
11.5.3 Africa
11.5.3.1 Africa E-Scooter Sharing Market Segmentation, by Country
11.5.3.2 Africa E-Scooter Sharing Market Segmentation, By Type
11.5.3.3 Africa E-Scooter Sharing Market Segmentation, By Distribution Channel
11.5.3.4 Nigeria
11.5.3.4.1 Nigeria E-Scooter Sharing Market Segmentation, By Type
11.5.3.4.2 Nigeria E-Scooter Sharing Market Segmentation, By Distribution Channel
11.5.3.5 South Africa
11.5.3.5.1 South Africa E-Scooter Sharing Market Segmentation, By Type
11.5.3.5.2 South Africa E-Scooter Sharing Market Segmentation, By Distribution Channel
11.5.3.6 Rest of Africa
11.5.3.6.1 Rest of Africa E-Scooter Sharing Market Segmentation, By Type
11.5.3.6.2 Rest of Africa E-Scooter Sharing Market Segmentation, By Distribution Channel
11.6 Latin America
11.6.1 Trend Analysis
11.6.2 Latin America E-Scooter Sharing Market Segmentation, by Country
11.6.3 Latin America E-Scooter Sharing Market Segmentation, By Type
11.6.4 Latin America E-Scooter Sharing Market Segmentation, By Distribution Channel
11.6.5 Brazil
11.6.5.1 Brazil E-Scooter Sharing Market Segmentation, By Type
11.6.5.2 Brazil E-Scooter Sharing Market Segmentation, By Distribution Channel
11.6.6 Argentina
11.6.6.1 Argentina E-Scooter Sharing Market Segmentation, By Type
11.6.6.2 Argentina E-Scooter Sharing Market Segmentation, By Distribution Channel
11.6.7 Colombia
11.6.7.1 Colombia E-Scooter Sharing Market Segmentation, By Type
11.6.7.2 Colombia E-Scooter Sharing Market Segmentation, By Distribution Channel
11.6.8 Rest of Latin America
11.6.8.1 Rest of Latin America E-Scooter Sharing Market Segmentation, By Type
11.6.8.2 Rest of Latin America E-Scooter Sharing Market Segmentation, By Distribution Channel

12. Company Profiles
12.1  Neutron Holdings Inc
12.1.1 Company Overview
12.1.2 Financial
12.1.3 Products/ Services Offered
12.1.4 SWOT Analysis
12.1.5 The SNS View
12.2 Cityscoot
12.2.1 Company Overview
12.2.2 Financial
12.2.3 Products/ Services Offered
12.2.4 SWOT Analysis
12.2.5 The SNS View
12.3 Cooltra Motosharing SLU
12.3.1 Company Overview
12.3.2 Financial
12.3.3 Products/ Services Offered
12.3.4 SWOT Analysis
12.3.5 The SNS View
12.4 Bird Global Inc
12.4.1 Company Overview
12.4.2 Financial
12.4.3 Products/ Services Offered
12.4.4 SWOT Analysis
12.4.5 The SNS View
12.5 Vogo Automotive Pvt Ltd
12.5.1 Company Overview
12.5.2 Financial
12.5.3 Products/ Services Offered
12.5.4 SWOT Analysis
12.5.5 The SNS View
12.6 Go To Global Mobility Ltd
12.6.1 Company Overview
12.6.2 Financial
12.6.3 Products/ Services Offered
12.6.4 SWOT Analysis
12.6.5 The SNS View
12.7 Lyft Inc
12.7.1 Company Overview
12.7.2 Financial
12.7.3 Products/ Services Offered
12.7.4 SWOT Analysis
12.7.5 The SNS View
12.8 VOI Technology
12.8.1 Company Overview
12.8.2 Financial
12.8.3 Products/ Services Offered
12.8.4 SWOT Analysis
12.8.5 The SNS View

13. Competitive Landscape
13.1 Competitive Benchmarking
13.2 Market Share Analysis
13.3 Recent Developments
13.3.1 Industry News
13.3.2 Company News
13.3.3 Mergers & Acquisitions

14. USE Cases and Best Practices

15. Conclusion

An accurate research report requires proper strategizing as well as implementation. There are multiple factors involved in the completion of good and accurate research report and selecting the best methodology to compete the research is the toughest part. Since the research reports we provide play a crucial role in any company’s decision-making process, therefore we at SNS Insider always believe that we should choose the best method which gives us results closer to reality. This allows us to reach at a stage wherein we can provide our clients best and accurate investment to output ratio.

Each report that we prepare takes a timeframe of 350-400 business hours for production. Starting from the selection of titles through a couple of in-depth brain storming session to the final QC process before uploading our titles on our website we dedicate around 350 working hours. The titles are selected based on their current market cap and the foreseen CAGR and growth.


The 5 steps process:

Step 1: Secondary Research:

Secondary Research or Desk Research is as the name suggests is a research process wherein, we collect data through the readily available information. In this process we use various paid and unpaid databases which our team has access to and gather data through the same. This includes examining of listed companies’ annual reports, Journals, SEC filling etc. Apart from this our team has access to various associations across the globe across different industries. Lastly, we have exchange relationships with various university as well as individual libraries.

Secondary Research

Step 2: Primary Research

When we talk about primary research, it is a type of study in which the researchers collect relevant data samples directly, rather than relying on previously collected data.  This type of research is focused on gaining content specific facts that can be sued to solve specific problems. Since the collected data is fresh and first hand therefore it makes the study more accurate and genuine.

We at SNS Insider have divided Primary Research into 2 parts.

Part 1 wherein we interview the KOLs of major players as well as the upcoming ones across various geographic regions. This allows us to have their view over the market scenario and acts as an important tool to come closer to the accurate market numbers. As many as 45 paid and unpaid primary interviews are taken from both the demand and supply side of the industry to make sure we land at an accurate judgement and analysis of the market.

This step involves the triangulation of data wherein our team analyses the interview transcripts, online survey responses and observation of on filed participants. The below mentioned chart should give a better understanding of the part 1 of the primary interview.

Primary Research

Part 2: In this part of primary research the data collected via secondary research and the part 1 of the primary research is validated with the interviews from individual consultants and subject matter experts.

Consultants are those set of people who have at least 12 years of experience and expertise within the industry whereas Subject Matter Experts are those with at least 15 years of experience behind their back within the same space. The data with the help of two main processes i.e., FGDs (Focused Group Discussions) and IDs (Individual Discussions). This gives us a 3rd party nonbiased primary view of the market scenario making it a more dependable one while collation of the data pointers.

Step 3: Data Bank Validation

Once all the information is collected via primary and secondary sources, we run that information for data validation. At our intelligence centre our research heads track a lot of information related to the market which includes the quarterly reports, the daily stock prices, and other relevant information. Our data bank server gets updated every fortnight and that is how the information which we collected using our primary and secondary information is revalidated in real time.

Data Bank Validation

Step 4: QA/QC Process

After all the data collection and validation our team does a final level of quality check and quality assurance to get rid of any unwanted or undesired mistakes. This might include but not limited to getting rid of the any typos, duplication of numbers or missing of any important information. The people involved in this process include technical content writers, research heads and graphics people. Once this process is completed the title gets uploader on our platform for our clients to read it.

Step 5: Final QC/QA Process:

This is the last process and comes when the client has ordered the study. In this process a final QA/QC is done before the study is emailed to the client. Since we believe in giving our clients a good experience of our research studies, therefore, to make sure that we do not lack at our end in any way humanly possible we do a final round of quality check and then dispatch the study to the client.

MARKET SEGMENTS

By Type

  • Free-Floating

  • Station-Bound

By Distribution Channel

  • Online

  • Offline

Request for Segment Customization as per your Business Requirement: Segment Customization Request

REGIONAL COVERAGE:

North America

  • US

  • Canada

  • Mexico

Europe

  • Eastern Europe

    • Poland

    • Romania

    • Hungary

    • Turkey

    • Rest of Eastern Europe

  • Western Europe

    • Germany

    • France

    • UK

    • Italy

    • Spain

    • Netherlands

    • Switzerland

    • Austria

    • Rest of Western Europe

Asia Pacific

  • China

  • India

  • Japan

  • South Korea

  • Vietnam

  • Singapore

  • Australia

  • Rest of Asia Pacific

Middle East & Africa

  • Middle East

    • UAE

    • Egypt

    • Saudi Arabia

    • Qatar

    • Rest of the Middle East

  • Africa

    • Nigeria

    • South Africa

    • Rest of Africa

Latin America

  • Brazil

  • Argentina

  • Colombia

  • Rest of Latin America

Request for Country Level Research Report: Country Level Customization Request

Available Customization

  • With the given market data, SNS Insider offers customization as per the company’s specific needs. The following customization options are available for the report:
  • Product Analysis
  • Criss-Cross segment analysis (e.g. Product X Application)
  • Product Matrix which gives a detailed comparison of product portfolio of each company
  • Geographic Analysis
  • Additional countries in any of the regions
  • Company Information
  • Detailed analysis and profiling of additional market players (Up to five)

  •            5000 (33% Discount)


  •            8950 (40% Discount)


  •            3050 (23% Discount)

Start a Conversation

Hi! Click one of our member below to chat on Phone