Shared Mobility Market Report Scope & Overview:
Get More Information on Shared Mobility Market - Request Sample Report
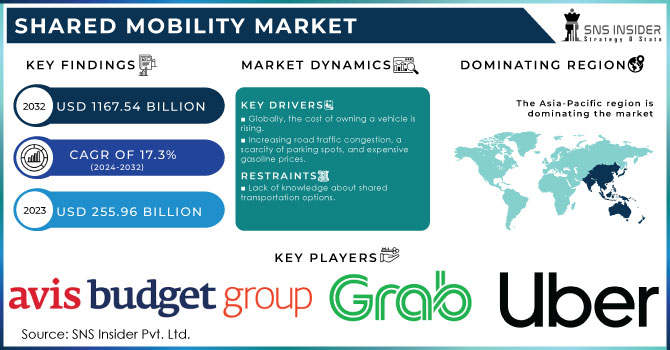
The Shared Mobility Market size was valued at USD 255.96 Billion in 2023 and is expected to reach USD 1167.54 Billion by 2032 and grow at a CAGR of 17.3% over the forecast period 2024-2032.
Shared Mobility is a commuting service that allows commuters to share transportation services. In a Shared Mobility service, a commercial vehicle owner shares their vehicle with an organization that subsequently uses it for ride-sharing, hiring, and mobility services, with a price based entirely on the distance and duration of the journey. Taxis, car sharing, bike sharing, scooter sharing, limousines, ridesharing, and a variety of other vehicles are all examples of shared mobility.
Shared mobility is a commuting service in which businesses arrange for commercial cars to transport people from one location to another. The owner of a fleet of commercial cars lends it to the organization, which utilizes it to deliver services including hiring, ride-sharing, and mobility. The charge is entirely determined by the customer's travel distance and time to the destination. Due to various factors such as rapid urbanization, increased environmental concerns, limited energy resources, and economic concerns, the trend of shared transportation has exploded in recent years, and this trend is expected to continue to boost the global shared mobility market over the forecast period.
Vilnius, Lithuania's capital, has created the Vilnius Shared Mobility Hub, a mobility cluster aimed at enhancing the city's car-sharing services and economic innovations while also encouraging sustainability by lowering the number of private automobiles in the city. Vilnius has been implementing car-sharing programs for ten years and now has roughly 1.5 million shared vehicle rides per year, making it the European city with the most. Almost one-fifth of Vilnius inhabitants have used a car-sharing service at some time, and the city has the highest car-sharing density in the area, with 800 vehicles per one million people.
MARKET DYNAMICS:
KEY DRIVERS:
-
Globally, the cost of owning a vehicle is rising.
-
Internet usage is increasing.
-
Increasing road traffic congestion, a scarcity of parking spots, and expensive gasoline prices.
Increasing road traffic, lack of parking facilities, and increasing oil prices are becoming serious issues in the urban areas all around the world. As a result of speed urbanization and growth in population, the number of vehicles within cities is tremendous, thus causing congested roads and lost hours for commuters. More and more vehicles within the infrastructure strain it down, leading to inefficient transportation. Adding to the problem is a lack of available parking that leads to significant time searching for parking, aggravating congestion and frustration. Since few spots in overcrowded cities raised parking fees, drivers add more money to their expenses.
Adding to the problem are rising gasoline prices making personal automobile ownership increasingly prohibitive. With the rising fuel price, more commuters are now choosing alternative modes of commuting such as ride-sharing, public transport, or even micro-mobility like bike-sharing and e-scooters. All these are taking the city planners and policymakers toward sustainable transportation strategies, as well as stronger public transport networks, smart traffic management, and incentives for electric vehicles to eliminate dependency on petrol. All these factors work together to ease traffic, reduce intake of fuel, and make cities habitable.
RESTRAINTS:
-
Lack of knowledge about shared transportation options.
-
Unease about traveling with strangers as drivers and passengers.
Many are apprehensive about riding with strangers who are drivers or fellow travelers, especially with ride-share services and carpool situations. Much of the fear is generally related to safety concerns because a stranger may be placed into a car with someone whom they have no confidence in. Thus, while technology has developed and now enables background checks and rating of drivers, there is still the potential for some unknowns and concerns over aberrant behavior or not being checked.
The anxiety level among drivers can also rise from the feeling of sharing a ride with strangers. Drivers worry in that the passengers may be rowdy or unsecure while aboard their vehicle. They have no control over who gets into the vehicle. The discomfort is also occasioned by cultural and social aspects when personal space and privacy are disregarded in shared transportation.
Although ride-sharing companies have put in place many safety features, such as real-time tracking on GPS, emergency buttons, and identity verification, for many passengers, this feeling cannot be completely relinquished. The challenge of placing trust between drivers and passengers is still rife, although the growth of peer reviews, in-app communication, and shared preferences has almost mitigated these challenges and therefore made a safer and more pleasant mobility experience. For others, the thought of traveling with strangers remains the biggest challenge to the adoption of shared mobility solutions.
Market Segmentation Analysis:
By Service Model:
The growth of ride-hailing has dominated the shared mobility market, with a high share of 45-50% influenced by convenience and flexible supply options by platforms like Uber and Lyft. Ride-sharing at 20-25% fosters affordable travel that makes one share rides for daily commutes or long trips. Bike-sharing service stands at 15-20%, which is the fastest-growing share for short-distance and eco-friendly travel and in urban areas. Car-sharing account for a 10-15% market share, bringing in users who want access to vehicles over shorter periods and without the associated costs of vehicle ownership, and is led by companies like Zipcar. The final 2-5% is comprised of "Others," or emerging services, including shuttle and scooter-sharing, which could offer more specialized forms of mobility.
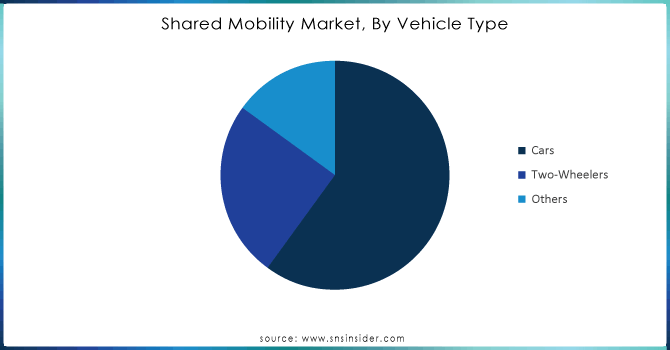
By Vehicle Type:
Cars take up the majority of the market of shared mobility at about 60-65% since they are used on the whole in ride-hailing, ride-sharing, and car-sharing applications primarily because people like the comfort of using them. Two-wheelers like the motorcycle and scooter take up about 25-30% of the market since they fit the requirement for people living in crowded regions to rapidly travel over shorter distances. Others make up about 5-10% of the mix: electric scooters and three-wheelers, brought into shared mobility platforms for the achievement of last-mile and micro-mobility needs.
Get Customized Report as per your Business Requirement - Ask For Customized Report
By Business Model:
The P2P models dominate a significant part of the share of mobility markets. Here, individuals rent their privately owned vehicles to other people with the aid of online platforms such as Turo and Getaround. P2P presents flexibility for individuals with own vehicles to generate extra revenue while offering access to vehicles at affordable prices to the end-user. This model appears most prevalent in urban settings where car ownership is expensive but access to a vehicle may be required from time to time.
Another hot trend is Business-to-Business (B2B) models. Many companies are now leveraging shared mobility solutions to ensure the transportation of employees and handle logistics. Corporations attain efficiency in their fleets, reduce operational costs, and become more sustainable by reducing dependency on private vehicles through B2B services. Online corporate carpooling and shared fleets are now a part of the company's mobility strategy.
The biggest market is the Business-to-Consumer, or B2C, models. These companies include Uber, Lyft, and Zipcar, which go straight to the consumer. B2C model: the fleet is owned and operated by a business and offers a way for car-sharing, ride-hailing, and even bike-sharing. B2C models work well in heavily populated cities because people want to get around easily and don't have time to own their own vehicles.
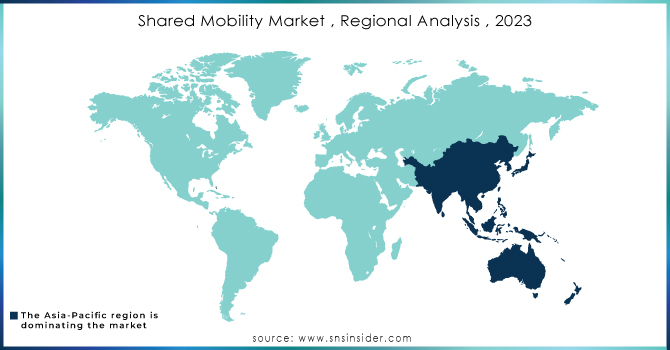
REGIONAL ANALYSIS:
Because of rising on-road vehicle traffic and vehicle ownership prices in countries such as China and India, the Asia-Pacific (APAC) region dominates the shared mobility industry.
The Middle East and Africa (MEA) area is predicted to develop significantly from 2024 to 2031, owing to a strong demand for shared transportation solutions due to an increase in the number of business travelers in various countries.
KEY PLAYERS:
The major key players are as follows:
-
Avis Budget Group: (Car rental, car-sharing services (via Zipcar))
-
car2go NA LLC: (Products/Services: Free-floating car-sharing services)
-
Beijing Xiaoju Technology Co Ltd. (Didi Chuxing): (Ride-hailing, carpooling, bike-sharing)
-
Global Car Sharing Car Rental Ltd.: (Car-sharing services)
-
Grab: (Ride-hailing, bike-sharing, car-sharing, food delivery)
-
Uber Technologies Inc.: (Ride-hailing, bike and scooter sharing, Uber Pool (carpooling), Uber Eats.)
-
ANI Technologies Pvt. Ltd. (Ola): (Ride-hailing, car rentals, bike-sharing)
-
Lyft Inc.: (Ride-hailing, bike-sharing, scooter-sharing)
-
Careem: (Ride-hailing, car rental, bike-sharing, food delivery)
-
Gett: (Corporate ride-hailing, on-demand taxi services)
-
BlaBlaCar: (Long-distance carpooling and shared travel)
-
Zipcar: (Car-sharing services)
-
Turo: (Peer-to-peer car rental)
Share Now: (Car-sharing services (formerly car2go)) -
Splyt: (Mobility integration platform for ride-hailing and other transport services)
| Report Attributes | Details |
|---|---|
| Market Size in 2023 | US$ 225.96 Billion |
| Market Size by 2032 | US$ 1167.54 Billion |
| CAGR | CAGR of 17.3% From 2024 to 2032 |
| Base Year | 2023 |
| Forecast Period | 2024-2032 |
| Historical Data | 2020-2022 |
| Report Scope & Coverage | Market Size, Segments Analysis, Competitive Landscape, Regional Analysis, DROC & SWOT Analysis, Forecast Outlook |
| Key Segments | • by Service Model (Ride-Hailing, Bike Sharing, Ride Sharing, Car Sharing, Others) • By Vehicles (Cars, Two-Wheelers, Others) • by Business Model (P2P, B2B, B2C) • by Power Source(Fuel Powered, Hybrid Electric Vehicle, Plug-in Hybrid Electric Vehicle, Battery Electric Vehicle) |
| Regional Analysis/Coverage | North America (US, Canada, Mexico), Europe (Eastern Europe [Poland, Romania, Hungary, Turkey, Rest of Eastern Europe] Western Europe] Germany, France, UK, Italy, Spain, Netherlands, Switzerland, Austria, Rest of Western Europe]), Asia Pacific (China, India, Japan, South Korea, Vietnam, Singapore, Australia, Rest of Asia Pacific), Middle East & Africa (Middle East [UAE, Egypt, Saudi Arabia, Qatar, Rest of Middle East], Africa [Nigeria, South Africa, Rest of Africa], Latin America (Brazil, Argentina, Colombia, Rest of Latin America) |
| Company Profiles | Avis Budget Group, car2go NA LLC, Beijing Xiaoju Technology Co Ltd., global car-sharing car rental Ltd., Grab, Uber Technologies Inc., ANI Technologies Pvt. Ltd., Lyft Inc., Careem, Gett. |
| Key Drivers |
• Globally, the cost of owning a vehicle is rising. • Internet usage is increasing. |
| RESTRAINTS |
• Lack of knowledge about shared transportation options. • Unease about traveling with strangers as drivers and passengers. |
Frequently Asked Questions
Ans: - The study includes a comprehensive analysis of Shared Mobility Market trends, as well as present and future market forecasts. DROC analysis, as well as impact analysis for the projected period. Porter's five forces analysis aids in the study of buyer and supplier potential as well as the competitive landscape etc.
Ans: - The primary growth tactics of Shared Mobility market participants include merger and acquisition, business expansion, and product launch.
Ans: - The Asia-Pacific (APAC) region dominates the shared mobility industry.
Ans: - Globally, the cost of owning a vehicle is rising and Internet usage is increasing.
Ans: - The Shared Mobility market size was valued at USD 255.96 Bn in 2023.
Get in Touch
