Edge Analytics Market Size & Overview:
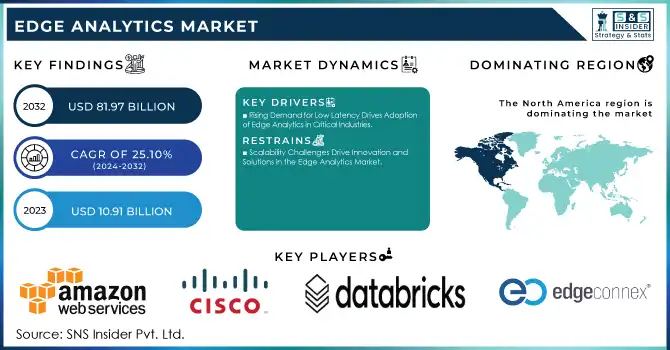
The Edge Analytics Market was valued at USD 10.91 billion in 2023 and is expected to reach USD 81.97 billion by 2032, growing at a CAGR of 25.10% from 2024-2032.
Get more information on Edge Analytics Market - Request Free Sample Report
The Edge Analytics market is experiencing notable growth, driven by the swift proliferation of Internet of Things devices and the increasing need for real-time data processing. The total of connected IoT devices is anticipated to increase by 13% to reach 18.8 billion by the close of 2024, producing substantial volumes of data at the network edge. Consequently, companies are progressively looking for solutions that can evaluate this data on-site, minimizing the requirement to send substantial amounts to centralized cloud systems. 68% of IoT initiatives currently incorporate AI at the edge to improve real-time analytics, thus increasing the need for edge analytics solutions. This trend is enhanced by improvements in 5G connectivity, facilitating quicker and more dependable data transfer, which aids low-latency, real-time analysis. As a result, edge analytics boosts operational efficiency, lowers expenses, and enhances decision-making abilities, driving market expansion.
The growing volume and complexity of data generated by connected devices are creating an urgent need for solutions that can process and analyze this information quickly and efficiently. With 2.5 quintillion bytes of data created every day and around 4.66 billion active Internet users worldwide, industries like manufacturing, healthcare, automotive, and smart cities are driving demand for edge analytics. These sectors rely on real-time insights to make critical decisions and optimize operations. The integration of cloud and edge systems is becoming a key trend, as businesses combine the scalability of cloud computing with the real-time processing power of edge analytics to enhance performance. Furthermore, as organizations prioritize data security, edge analytics offers a secure environment for processing sensitive information locally, further driving its adoption and ensuring secure, efficient data management across industries.
The Edge Analytics market is poised for continued growth, driven by emerging technologies such as artificial intelligence and machine learning. Integrating AI and ML at the edge enables businesses to make predictive and automated decisions without relying on centralized systems, enhancing operational efficiency. The demand for edge analytics will only intensify with the proliferation of connected devices in areas such as autonomous vehicles, healthcare, and smart grids. As industries increasingly rely on data-driven solutions to drive innovation, edge analytics will remain a crucial enabler for real-time, intelligent decision-making and unlock new opportunities for automation and optimization across diverse sectors.
Edge Analytics Market Dynamics
Drivers
-
Advancements in Edge Computing and AI Drive Growth in Edge Analytics Market
Recent advancements in edge computing technology and artificial intelligence (AI) are enabling faster and more efficient data processing at the source, significantly reducing reliance on centralized cloud systems. With more powerful edge computing devices, data can be processed locally in real time, minimizing latency and bandwidth consumption. The integration of advanced AI algorithms further enhances the capability to make immediate, data-driven decisions at the edge. These improvements not only simplify the deployment of edge analytics solutions but also enable scalability across diverse industries. As a result, sectors such as healthcare, manufacturing, and autonomous systems are increasingly adopting edge analytics to optimize operations, improve decision-making, and address growing data volumes more efficiently.
-
Rising Demand for Low Latency Drives Adoption of Edge Analytics in Critical Industries
Real-time decision-making is crucial in sectors like autonomous vehicles, healthcare, and manufacturing, where immediate insights are essential for safety, efficiency, and performance. In autonomous vehicles, for example, processing data from sensors and cameras with minimal delay allows for split-second decisions that ensure safe navigation. Healthcare applications require instant data analysis to monitor patient conditions, enabling timely interventions. In manufacturing, real-time processing of data from IoT devices supports predictive maintenance, reducing downtime and improving operational efficiency. Edge analytics enables these low-latency requirements by processing data locally at the source, eliminating the delays caused by transmitting information to centralized systems. This capability enhances decision-making speed, ensuring better outcomes and driving the adoption of edge analytics across these high-demand industries.
Restrains
-
Scalability Challenges Drive Innovation and Solutions in the Edge Analytics Market
As the number of edge devices in large, distributed networks continues to increase, managing and scaling edge analytics solutions has become more complex. The growing volume of data generated at the edge demands efficient, flexible systems that can handle the influx without compromising performance or reliability. To address scalability issues, organizations are seeking more robust edge analytics solutions capable of seamlessly managing vast networks of connected devices. This need is driving innovation in the development of scalable architectures and advanced data processing techniques that can optimize performance across decentralized environments. Solutions that can handle the expanding scale of edge devices are crucial for industries like manufacturing, logistics, and smart cities, where widespread adoption of IoT devices necessitates the ability to process and analyze data in real time at the edge.
Edge Analytics Market SEGMENT ANALYSIS
By Component
In 2023, the Solution segment dominated the edge analytics market with the highest revenue share of approximately 71%. This dominance is primarily driven by the increasing demand for edge analytics platforms that enable real-time data processing and decision-making at the edge. Organizations across various industries, such as manufacturing, healthcare, and transportation, have been investing heavily in edge solutions to enhance operational efficiency, reduce latency, and improve data security. These solutions allow businesses to process large volumes of data locally, offering greater scalability and performance.
The Service segment is expected to grow at the fastest CAGR of about 26.71% from 2024 to 2032. This rapid growth is largely attributed to the increasing need for tailored support and maintenance services to ensure seamless deployment and ongoing optimization of edge analytics solutions. As businesses expand their edge infrastructures, they require specialized consulting, integration, and managed services to effectively implement and manage complex edge analytics environments.
By Application
In 2023, the Marketing & Sales segment dominated the edge analytics market with the highest revenue share of approximately 38%. This dominance is driven by the increasing reliance on real-time data insights to optimize customer engagement, personalize marketing strategies, and improve sales performance. By leveraging edge analytics, businesses can analyze customer behavior, market trends, and sales performance instantly, allowing for timely and data-driven decision-making that enhances overall marketing efficiency.
The Operations segment is expected to grow at the fastest CAGR of about 26.89% from 2024 to 2032. This surge is largely due to the growing need for operational efficiency and process optimization across industries. Organizations are increasingly turning to edge analytics to streamline their operations, reduce downtime, and enhance productivity. With the ability to monitor and analyze real-time data from manufacturing processes, supply chains, and equipment, companies can make quicker, more informed decisions that drive cost savings and performance improvements, propelling the rapid growth of the operations segment.
By Type
In 2023, the Descriptive Analytics segment dominated the edge analytics market with the highest revenue share of approximately 38%. This dominance is attributed to its ability to provide valuable insights into historical data, helping businesses understand past performance and trends. By processing data locally at the edge, organizations can gain real-time insights into customer behavior, operational efficiency, and market trends without delays, allowing for more informed decision-making. The simplicity and effectiveness of descriptive analytics in various industries, including retail, manufacturing, and finance.
The Prescriptive analytics segment is expected to grow at the fastest CAGR of about 27.88% from 2024 to 2032. This growth is driven by the increasing demand for actionable insights that not only explain what has happened but also recommend the best course of action. As businesses seek to optimize operations, reduce costs, and improve outcomes, prescriptive analytics is becoming essential. With its ability to use real-time data to make data-driven recommendations, prescriptive analytics is gaining traction in industries.
By Deployment
The Cloud segment dominated the edge analytics market with the highest revenue share of approximately 55% in 2023 and is expected to grow at the fastest CAGR of about 25.85% from 2024 to 2032. This dominance is driven by the scalability, flexibility, and cost-effectiveness that cloud solutions offer, enabling businesses to store, process, and analyze vast amounts of data seamlessly. The ability to integrate cloud-based edge analytics with advanced machine learning, AI, and IoT applications has enhanced its appeal across industries such as healthcare, retail, and manufacturing. As organizations increasingly adopt cloud infrastructures for their edge computing needs, the demand for cloud-based edge analytics solutions continues to rise, fueling both its market dominance and rapid growth in the coming years.
Regional Analysis
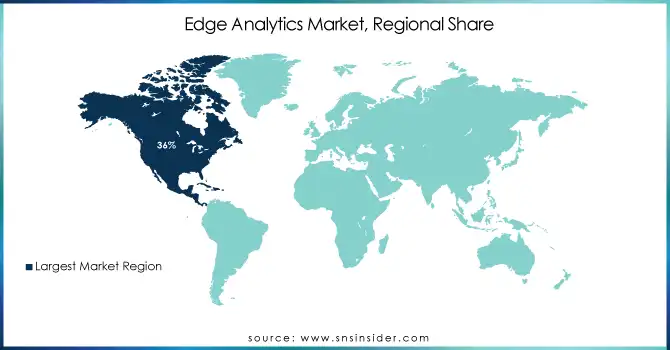
In 2023, North America dominated the edge analytics market with the highest revenue share of approximately 36%. This leadership is primarily driven by the region's advanced technological infrastructure, high adoption of IoT devices, and strong investments in edge computing and AI technologies. Businesses in North America, particularly in industries like healthcare, automotive, and manufacturing, have been early adopters of edge analytics solutions to enhance operational efficiency, reduce latency, and ensure real-time decision-making. The region's supportive regulatory environment and a skilled workforce further contribute to its dominance in the market.
The Asia Pacific region is expected to grow at the fastest CAGR of about 27.20% from 2024 to 2032. This growth is fueled by rapid industrialization, a surge in IoT device deployment, and increasing investments in digital transformation across key markets like China, India, and Japan. The need for localized data processing and real-time analytics in sectors such as manufacturing, logistics, and smart cities is driving demand for edge analytics solutions. As businesses in the region seek to optimize operations and improve decision-making, the market for edge analytics in Asia Pacific is set for exponential growth.
Need any customization research on Edge Analytics Market - Enquiry Now
Key Players:
-
Amazon Web Service Inc. (AWS IoT, AWS Lambda)
-
Cisco Systems Inc. (Cisco Edge Intelligence, Cisco Kinetic for Cities)
-
Databricks (Databricks Unified Data Analytics Platform, Delta Lake)
-
Dell Statistica (Statistica Analytics Platform, Statistica Data Miner)
-
EdgeConneX (Edge Data Centers, Edge Cloud Solutions)
-
Hewlett Packard Enterprise Development LP (HPE GreenLake, HPE Edgeline)
-
IBM Corporation (IBM Edge Application Manager, IBM Watson IoT)
-
Intel Corporation (Intel IoT Gateway, Intel NUC for Edge Analytics)
-
Microsoft (Azure IoT Edge, Microsoft Power BI)
-
Oracle Corporation (Oracle IoT Cloud, Oracle Autonomous Database)
-
PTC (ThingWorx IoT Platform, Vuforia Augmented Reality)
-
SAP HANA (SAP HANA Cloud, SAP Edge Services)
-
SAS Institute Inc. (SAS Visual Analytics, SAS Viya)
-
Apigee Corporation (Apigee API Platform, Apigee Edge)
-
Predixion Software (Predixion Insight, Predixion Edge Analytics)
-
AGT International Inc. (AGT Smart City Solutions, AGT IoT Platform)
-
Foghorn Systems (Foghorn Edge AI, Foghorn Lightning)
-
CGI Group Inc. (CGI Advantage, CGI IoT Platform)
-
Greenwave Systems (Greenwave IoT Platform, Greenwave Edge Services)
-
Equinix, Inc. (Equinix Metal, Equinix SmartKey)
-
IGUAZIO (Iguazio Data Science Platform, Iguazio Enterprise AI)
Recent Developments-
-
In September 2024, Belden integrated its CloudRail software with AWS IoT SiteWise Edge to enhance industrial data acquisition and processing, enabling seamless edge-to cloud workflows for asset monitoring and predictive maintenance, supporting both modern and legacy equipment.
-
In January 2024, American Tower and IBM partnered to offer edge cloud services, combining 5G, AI, and edge computing to enhance enterprise innovation and customer experiences. This collaboration focuses on bringing hybrid cloud solutions closer to data sources, enabling real-time processing and insights.
| Report Attributes | Details |
|---|---|
| Market Size in 2023 | USD 10.91 Billion |
| Market Size by 2032 | USD 81.57 Billion |
| CAGR | CAGR of 25.10% From 2024 to 2032 |
| Base Year | 2023 |
| Forecast Period | 2024-2032 |
| Historical Data | 2020-2022 |
| Report Scope & Coverage | Market Size, Segments Analysis, Competitive Landscape, Regional Analysis, DROC & SWOT Analysis, Forecast Outlook |
| Key Segments | • By Type (Descriptive Analytics, Diagnostic Analytics, Predictive Analytics, Prescriptive Analytics) • By Component (Solution, Service) • By Deployment (On-Premises, Cloud) • By Application (Marketing & Sales, Operations, Finance, Human Resources, Others) • By End-use Industry (IT & Telecom, BFSI, Manufacturing, Healthcare and Life Science, Retail, Transportation and Logistics, Government, Energy and Utilities, Others) |
| Regional Analysis/Coverage | North America (US, Canada, Mexico), Europe (Eastern Europe [Poland, Romania, Hungary, Turkey, Rest of Eastern Europe] Western Europe] Germany, France, UK, Italy, Spain, Netherlands, Switzerland, Austria, Rest of Western Europe]), Asia Pacific (China, India, Japan, South Korea, Vietnam, Singapore, Australia, Rest of Asia Pacific), Middle East & Africa (Middle East [UAE, Egypt, Saudi Arabia, Qatar, Rest of Middle East], Africa [Nigeria, South Africa, Rest of Africa], Latin America (Brazil, Argentina, Colombia, Rest of Latin America) |
| Company Profiles | Amazon Web Services Inc., Cisco Systems Inc., Databricks, Dell Statistica, EdgeConneX, Hewlett Packard Enterprise Development LP, IBM Corporation, Intel Corporation, Microsoft, Oracle Corporation, PTC, SAP HANA, SAS Institute Inc., Apigee Corporation, Predixion Software, AGT International Inc., Foghorn Systems, CGI Group Inc., Greenwave Systems, Equinix, Inc., IGUAZIO. |
| Key Drivers | • Advancements in Edge Computing and AI Drive Growth in Edge Analytics Market • Rising Demand for Low Latency Drives Adoption of Edge Analytics in Critical Industries |
| RESTRAINTS | • Scalability Challenges Drive Innovation and Solutions in the Edge Analytics Market • Data Privacy and Security Concerns Pose Challenges for the Edge Analytics Market |
Frequently Asked Questions
Ans: The Solution segment dominated the market with a 71% revenue share.
Ans: The Operations segment is expected to grow at a CAGR of 26.89%.
Ans. The Descriptive Analytics segment dominated with a 38% revenue share.
Ans: North America dominated with a 55% revenue share.
Ans: Edge Analytics Market was valued at USD 10.91 billion in 2023 and is expected to reach USD 81.97 billion by 2032, growing at a CAGR of 25.10% from 2024-2032.
Get in Touch
