Farm Software Management Solution Market Report Scope & Overview:
The Farm Software Management Solution Market size was valued at USD 2.41 billion in 2025 and is expected to reach USD 5.37 billion by 2035, expanding at a CAGR of 8.37% over the forecast period of 2026–2035.
The global farm software management solution market trend is a growing demand for digital agricultural tools such as farm management platforms, precision agriculture software, and crop analytics solutions as the growth of the market is driven by increasing smartphone adoption among farmers, government mandates for agricultural digitization, and farmer expectations for convenient access to field data and operational records. This trend is also driven by a growing adoption of data-driven farming models and the growing focus on resource-efficient agriculture as farm operators become more focused on improving yield outcomes and are more willing to invest in digital management technologies, resulting in growth in the domestic and international market for cloud-based and web-based farm software management solutions.
For instance, in February 2024, growing awareness and improved rural digital infrastructure drove a 24% increase in farm management software registrations for agricultural enterprises in North America, boosting farm operational efficiency and remote field monitoring adoption.
Farm Software Management Solution Market Size and Forecast:
-
Market Size in 2025E: USD 2.41 billion
-
Market Size by 2035: USD 5.37 billion
-
CAGR: 8.37% from 2026 to 2035
-
Base Year: 2025
-
Forecast Period: 2026–2035
-
Historical Data: 2022–2024

To Get more information on Farm Software Management Solution - Request Free Sample Report
Farm Software Management Solution Market Trends
-
Farm software management solutions are being adopted because farmers demand fast access to crop records, field activity scheduling, and input cost tracking.
-
Customized farm management tools based on crop type, farm size, and regional conditions to improve operational outcomes and resource utilization.
-
The development of AI-powered crop advisory tools, mobile farm management applications, and open-source platforms to improve communication between farm operators and agronomists and reduce administrative burden.
-
Secure data sharing systems, remote field monitoring, and IoT-integrated farm management platforms are all available to ensure continuous delivery of agronomic support and input management.
-
Increased demand for cloud-based solutions, mobile-responsive interfaces, and self-service farm portals to support field data access and operational data security.
-
Collaboration between agricultural software vendors, equipment manufacturers, and ERP providers to develop integrated farm management systems and improve standards of data interoperability.
-
USDA, FAO, and EU agricultural agencies promoting standards for farm data privacy, compliance with agricultural record-keeping mandates, and farmer data access rights.
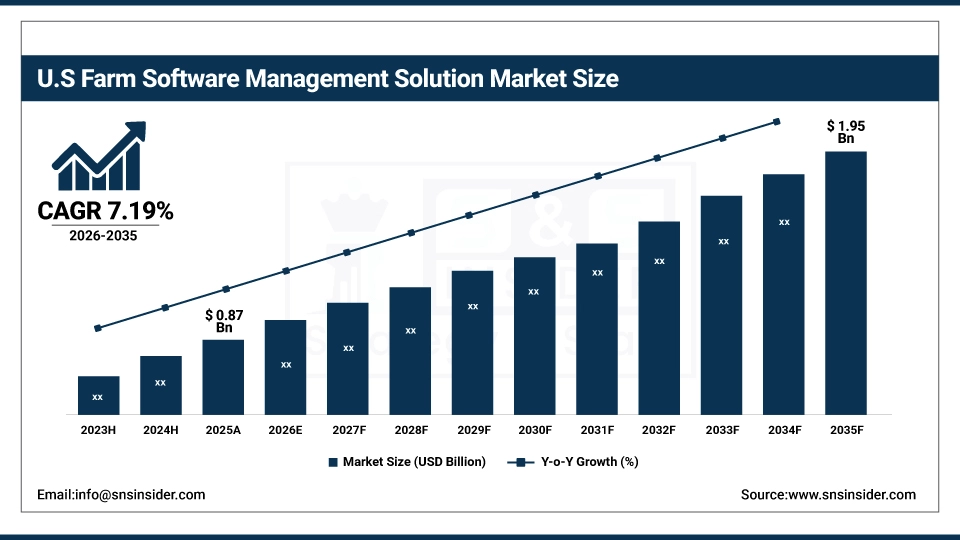
U.S. Farm Software Management Solution Market Size Outlook
The U.S. Farm Software Management Solution Market was valued at USD 0.87 billion in 2025 and is expected to reach USD 1.95 billion by 2035, growing at a CAGR of 8.41% from 2026–2035. The United States represents the largest market for farm software management solutions, primarily driven by the widespread EHR-equivalent farm record-keeping adoption, federal regulations facilitating access to agricultural data, and well-developed agri-tech infrastructure. Government incentives, high levels of commercial farm insurance penetration, and increased producer and agribusiness spending on agricultural technology help to drive growth in the market. Also, the U.S. is the largest regional market in the world, due to the regulatory support and swift adoption of cloud- and mobile-based precision agriculture solutions.
Farm Software Management Solution Market Growth Drivers:
-
Government Mandates and Regulatory Support is Driving the Farm Software Management Solution Market Growth
Government mandates and regulatory support take the center stage as a growth driver for the farm software management solution market share, and are driven by the implementation of USDA digital agriculture requirements, EU Farm-to-Fork strategy compliance obligations, and national agri-data access regulations for increased farm data accessibility and agricultural transparency. These solutions for agricultural digitization and farmer empowerment are driving the base of the market, the penetration of cloud-based and on-premises markets, and adding to the overall market share globally.
For instance, in July 2024, cloud-based and integrated farm software management solutions accounted for ~62% of total U.S. agricultural technology investments among commercial farming enterprises, reflecting growing institutional preference and expanding market share.
Farm Software Management Solution Market Restraints:
-
Low Farmer Adoption and Digital Literacy Challenges are Hampering the Farm Software Management Solution Market Growth
Low farmer adoption and digital literacy challenges of farm management software also restrict the farm software management solution market growth, as a large number of farmers who have access to platform credentials remain inactive or face difficulties navigating digital agricultural interfaces. This might lead to underutilization, limited engagement, and reduced return on investment for agricultural technology organizations. As a result, farm operational outcomes suffer, and market growth is stunted in regions where smallholder farming populations are prevalent and digital agriculture education is limited.
Farm Software Management Solution Market Opportunities:
-
AI Integration and Advanced Farm Analytics Drive Future Growth Opportunities for the Farm Software Management Solution Market
The opportunity in the AI integration and advanced analytics in farm software management solution market is in the form of predictive crop yield insights, automated input scheduling reminders, and personalized agronomic recommendations. These solutions provide for early crop disease detection, individualized preventive care suggestions for livestock, and real-time farm activity monitoring. Through enhanced farmer engagement, agronomic decision support, and operational efficiency, particularly in areas with crop and livestock management needs, these technologies may improve outcomes, decrease input waste, and expand the market.
For instance, in May 2024, the FAO reported that 68% of smallholder farmers in Southeast Asia were offered access to farm management platforms by agricultural support organizations, highlighting rising platform availability and increasing demand for digital farm engagement tools.
Farm Software Management Solution Market Segment Analysis
-
By component, software held the largest share of around 67.45% in 2025E, and the services segment is expected to register the highest growth with a CAGR of 9.12%.
-
By deployment mode, the cloud-based segment dominated the market with approximately 61.38% share in 2025E, while the on-premises segment is expected to maintain steady adoption among large agribusinesses.
-
By farm size, large farms accounted for the leading share of nearly 48.73% in 2025E, and the medium farm segment is expected to register the highest growth with a CAGR of 9.04%.
-
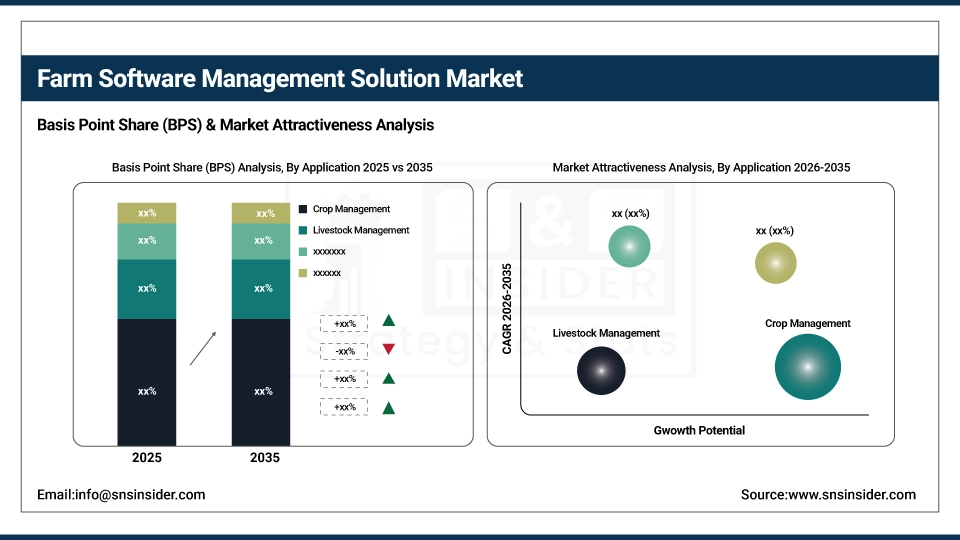
By application, crop management led the segment with approximately 32.56% in 2025E, while livestock management is expected to register the highest CAGR of 8.89%.
-
By end-user, farmers accounted for the leading share of approximately 52.61% in 2025E, and agribusinesses are expected to register the highest growth with a CAGR of 9.23%.
By Application, Crop Management Leads, While Livestock Management Registers Fastest Growth
The crop management application segment accounted for the highest revenue share of approximately 32.56% in 2025, owing to widespread demand for planting schedule optimization, soil health tracking, precision irrigation management, and harvest planning tools across farming operations globally. Growing adoption of satellite-based field mapping and AI-powered crop advisory modules continues to reinforce crop management software demand. In comparison, the livestock management segment is anticipated to achieve the highest CAGR of approximately 8.89% during 2026–2035, driven by increasing demand for digital herd tracking, feed optimization software, and automated livestock health monitoring systems among commercial livestock producers.
By Component, Software Leads the Market, While Services Registers Fastest Growth
The software segment accounted for the highest revenue share of approximately 67.45% in 2025, owing to strong demand for integrated farm management platforms, seamless field data exchange for comprehensive farm operations, and strong agribusiness preference for unified software ecosystems. Emerging trends, including increasing requirements for consolidated farm information systems and regulatory emphasis on data continuity. In comparison, the services segment is anticipated to achieve the highest CAGR of nearly 9.12% during the 2026–2035 period, driven by the increasing demand from smaller farming operations, lower implementation costs for service-based models, and flexibility in platform customization. Drivers include rising adoption among independent farm operators, the preference for specialized agronomic and technical support services.
By Deployment Mode, the Cloud-Based Segment Dominates, while the On-Premises Segment Maintains Enterprise Adoption
By 2025, the cloud-based segment contributed the largest revenue share of 61.38% due to its scalability, reduced IT infrastructure costs, and automatic software upgrades. Growing adoption of Software-as-a-Service models coupled with agricultural data safety standards, providers are increasingly aware of cloud-hosted farm management services. The on-premises segment is expected to maintain steady demand among large agribusinesses and government agricultural agencies due to localized data requirements and operational reliability in areas with limited internet connectivity.
By Farm Size, Large Farms Lead, and Medium Farms Register Fastest Growth
Large farms accounted for the largest share of the farm software management solution market with about 48.73%, owing to their direct operational management responsibilities, regulatory compliance requirements, and investment capacity for digital agricultural infrastructure. In addition, the medium farm segment is slated to grow at the fastest rate with a CAGR of around 9.04% throughout the forecast period of 2026–2035, as mid-sized farm operations seek comprehensive farm management platforms, value-based agricultural production models, and farm data management capabilities.
By End-User, Farmers Lead, and Agribusinesses Register Fastest Growth
Farmers accounted for the largest share of the farm software management solution market with about 52.61%, owing to their direct crop and livestock care responsibilities, regulatory record-keeping requirements, and growing willingness to invest in digital farm management tools. Reasons driving the farmer segment include increasing field activity management needs and crop reporting obligations. In addition, agribusinesses are slated to grow at the fastest rate with a CAGR of around 9.23% throughout the forecast period of 2026–2035, as large commercial agricultural enterprises seek comprehensive farm management platforms, value-based supply chain models, and integrated financial and labor management capabilities. Increased focus on operational efficiency and traceability contribute to their adoption, while improved supply chain transparency and reduced administrative overhead drive continued investment.
Farm Software Management Solution Market Regional Highlights:
Asia Pacific Farm Software Management Solution Market Insights:
Asia Pacific is the fastest-growing segment in the farm software management solution market with a CAGR of 10.14%, as the awareness about digital agricultural services, government agri-tech initiatives, and agricultural infrastructure modernization in developing nations is growing. Factors including rapid urbanization, rising middle-class population with food expenditure growth, and growing uptake of smartphone-based farm management applications are stimulating the market growth. Mobile farm management platforms and precision agriculture options have been instrumental in improving field data access, especially in rural or semi-urban agricultural settings. Public-private partnerships and government programs also help in advancing agricultural delivery and digital transformation. Increase in demand in Asia Pacific region owing to rising agricultural expenditure against historical spending levels and growing affordability and accessibility of cloud-based farm management tools.
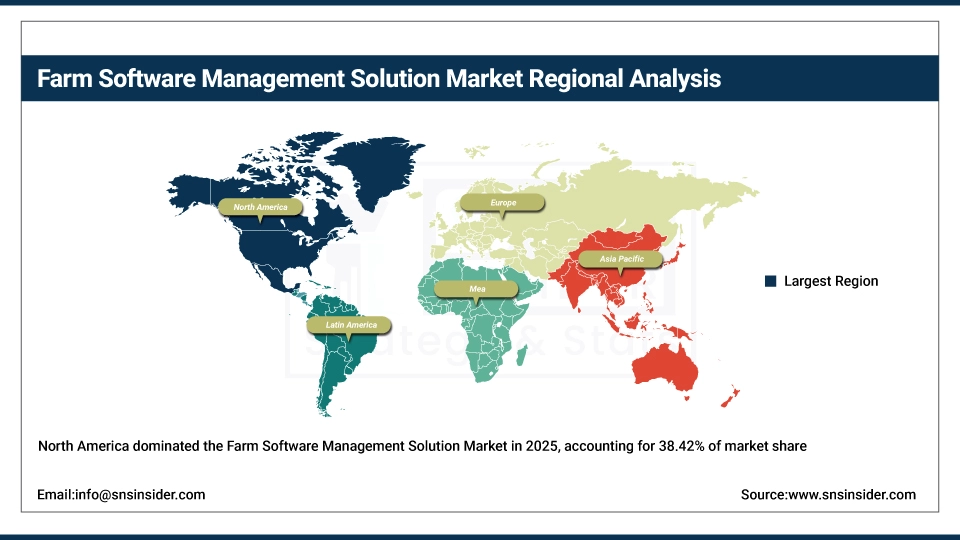
North America Farm Software Management Solution Market Insights:
North America held the largest revenue share of over 38.42% in 2025 of the farm software management solution market due to an established agri-tech environment, stringent requirements for farm data record-keeping, and increased farmer awareness regarding the advantages of digital agricultural management. Drivers include widespread use of precision agriculture platforms, improved rural broadband network, growing smartphone penetration among farming communities, and greater acceptance of remote farm monitoring services. At the same time, various government incentives, USDA digital agriculture requirements, and enormous investments in agricultural technology from agribusinesses and farm operators are anchoring farm software management solutions in the market, and ensuring multi-billion-dollar revenues around the world.
Get Customized Report as per Your Business Requirement - Enquiry Now
Europe Farm Software Management Solution Market Insights:
The farm software management solution market in Europe is the second-dominating region after North America on account of an increase in the adoption of precision agriculture technologies, robust data protection regulations including GDPR, and increasing farmer empowerment initiatives across national agricultural systems. Rising implementation of national agricultural information exchanges, advanced digital farming strategies, favorable government funding for agri-tech projects, and cross-border food safety directives are also contributing to the sustained growth of the market in leading European countries.
Latin America (LATAM) and Middle East & Africa (MEA) Farm Software Management Solution Market Insights:
In Latin America, and Middle East & Africa, the growing agricultural digitization efforts and increase in internet connectivity with mobile device penetration support the farm software management solution market growth. The rising popularity of affordable cloud solutions and multilingual platform capabilities, along with public awareness campaigns, will aid agricultural accessibility and farmer engagement. The increasing rural population and improving agricultural infrastructure in these regions are continuing to encourage market growth.
Farm Software Management Solution Market Competitive Landscape:
Trimble Inc. (est. 1978) is a leading precision agriculture technology and farm management software developer that focuses on integrated agricultural IT solutions for a connected farming environment. It uses its comprehensive hardware-software ecosystem and client relationships to produce cutting-edge farm management technology with seamless field workflow integration.
-
In March 2025, it expanded its Trimble Ag Software platform with AI-powered yield prediction and automated variable-rate application modules, aiming to improve farmer self-service capabilities and agronomic decision support across its global provider network.
Deere & Company (John Deere) (est. 1837) is a global leader in agriculture technology the highest quality advanced farm management software, precision agriculture solutions, and machine telematics platforms. It invests in interoperable farm management platforms and mobile agriculture applications with the goal of improving farmer experience through secure, accessible, and data-driven digital farm management tools.
-
In January 2025, launched an enhanced cloud-based Operations Center farm management platform featuring real-time autonomous field scouting and AI-driven crop disease detection capabilities across North American and Brazilian agricultural operations, enhancing farm productivity and digital farm management adoption.
CNH Industrial (Case IH / New Holland Agriculture) (est. 1999) is a leading precision agriculture and farm management software provider in the fields of machine data analytics, farm fleet management, and crop planning solutions. The company has a farm software product portfolio that emphasizes usability with simple dashboards and mobile-first simple field management design, a strong commitment to regulatory compliance, and what appears to be continuous innovation to complement the very solid market presence in very large commercial and mid-sized farming operations.
-
In June 2024, introduced upgraded cloud-based AFS Connect farm management dashboard featuring real-time multi-machine monitoring and predictive maintenance alerts, strengthening farm operational efficiency capabilities and expanding adoption among large-scale agricultural enterprises.
Farm Software Management Solution Market Key Players:
-
Deere & Company (John Deere)
-
CNH Industrial (Case IH / New Holland Agriculture)
-
AGCO Corporation
-
Climate Corporation (Bayer Crop Science)
-
Farmers Edge Inc.
-
Raven Industries (CNH Industrial)
-
Ag Leader Technology
-
SST Development Group (Trimble)
-
Granular Inc. (Corteva Agriscience)
-
FarmLogs (Bushel)
-
Conservis Corporation
-
AgriWebb
-
Proagrica (RELX Group)
-
Agrivi
-
Cropio (VISTA Remote Sensing)
-
EFC Systems
-
Farm Works Software (Trimble)
-
Agworld
-
Topcon Agriculture
-
Iteris Inc.
-
Gamaya SA
-
OneSoil
-
Agmatix
-
Syngenta Group (Cropwise Operations)
| Report Attributes | Details |
|---|---|
| Market Size in 2025 | USD 2.41 Billion |
| Market Size by 2035 | USD 5.37 Billion |
| CAGR | CAGR of 8.37% From 2026 to 2035 |
| Base Year | 2025 |
| Forecast Period | 2026-2035 |
| Historical Data | 2022-2024 |
| Report Scope & Coverage | Market Size, Segments Analysis, Competitive Landscape, Regional Analysis, DROC & SWOT Analysis, Forecast Outlook |
| Key Segments | •By Component, (Software, Services) •By Deployment Mode, (On-Premises, Cloud-Based) •By Farm Size, (Small, Medium, Large) •By Application, (Crop Management, Livestock Management, Financial Management, Inventory Management, Labor Management, Others) •By End-User, (Farmers, Agribusinesses, Agricultural Cooperatives, Others) |
| Regional Analysis/Coverage | North America (US, Canada, Mexico), Europe (Germany, France, UK, Italy, Spain, Poland, Turkey, Rest of Europe), Asia Pacific (China, India, Japan, South Korea, Singapore, Australia, Rest of Asia Pacific), Middle East & Africa (UAE, Saudi Arabia, Qatar, South Africa, Rest of Middle East & Africa), Latin America (Brazil, Argentina, Rest of Latin America) |
| Company Profiles | Trimble Inc., Deere & Company (John Deere), CNH Industrial (Case IH / New Holland Agriculture), AGCO Corporation, Climate Corporation (Bayer Crop Science), Farmers Edge Inc., Raven Industries (CNH Industrial), Ag Leader Technology, SST Development Group (Trimble), Granular Inc. (Corteva Agriscience), FarmLogs (Bushel), Conservis Corporation, AgriWebb, Proagrica (RELX Group), Agrivi, Cropio (VISTA Remote Sensing), EFC Systems, Farm Works Software (Trimble), Agworld, Topcon Agriculture, Iteris Inc., Gamaya SA, OneSoil, Agmatix, Syngenta Group (Cropwise Operations) |
Frequently Asked Questions
North America dominated the Farm Software Management Solution Market in 2025, accounting for 38.42% of the total revenue.
The software segment (by component type) dominated the market due to the increasing adoption of integrated digital platforms for precision agriculture and data-driven decision-making.
The major growth factor is the adoption of precision agriculture and smart technologies, which empower real-time, data-driven decisions for improving farm productivity and sustainability.
The Farm Software Management Solution Market was valued at USD 2.41 billion in 2025.
The Farm Software Management Solution Market is expected to grow at a CAGR of 8.37% from 2026 to 2035.
Get in Touch
