Edible Packaging Market key Insights:
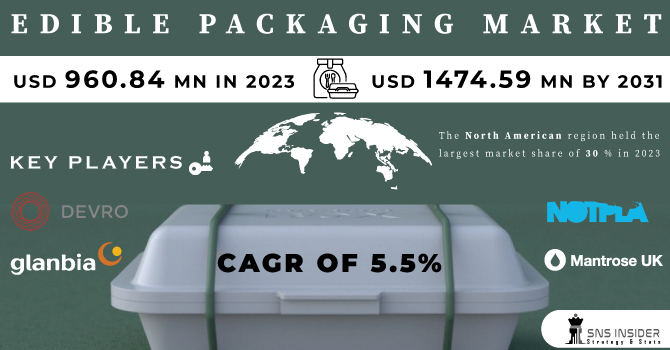
The Edible Packaging Market size was valued at USD 960.84 million in 2023 and is expected to Reach USD 1474.59 million by 2031 and grow at a CAGR of 5.5% over the forecast period of 2024-2031.
Natural, palatable components like cellulose, starch, and proteins are used to create edible packaging, which is intended to be consumed with the product. The market expansion is attributed to rising consumer demand for processed foods and environmentally friendly packaging.
Get More Information on Edible Packaging Market - Request Sample Report
Due to a number of factors, including rising consumer awareness and the demand for environmentally friendly packaging options, the edible packaging market has been expanding quickly. Furthermore, the country's market is being driven by strict government regulations encouraging manufacturers to adopt green packaging options.
The demand for processed foods is rising in the nation as a result of consumers' hectic schedules. Edible coatings and films are available to provide the longer shelf life that these processed foods require. As a result, the country's high consumption of processed foods has a favourable effect on the edible food packaging market.
Small businesses involved in edible packaging production may suffer 50% reduced production and may also shut down their businesses due availability of less capital with them.
MARKET DYNAMICS
KEY DRIVERS:
-
The adoption of algae and commercial seaweed as raw materials for edible packaging will give boost the market
Working together with the algae and aquaculture industries will give boost to the edible packaging market. Algae and seaweed are already grown and harvested by these industries for use in food, medicine, and biofuels, among other things. The edible packaging industry can develop a circular economy, increasing resource efficiency and decreasing waste generation, by utilizing by-products or waste streams from these industries.
-
Enhancing food safety and extending product shelf life are two benefits of edible packaging which can drive the growth of the market.
RESTRAIN:
-
High cost of production for edible packaging is a major restrain affecting the market growth.
Packaging must maintain sanitary standards while being transported, producing edible packaging is expensive. The edible layers are also more likely to gather dirt, germs, and other dangerous particles that can damage the food. Companies, therefore, have to spend a lot of money to prevent food from getting contaminated.
OPPORTUNITY:
-
Increasing consumption of processed food is providing opportunity for edible packaging
Due to their accessibility and convenience, processed foods are frequently preferred. They provide ready-to-eat or ready-to-cook options to accommodate busy lifestyles. By offering packaging options that are compact, portable, and convenient for consumption on the go, edible packaging fits in well with this trend. Consumers can choose edible packaging because it eliminates the need for extra utensils or packaging disposal.
-
Edible packaging has a huge market opportunity as international market focusing on sustainability and environmental protection
CHALLENGES:
-
The price of edible packaging in comparison to traditional packaging materials is one of the main challenges
Edible packaging materials can be more expensive to produce because they require extracting and processing natural ingredients. In addition, expanding production to satisfy widespread demand can be difficult and expensive. Therefore, in order to achieve wider adoption, edible packaging solutions' cost-effectiveness and scalability need to be enhanced.
IMPACT OF RUSSIA-UKRAINE WAR
The European edible packaging industry appears to be relatively unaffected by the conflict between Russia and Ukraine. However, there are a lot of unknowns, particularly in the energy sector. Some European manufacturers may be threatened by the current energy prices. The industry is under increased pressure to find sustainable replacements, and the energy transition is moving more quickly as a result of the energy crisis.
The availability and cost of other raw materials, as well as issues with transportation and logistics, all contribute to a gloomy short-term outlook. Edible packaging price increases are a natural result of these developments, which are putting pressure on producers' profit margins. As a result, the already strained downstream supply chain will experience additional price pressure.
Despite being a small part of the production of edible packaging, starch's cost and availability can have a significant effect. 30% of the wheat and corn starch consumed in Europe is used in manufacturing. Supplies of wheat and corn from Russia and Ukraine, which together account for 30% and 20% of the world's trade in wheat and corn, are in jeopardy. The availability and costs of starch are consequently under pressure to rise, as are the prices of global wheat and corn.
Production of edible packaging is an energy-intensive sector that uses both fuel and electricity to operate.
After months of increases, the prices of fiber and energy were beginning to stabilize at the beginning of 2022, but the ongoing Ukraine crisis changed the course of change. For some players in the market, current energy costs are now higher than the total sale price of production.
Approximately one-third of the natural gas used in Europe comes from Russia. The dependence of some nations on Russian gas supplies may have additional effects on local energy costs and supply.
IMPACT OF ONGOING RECESSION
The recession will have a significant impact on the edible packaging market and overall packaging production market globally. The industries will stop operating at their full capacity and will lay off their employees and freeze the hiring process. This will affect the overall production and production will drop by 15-20 % affecting the profitability of the packaging industry. At times of recession, there are chances that there will be a delay in the payment of wages or even a drop in wages. According to the global survey, there might be a 10 % drop in wages.
Capital spending activity, building new infrastructure and plants, delays in the import of machinery are further consequences of the recession. This will affect the overall global production of edible packaging.
There will be less demand across market for the edible sncak food packaged products due to changes in consumer buying behaviour. At the times of recession, consumers prefer to spend less on things that will affect their incomes at the times of recession.
KEY MARKET SEGMENTATION
By Raw Material
-
Polysaccharides
-
Protein Films
-
Lipid
-
Others
By Source
-
Plant
-
Animal
By Packaging Process
-
Antimicrobial
-
Nano-Technology
-
Micro-organisms
-
Electro Dynamic
-
Others
By End Users
-
Food
-
Beverages
-
Pharmaceuticals
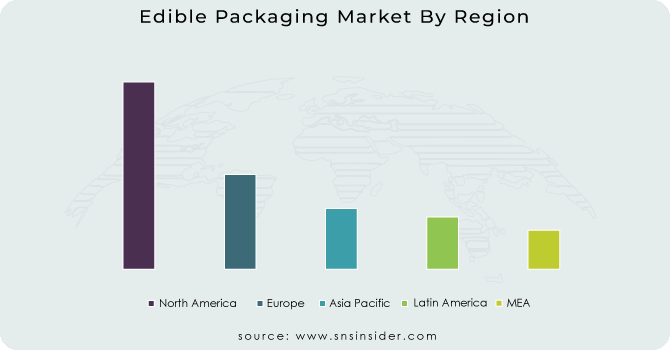
REGIONAL ANALYSIS
The North American region held the largest market share of 30 % in 2023 due to the presence of several players in the edible packaging market, ongoing research and development into edible packaging, and increased government funding for the creation of eco-friendly packaging projects. The region also has a food processing sector, which produces a lot of food waste that can be used as a raw material for edible packaging solutions, making it simpler for manufacturers to find the raw materials required to make edible packaging solutions.
The US is the largest supplier of edible packaging, as a result of the market's expanding innovation and experimentation with new packaging materials and goods. Additionally, as these packaging solutions are made with healthy ingredients like seaweed, the market demand is driven by consumers' growing awareness of the importance of organic and healthy foods.
Asia Pacific is predicted to grow quickly over the forecast period, due to a number of factors, including strict government regulations banning single-use plastics in the area and encouraging manufacturers to use sustainable packaging solutions. The region's pharmaceutical industry is expanding as a result of an aging population and an increase in chronic diseases. The aging population and diseases in nations like India, Japan, and China are major factors driving the demand for customized capsule solutions, such as edible capsules, which further fuels the market in the area.
China had the largest market share in the region, due to an increase in consumer disposable income, in 2023. Consumers are more willing to pay more for environmentally conscious and sustainable packaging options as the nation's disposable income rises because they are perceived as being more responsible for the environment. The demand for this market in the nation is also anticipated to increase as a result of the trend of buying ready-to-eat food and beverages.
Europe held a sizeable market share in 2023, due to numerous ongoing projects and R&D efforts to develop alternatives to conventional packaging solutions in the region.
Get Customized Report as per your Business Requirement - Request For Customized Report
REGIONAL COVERAGE
North America
-
US
-
Canada
-
Mexico
Europe
-
Eastern Europe
-
Poland
-
Romania
-
Hungary
-
Turkey
-
Rest of Eastern Europe
-
-
Western Europe
-
Germany
-
France
-
UK
-
Italy
-
Spain
-
Netherlands
-
Switzerland
-
Austria
-
Rest of Western Europe
-
Asia Pacific
-
China
-
India
-
Japan
-
South Korea
-
Vietnam
-
Singapore
-
Australia
-
Rest of Asia Pacific
Middle East & Africa
-
Middle East
-
UAE
-
Egypt
-
Saudi Arabia
-
Qatar
-
Rest of Middle East
-
-
Africa
-
Nigeria
-
South Africa
-
Rest of Africa
-
Latin America
-
Brazil
-
Argentina
-
Colombia
-
Rest of Latin America
Key Players
The Major Players are Glanbia plc, Devro Plc, WIKICELL DESIGNS INC, Amtrex Nature Care Pvt Ltd, Mantrose UK Ltd, Coolhaus, Notpla ltd, Ingredion, NAGASE & CO LTD, Skipping Rocks Labs, and other player.
Amtrex Nature Care Pvt Ltd-Company Financial Analysis
RECENT DEVELOPMENTS
-
FlexSea Founders, a London-based startup, had developed sea-weed-based packaging material which can replace plastic film.
-
Thammasat University Researchers, incorporated cannabidiol, from cannabis, into an edible, antimicrobial coating to delay the rotting process.
-
SAVEGGY, received a Eurostar grant of € 440000 to develop fossil-free, edible coating to extend the shelf life of cucumbers.
-
In Korea and USA, Researchers developed edible Silk QR tag to reveal whiskey is fake or not.
| Report Attributes | Details |
|---|---|
| Market Size in 2023 | US$ 960.84 Mn |
| Market Size by 2032 | US$ 1474.59 Mn |
| CAGR | CAGR of 5.5% From 2024 to 2032 |
| Base Year | 2023 |
| Forecast Period | 2024-2032 |
| Historical Data | 2020-2022 |
| Report Scope & Coverage | Market Size, Segments Analysis, Competitive Landscape, Regional Analysis, DROC & SWOT Analysis, Forecast Outlook |
| Key Segments | • By Raw Material (Polysaccharides, Protein Films, Lipid, Others) • By Source (Plant, Animal) • By Packaging Process (Antimicrobial, Nano-Technology, Micro-organisms, Electro Dynamic, Others) • By End Users (Food, Beverages, Pharmaceuticals) |
| Regional Analysis/Coverage | North America (US, Canada, Mexico), Europe (Eastern Europe [Poland, Romania, Hungary, Turkey, Rest of Eastern Europe] Western Europe] Germany, France, UK, Italy, Spain, Netherlands, Switzerland, Austria, Rest of Western Europe]), Asia Pacific (China, India, Japan, South Korea, Vietnam, Singapore, Australia, Rest of Asia Pacific), Middle East & Africa (Middle East [UAE, Egypt, Saudi Arabia, Qatar, Rest of Middle East], Africa [Nigeria, South Africa, Rest of Africa], Latin America (Brazil, Argentina, Colombia Rest of Latin America) |
| Company Profiles | Glanbia plc, Devro Plc, WIKICELL DESIGNS INC, Amtrex Nature Care Pvt Ltd, Mantrose UK Ltd, Coolhaus, Notpla ltd, Ingredion, NAGASE & CO LTD, Skipping Rocks Labs |
| Key Drivers | • The adoption of algae and commercial seaweed as raw materials for edible packaging will give boost the market. • Enhancing food safety and extending product shelf life are two benefits of edible packaging which can drive the growth of the market. |
| Market Restraints | • High cost of production for edible packaging is a major restrain affecting the market growth. |
Frequently Asked Questions
Ans: The North American region held the largest market share of 30 % in 2023 and will continue to dominate the market.
Ans: High cost of production for edible packaging is a major restrain affecting the market growth.
Ans: Adopting algae and seaweed as raw materials for edible packaging will boost the market.
Ans: The Edible Packaging Market size was USD 960.84 million in 2022 and is expected to Reach USD 1474.59 million by 2031.
Ans: The Edible Packaging Market is expected to grow at a CAGR of 5.5 %.
Get in Touch
