Green Packaging Market Key Insights:
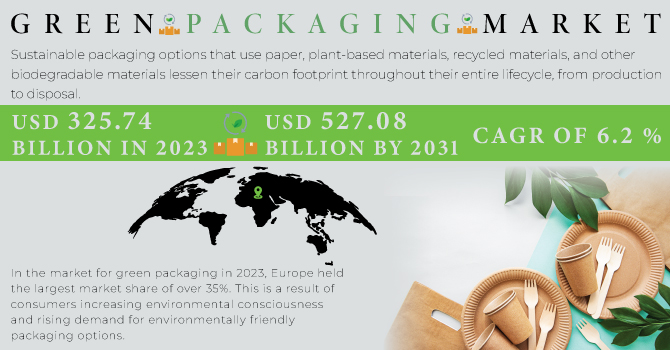
The Green Packaging Market size was USD 325.74 billion in 2023 and is expected to Reach USD 527.08 billion by 2031 and grow at a CAGR of 6.2 % over the forecast period of 2024-2031.
Sustainable packaging options that use paper, plant-based materials, recycled materials, and other biodegradable materials lessen their carbon footprint throughout their entire lifecycle, from production to disposal.
Get More Information on Green Packaging Market - Request Sample Report
The increased consumer awareness about the harmful effects of single-use plastic products on the environment has prompted manufacturers and suppliers to adopt green packaging solutions as their preferred choice. The green packaging market has benefited from the government's strict regulations and policies on plastic packaging solutions.
Recycled content packaging led all other packaging types in 2022, with a market share of over 65%.
According to the application, the food and beverage sector held the largest market share of about 65% in 2023.
MARKET DYNAMICS
KEY DRIVERS:
-
The market growth will be fueled by the rising demand for environmentally friendly food packaging.
The use of environment-friendly materials for the production of goods, which are biodegradable can be used as a substitute for plastic material. The biodegradable materials do not harm the final product, hence are in demand by the packaging industry, which is driving the growth of green packaging market.
-
Green packaging solutions can often lead to cost savings.
RESTRAIN:
-
Limited availability of green packaging materials
Green packaging is in demand, but there may not always be a large enough supply of eco-friendly materials to meet that demand. Alternative fibers and plant-based plastics may not have enough production capacity to meet the market's increasing demand. As a result of this restriction, businesses may face increased costs and fewer options, as well as difficulties with the supply chain.
-
Undeveloped recycling and waste management infrastructure.
OPPORTUNITY:
-
The green packaging market offers opportunities for innovation and product differentiation.
Businesses can create brand-new eco-friendly, practical, and aesthetically pleasing packaging materials, technologies, and designs. Reusable packaging options, composit packaging, and other innovations can help businesses stand out from competitors and win market share.
-
The rise of e-commerce and direct-to-consumer models presents opportunities for green packaging solutions.
CHALLENGES:
-
Limited consumer awareness and education
Not all consumers are knowledgeable about green packaging options and their advantages, despite rising environmental awareness. Consumer ignorance may have an impact on demand for green packaging and restrain the market's expansion. Effective education and communication campaigns are required to increase consumer awareness and promote the use of sustainable packaging options.
IMPACT OF RUSSIAN UKRAINE WAR
Since the conflict started, 5.8 million people have left Ukraine. Over 250 major Western corporations have left the country as a result of the conflict, and numerous packaging and production facilities in both Russia and Ukraine have also been closed. Because they were unsure of when it would end, some businesses were initially hesitant to stop operations altogether or scale them back.
Smurfit Kappa, an Irish paper packaging business and one of the biggest corrugated paper producers in Russia, and Huhtamäki, a Finnish food packaging supplier with more than 30 years of experience operating in Russia, have both added their names to the list of companies leaving the country.
The parent company of Mondi Syktyvkar, a company that specializes in paper and packaging, has already suspended operations at its paper bag manufacturing facility in, Ukraine.
Prior to the start of the conflict, aluminium was only costing US$2,800 per tonne. Now, it costs US$3,500 per tonne.
IMPACT OF ONGOING RECESSION
It may become more challenging to invest in sustainable supply chain initiatives like renewable energy, waste reduction, or eco-friendly packaging during a recession as organizations and supply chains shift their focus to more pressing issues like maintaining cash flow or cutting costs to manage financial health.
A decrease in the willingness of businesses to pay more for sustainable materials or goods is also possible. This might cause investments in sustainability initiatives to be cut back or the adoption of sustainable practices to be delayed.
Consumers may spend less money on discretionary items and buy fewer goods as a result, which would lower the demand for goods. Due to the potential reduction in production and transportation, supply chains' carbon footprints could be reduced, contributing to a modest but nonetheless beneficial improvement in sustainability.
A recession may encourage more proactive collaboration between businesses, governments, and NGOs in order to find creative and long-lasting solutions to economic challenges, leaving aside short-term market dynamics. This might result in fresh collaborations and projects that give supply chain sustainability a top priority.
KEY MARKET SEGMENTS
By Raw Material
-
Plastic
-
Paper
-
Metal
-
Others
By Packaging Type
-
Recycled Content Packaging
-
Reusable Packaging
-
Degradable Packaging
By Application
-
Healthcare
-
Food & Beverages
-
Personal Care
-
Others
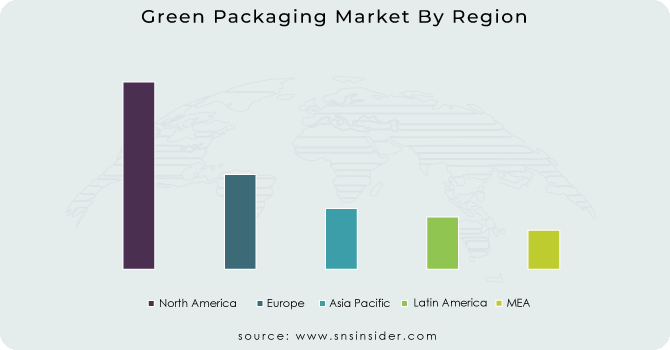
REGIONAL ANALYSIS
In the market for green packaging in 2023, Europe held the largest market share of over 35%. This is a result of consumers increasing environmental consciousness and rising demand for environmentally friendly packaging options. By providing improved biodegradability and lower carbon emissions in uses like food packaging and shopping bags, the use of bioplastics derived from renewable sources, like sugarcane or corn starch, has also helped the market expand.
Due to the expansion of the market for recyclable packaging, particularly in the food and beverage industry, it is predicted that the Asia Pacific region will experience the fastest CAGR growth during the forecast period. Greater investments are being made in recycling infrastructure as well as the creation of new materials and technologies in the Asia Pacific packaging industry as a result of the growing understanding of the value of circular economy principles in reducing waste and promoting sustainability. Additionally, the region's rising demand for FMCG products has prompted a parallel rise in the production of eco-friendly packaging options for storing and shipping these goods. Due to this, there is an increasing need for eco-friendly packaging options that can satisfy the demands of the FMCG industry while also minimizing waste and environmental impact. This is a factor in the rising demand for green packaging.
The market growth for green packaging in North America is attributed to the expanding trend towards sustainable packaging innovation and design, such as lightweight and reusable packaging, which helps in reducing the environmental impact of packaging and saves costs for manufacturers.
The Canadian government's initiatives to reduce plastic waste by actively funding and assisting companies in creating novel forms of sustainable packaging are anticipated to fuel the country's green packaging market.
To Get Customized Report as per your Business Requirement - Request For Customized Report
REGIONAL COVERAGE:
North America
-
US
-
Canada
-
Mexico
Europe
-
Eastern Europe
-
Poland
-
Romania
-
Hungary
-
Turkey
-
Rest of Eastern Europe
-
-
Western Europe
-
Germany
-
France
-
UK
-
Italy
-
Spain
-
Netherlands
-
Switzerland
-
Austria
-
Rest of Western Europe
-
Asia Pacific
-
China
-
India
-
Japan
-
South Korea
-
Vietnam
-
Singapore
-
Australia
-
Rest of Asia Pacific
Middle East & Africa
-
Middle East
-
UAE
-
Egypt
-
Saudi Arabia
-
Qatar
-
Rest of Middle East
-
-
Africa
-
Nigeria
-
South Africa
-
Rest of Africa
-
Latin America
-
Brazil
-
Argentina
-
Colombia
-
Rest of Latin America
Key players List-
Some major key players in the Green packaging market are Tetra Laval, Be Green Packaging, DuPont, Amcor plc, Sealed Air, Mondi, DS Smith Plc, Ball Corporation, Evergreen Packaging LLC, Nampak Ltd, and other players.
Be Green Packaging-Company Financial Analysis

RECENT DEVELOPMENTS
-
Tyson Foods and Amcor collaborate to deliver new sustainable packaging. In order to introduce a more sustainable package for consumer goods, Tyson Foods, one of the largest food companies in the world and a well-known global protein leader, will once again partner with Amcor, a global leader in developing and producing responsible packaging solutions.
-
Fres-co System USA, flexible packaging solutions provider partnered with Trex Company, the world’s largest manufacturer of wood-alternative, to embrace the sustainability of its flexible coffee packaging
| Report Attributes | Details |
| Market Size in 2023 | US$ 325.74 Bn |
| Market Size by 2031 | US$ 527.08 Bn |
| CAGR | CAGR of 6.2% From 2024 to 2031 |
| Base Year | 2023 |
| Forecast Period | 2024-2031 |
| Historical Data | 2020-2022 |
| Report Scope & Coverage | Market Size, Segments Analysis, Competitive Landscape, Regional Analysis, DROC & SWOT Analysis, Forecast Outlook |
| Key Segments | • By Raw Material (Plastic, Paper, Metal, Others) • By Packaging Type (Recycled Content Packaging, Reusable Packaging, Degradable Packaging) • By Application (Healthcare, Food & Beverages, Personal Care, Others) |
| Regional Analysis/Coverage | North America (US, Canada, Mexico), Europe (Eastern Europe [Poland, Romania, Hungary, Turkey, Rest of Eastern Europe] Western Europe] Germany, France, UK, Italy, Spain, Netherlands, Switzerland, Austria, Rest of Western Europe]), Asia Pacific (China, India, Japan, South Korea, Vietnam, Singapore, Australia, Rest of Asia Pacific), Middle East & Africa (Middle East [UAE, Egypt, Saudi Arabia, Qatar, Rest of Middle East], Africa [Nigeria, South Africa, Rest of Africa], Latin America (Brazil, Argentina, Colombia, Rest of Latin America) |
| Company Profiles | Tetra Laval, Be Green Packaging, DuPont, Amcor plc, Sealed Air, Mondi, DS Smith Plc, Ball Corporation, Evergreen Packaging LLC, Nampak Ltd |
| Key Drivers | • The market growth will be fueled by the rising demand for environmentally friendly food packaging. |
| Market Opportunities | • The green packaging market offers opportunities for innovation and product differentiation |
Get in Touch
