Electric Bus Market Report Scope & Overview
Get PDF Sample Copy of Electric Bus Market - Request Sample Report
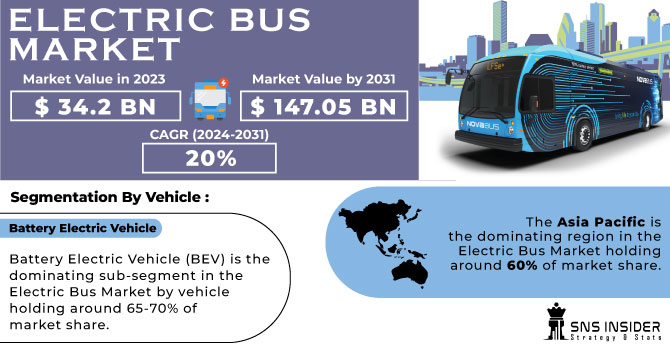
The Electric Bus Market size was valued at USD 34.2 billion in 2023 and is expected to reach USD 147.05 billion by 2031 and grow at a CAGR of 20% over the forecast period 2024-2031.
Electric buses are becoming increasingly popular due to their environmental and economic advantages. They boast zero emissions and quieter operation compared to traditional diesel buses. Furthermore, electric buses are significantly cheaper to run as they eliminate fuel and maintenance costs.
Many manufacturers even offer financing solutions to ease the transition for businesses and public authorities. This rising demand is driven by several factors. Fluctuating oil prices, growing environmental concerns, stricter regulations on polluting vehicles, and the decreasing cost of lithium-ion batteries are all contributing to the surge in electric bus adoption. This trend is attracting new players to the market, eager to capitalize on this lucrative opportunity within the rapidly growing electric vehicle industry.
MARKET DYNAMICS:
KEY DRIVERS:
-
Rising fuel costs are making electric buses a more attractive and economical option.
Electric buses are emerging as a more compelling and cost-effective alternative to traditional diesel-powered vehicles. This shift is driven by the simple fact that electric buses eliminate the dependence on volatile fuel prices. As fuel costs continue to rise, operating electric buses becomes increasingly advantageous, leading to long-term financial benefits for municipalities and transportation authorities.
-
Growing public concern about environmental pollution is driving demand for zero-emission electric buses.
RESTRAINTS:
-
High upfront cost of electric buses compared to traditional diesel options.
-
Limited range and battery life causing concerns for long routes and frequent charging needs.
Electric buses currently travel shorter distances on a single charge compared to their diesel counterparts. This necessitates frequent stops for charging, which can disrupt schedules and impact operational efficiency. Furthermore, concerns exist regarding battery degradation over time, potentially leading to even shorter ranges and the need for expensive battery replacements. Addressing these limitations through advancements in battery technology and the expansion of charging infrastructure is crucial for the wider adoption of electric buses.
OPPORTUNITIES:
-
Technological advancements in battery range and fast-charging capabilities can further improve operational efficiency.
-
Collaboration between bus manufacturers, energy companies, and cities can create innovative and sustainable public transportation solutions.
CHALLENGES:
-
High upfront costs of electric buses compared to traditional diesel models.
-
Longer charging times compared to quick refuelling of diesel buses.
IMPACT OF RUSSIA-UKRAINE WAR
The war in Russia-Ukraine has disrupted the electric bus market's growth. Disruptions in the auto industry's supply chain are a major concern. Ukraine and Russia are key players in mining and processing critical minerals like nickel and palladium, vital for lithium-ion batteries in electric buses. Sanctions and war-related disruptions have limited access to these materials, causing price hikes of up to 64%. This translates to potentially steeper production costs for electric buses, making them less affordable. International carmakers have stopped operations in Russia due to sanctions, impacting global production lines. This can lead to delays in electric bus deliveries and shortages, hindering market expansion plans. Further complicating things are energy price fluctuations. The war has caused a global surge in oil and gas prices. While this might incentivize a shift towards electric buses in the long term, it creates short-term uncertainty for potential buyers.
IMPACT OF ECONOMIC SLOWDOWN
Economic slowdowns can disrupt the electric bus market's growth. Limited public budgets are a major concern. Public transport authorities, a crucial force for electric bus adoption, might face budget cuts for fleet upgrades. This can stop electric bus procurement plans, hindering market growth. There is a potential 10-15% drop in global public transport ridership potentially impacting budgets earmarked for electric buses. Economic uncertainty can lower the investor’s confidence for new ventures. Startups and companies focused on electric bus technology or manufacturing might struggle to secure funding, potentially slowing down innovation and market expansion. Private businesses operating bus fleets, like airport shuttles or tour operators, can also be affected by economic slowdowns. These companies might prioritize immediate cost-cutting measures, delaying investments in electric buses despite their long-term financial benefits.
KEY MARKET SEGMENTS
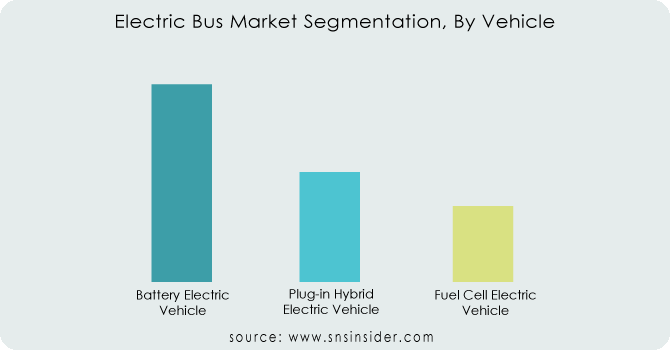
By Vehicle
-
Battery Electric Vehicle
-
Plug-in Hybrid Electric Vehicle
-
Fuel Cell Electric Vehicle
Battery Electric Vehicle (BEV) is the dominating sub-segment in the Electric Bus Market by vehicle holding around 65-70% of market share. BEVs offer the simplest and most mature technology among electric buses. They boast zero tailpipe emissions, quieter operation, and lower operating costs compared to traditional diesel buses.
Get Customized Report as per Your Business Requiremrnt - Enquiry Now
By Battery
-
Lithium Nickel Manganese Cobalt Oxide
-
Lithium Iron Phosphate
Lithium Nickel Manganese Cobalt Oxide (NMC) is the dominating sub-segment in the Electric Bus Market by battery holding around 60-70% of market share. NMC batteries offer higher energy density compared to other lithium-ion battery chemistries, translating to a longer range on a single charge for electric buses.
By Application
-
Intercity
-
Intracity
Intracity is the dominating sub-segment in the Electric Bus Market by application. Intracity buses operate within cities, typically covering shorter distances with frequent stops. This makes them well-suited for electric buses with their zero emissions and silent operation, contributing to cleaner and quieter urban environments.
By End-Use
-
Public
-
Private
Public is the dominating sub-segment in the Electric Bus Market by end-use. Public transport authorities are a major driving force behind electric bus adoption due to government regulations and environmental goals. Public authorities receive government subsidies and grants to invest in electric buses, making them a more financially attractive option compared to private companies.
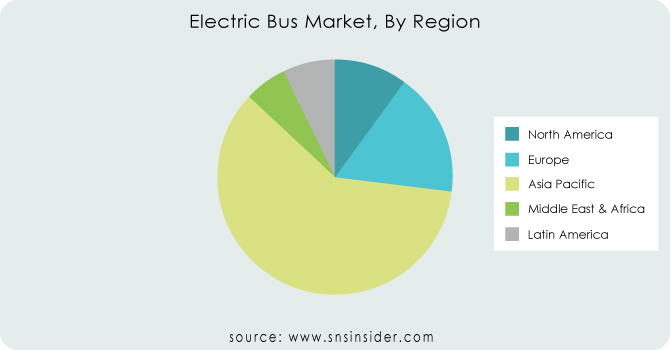
REGIONAL ANALYSES
The Asia Pacific is the dominating region in the Electric Bus Market holding around 60% of market share. This dominance can be attributed to strong government support for clean transportation in the region, particularly China, a global EV manufacturing leader. Rapid urbanization further fuels demand for electric buses to combat pollution in growing cities.
Europe is the second highest region in this market, driven by stringent emission regulations that push public transport and private companies towards electric options. Europe's strength lies in its technological advancements in battery technology and charging infrastructure.
North America is the fastest-growing region with CAGR exceeding 15% due to rising environmental concerns, increasing investments in charging infrastructure, and government incentives that make electric buses more financially attractive.
REGIONAL COVERAGE:
North America
-
US
-
Canada
-
Mexico
Europe
-
Eastern Europe
-
Poland
-
Romania
-
Hungary
-
Turkey
-
Rest of Eastern Europe
-
-
Western Europe
-
Germany
-
France
-
UK
-
Italy
-
Spain
-
Netherlands
-
Switzerland
-
Austria
-
Rest of Western Europe
-
Asia Pacific
-
China
-
India
-
Japan
-
South Korea
-
Vietnam
-
Singapore
-
Australia
-
Rest of Asia Pacific
Middle East & Africa
-
Middle East
-
UAE
-
Egypt
-
Saudi Arabia
-
Qatar
-
Rest of the Middle East
-
-
Africa
-
Nigeria
-
South Africa
-
Rest of Africa
-
Latin America
-
Brazil
-
Argentina
-
Colombia
-
Rest of Latin America
KEY PLAYERS
The major key players are Daimler AG (Germany), Volvo Group (Sweden), Wright Enrichment Inc(U.S.), Shandong Yi Xing Electric Auto Co., Ltd (China), Proterra, Anhui Ankai Automobile Co., Ltd.( China), Zhongtong Bus Holding Co., Ltd.( China), Iveco (Italy), Ebus (Singapore), BYD Auto Co., Ltd ( China), NFI Group Inc., Beiqi Foton Motor Co., Ltd.(China). and other key players.
Volvo Group (Sweden)-Company Financial Analysis
RECENT DEVELOPMENT
-
In March 2024: Yutong, a leading electric bus manufacturer, has delivered 10 Ice12 electric buses to Palermo, Italy. These buses boast advanced electric technology and efficient batteries, offering excellent range for both intercity and rural-urban routes.
-
In March 2024: Volvo's new 8900 Electric bus offers electric mobility for city, intercity, and commuter routes. Available in two and three-axle options, it seats up to 57 passengers in its longest version, with a total capacity of 110. The 12-meter model can accommodate 88 passengers, with 43 seated.
-
In May 2023: In a strategic partnership, Volvo Buses joins forces with MCV to produce bodies for their electric bus models, the Volvo 7900 Electric and its articulated version. The agreement also includes the development of an electric intercity bus. Anticipated production commences in 2024 with the first deliveries in 2025.
| Report Attributes | Details |
| Market Size in 2023 | US$ 18.434.2 Billion |
| Market Size by 2031 | US$ 147.05 Billion |
| CAGR | CAGR of 20% From 2024 to 2031 |
| Base Year | 2023 |
| Forecast Period | 2024-2031 |
| Historical Data | 2020-2022 |
| Report Scope & Coverage | Market Size, Segments Analysis, Competitive Landscape, Regional Analysis, DROC & SWOT Analysis, Forecast Outlook |
| Key Segments | • By Vehicle (Battery Electric Vehicle, Plug-in Hybrid Electric Vehicle, Fuel Cell Electric Vehicle) • By Battery (Lithium Nickel Manganese Cobalt Oxide, Lithium Iron Phosphate) • By Application (Intercity, Intracity) • By End-use (Public, Private) |
| Regional Analysis/Coverage | North America (US, Canada, Mexico), Europe (Eastern Europe [Poland, Romania, Hungary, Turkey, Rest of Eastern Europe] Western Europe] Germany, France, UK, Italy, Spain, Netherlands, Switzerland, Austria, Rest of Western Europe]), Asia Pacific (China, India, Japan, South Korea, Vietnam, Singapore, Australia, Rest of Asia Pacific), Middle East & Africa (Middle East [UAE, Egypt, Saudi Arabia, Qatar, Rest of Middle East], Africa [Nigeria, South Africa, Rest of Africa], Latin America (Brazil, Argentina, Colombia, Rest of Latin America) |
| Company Profiles | Daimler AG (Germany), Volvo Group (Sweden), Wright Enrichment Inc(U.S.), Shandong Yi Xing Electric Auto Co., Ltd (China), Proterra, Anhui Ankai Automobile Co., Ltd.( China), Zhongtong Bus Holding Co., Ltd.( China), Iveco (Italy), Ebus (Singapore), BYD Auto Co., Ltd ( China), NFI Group Inc., Beiqi Foton Motor Co., Ltd.(China). |
| Key Drivers | • Demand for emission-free and energy-efficient mass transit systems is growing. • Environmental issues are growing. |
| RESTRAINTS | • Electric bus producers are being held back by the expensive cost of developing electric buses, coaches, and related components. • Infrastructure development for EVs is also quite expensive. |
Frequently Asked Questions
Ans:- Daimler AG (Germany), Volvo Group (Sweden), Wright Enrichment Inc(U.S.), Shandong Yi Xing Electric Auto Co., Ltd (China), Proterra, BYD Auto Co., Ltd ( China), NFI Group Inc., and Beiqi Foton Motor Co., Ltd.(China) are the most prominent players in the market.
Ans:- Asia pacific region is anticipated to be the primary driver of the market.
Ans:- Yes.
Ans:- An electric bus, often known as an e-bus, is a bus that runs solely on electricity rather than an internal combustion engine.
Ans:- The market size is expected to reach USD 147.05 billion by 2031.
Get in Touch
