Electric Vehicle On-board Charger Market Size
Get More Information on Electric Vehicle On-board Charger Market - Request Sample Report
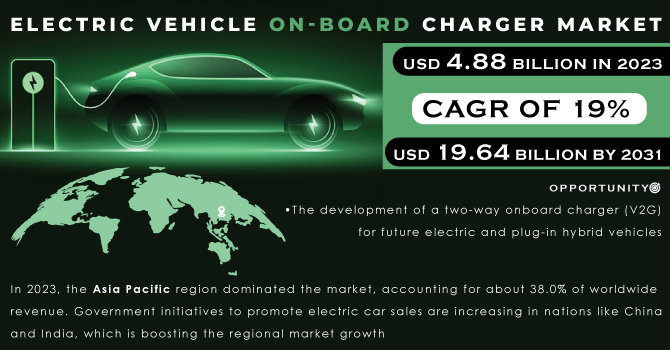
The Electric Vehicle On-board Charger Market Size was valued at USD 4.88 billion in 2023 and is expected to reach USD 19.64 billion by 2031 and grow at a CAGR of 19% over the forecast period 2024-2031.
To charge the traction battery in an electric vehicle, hybrid electric vehicle, or plug-in hybrid car, an onboard charger is utilized. In an electric car, the onboard charger system transforms the AC input from the grid to a DC input, which then charges the battery. The electronic components of an onboard charger allow the battery to be recharged from the AC mains at home or from plugs found in private or public charging stations. In electric vehicles, the onboard charger is made up of a unit that comprises signal conditioning solutions, integrated high voltage isolation AC-DC converters, dual bridgeless power factor correction, gate drivers, error amplifiers, and other power electronic components.
A electric vehicle charging infrastructure is a piece of grid infrastructure that is built along a street, in a parking lot, or in a house garage, with the primary goal of providing power to various types of electric vehicles for battery charging. When the car is plugged in, the AC charging system is usually an onboard charger located within the vehicle that is connected to the grid. The final stage of charging the battery pack is handled by an onboard charger. It takes the AC power from the EVSE and converts it into the necessary battery-charging profile.
| Report Attributes | Details |
|---|---|
| Market Segmentation | • by Vehicle Type (Passenger Car, Commercial Vehicles) • by Power Output (Less than 20 kW, more than 20 kW) • by Propulsion Type (BEV, PHEV, HEV) |
| Regional Analysis | North America (US, Canada, Mexico), Europe (Eastern Europe [Poland, Romania, Hungary, Turkey, Rest of Eastern Europe] Western Europe] Germany, France, UK, Italy, Spain, Netherlands, Switzerland, Austria, Rest of Western Europe]), Asia Pacific (China, India, Japan, South Korea, Vietnam, Singapore, Australia, Rest of Asia Pacific), Middle East & Africa (Middle East [UAE, Egypt, Saudi Arabia, Qatar, Rest of Middle East], Africa [Nigeria, South Africa, Rest of Africa], Latin America (Brazil, Argentina, Colombia, Rest of Latin America) |
| Company Profiles | BRUSA Electronic AG, Bel Power solution, Current Ways Inc., Toyota Industries Corporation, Innoelectric GmbH, Eaton, Stercom Power Solutions GmbH, Xepics Italia SRL, Delphi Technologies, Infineon Technologies AG |
MARKET DYNAMICS:
KEY DRIVERS:
-
Government initiatives to improve electric vehicle charging infrastructure are on the rise
-
The market for electric car onboard chargers is being pushed by a rise in the no. of electric vehicles
RESTRAINTS:
-
The absence of EV charging standardization
-
The demand for electric vehicle onboard chargers may be stifled by an increase in the installation of fast DC chargers
OPPORTUNITIES:
-
The development of a two-way onboard charger (V2G) for future electric and plug-in hybrid vehicles
-
Environmental concerns have prompted innovative efforts resulting in the development of mechanical needs
CHALLENGES:
-
During the coronavirus pandemic, sales of electric vehicle onboard chargers plummeted dramatically
-
Uncertainty in raw material pricing is a major stumbling block
-
The import/export of raw materials required for EV chargers has been halted during the global lockdown
IMPACT OF COVID-19:
The impact of COVID on the market for electric car onboard chargers is unknown, however, it is projected to last through the second quarter of 2021. Governments all across the world have been obliged to focus on medical services as a result of the COVID-19 pandemic. As a result, governments are investing the majority of their money in the healthcare industry, which is hurting government investments and incentives in the electric vehicle market. Furthermore, due to the statewide lockout, electric car manufacturing plants were obliged to reduce their full operations. Due to the negative effects of the COVID-19 epidemic, actions and initiatives related to the development of electric vehicle onboard chargers have been delayed.
Market, By Vehicle Type:
Based on the vehicle type segment, the global market has been divided into passenger cars, Commercial Vehicles. In 2023, the passenger car category dominated the market, accounting for about 36.0% of global revenue. Onboard chargers are projected to become more popular as the number of electric passenger cars on the road grows.
Market, By Power Output:
The global market has been divided into Less than 20 kW, and more than 20 kW based on the power output segment. In 2023, less than 20 kW dominated the market, accounting for about 41.0 %of global sales.
Market, By Propulsion Type:
Based on the propulsion type segment, the global market has been divided into BEV and PHEV, HEV. In 2023, the BEV category dominated the market, accounting for more than 68.0 % of global sales. The propulsion is a Battery Electric Vehicle (BEV) provided by a plug-in charged battery. The market is moving forward due to the increased popularity of BEVs.
MARKET SEGMENTATION:
By Vehicle Type:
-
Passenger Car
-
Commercial Vehicles
By Power Output:
-
Less than 20 kW
-
More than 20 kW
By Propulsion Type:
-
BEV
-
PHEV
-
HEV
REGIONAL ANALYSIS:
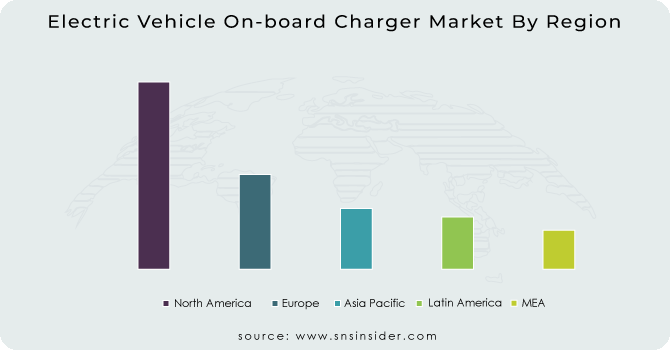
North America, Europe, Asia-Pacific, and the rest of the globe make up the worldwide Electric Vehicle On-Board Charger market. The market is dominated by Asia-Pacific, followed by Europe and North America. In 2023, the Asia Pacific region dominated the market, accounting for about 38.0% of worldwide revenue. Government initiatives to promote electric car sales are increasing in nations like China and India, which is boosting the regional market growth. During the projected period, China is expected to lead the global market, while India is expected to develop at a substantial rate in Asia-Pacific. In APAC, China and Japan are the two most important markets for hybrid and electric vehicle onboard chargers.
This region's market will increase at a slower rate than other regions' markets. One of the primary factors facilitating the hybrid and electric vehicle on-board charger market expansion in APAC throughout the forecast period is the implementation of novel technology. Over the projection period, Europe is expected to grow significantly. Players in Europe are always working to increase their electric vehicle offers, which is increasing the demand for onboard chargers.
Get Customized Report as per Your Business Requirement - Request For Customized Report
REGIONAL COVERAGE:
North America
-
US
-
Canada
-
Mexico
Europe
-
Eastern Europe
-
Poland
-
Romania
-
Hungary
-
Turkey
-
Rest of Eastern Europe
-
-
Western Europe
-
Germany
-
France
-
UK
-
Italy
-
Spain
-
Netherlands
-
Switzerland
-
Austria
-
Rest of Western Europe
-
Asia Pacific
-
China
-
India
-
Japan
-
South Korea
-
Vietnam
-
Singapore
-
Australia
-
Rest of Asia Pacific
Middle East & Africa
-
Middle East
-
UAE
-
Egypt
-
Saudi Arabia
-
Qatar
-
Rest of Middle East
-
-
Africa
-
Nigeria
-
South Africa
-
Rest of Africa
-
Latin America
-
Brazil
-
Argentina
-
Colombia
-
Rest of Latin America
KEY PLAYERS:
BRUSA Electronic AG, Bel Power solution, Current Ways Inc., Toyota Industries Corporation, Innoelectric GmbH, Eaton, Stercom Power Solutions GmbH, Xepics Italia SRL, Delphi Technologies, Infineon Technologies AG, are some of the affluent competitors with significant market share in the Commercial Vehicle Telematics Market.
Eaton-Company Financial Analysis

| Report Attributes | Details |
|---|---|
| Market Size in 2023 | US$ 4.88 Billion |
| Market Size by 2031 | US$ 19.64 Billion |
| CAGR | CAGR of 19% From 2024 to 2031 |
| Base Year | 2023 |
| Forecast Period | 2024-2031 |
| Historical Data | 2020-2022 |
| Report Scope & Coverage | Market Size, Segments Analysis, Competitive Landscape, Regional Analysis, DROC & SWOT Analysis, Forecast Outlook |
| Key Drivers | • Government initiatives to improve electric vehicle charging infrastructure are on the rise. • The market for electric car onboard chargers is being pushed by a rise in the no. of electric vehicles. |
| RESTRAINTS | • The absence of EV charging standardization. • The demand for electric vehicle onboard chargers may be stifled by an increase in the installation of fast DC chargers. |
Frequently Asked Questions
Asia Pacific region is dominating the Electric Vehicle On-Board Charger Market.
- Government initiatives to improve electric vehicle charging infrastructure are on the rise.
- The market for electric car onboard chargers is being pushed by a rise in the no. of electric vehicles.
Electric Vehicle On-Board Charger Market is segmented into three segments, By Vehicle Type, By Power Output, By Propulsion Type.
Major players in the market Bel Fuse Inc., Eaton, BRUSA Electronic AG, Bel Power solution, Current Ways Inc., Toyota Industries Corporation, Innoelectric GmbH, Eaton, Stercom Power Solutions GmbH, Xepics Italia SRL, Delphi Technologies, AVID Technology Limited, Infineon Technologies AG, Hangzhou Aodi Electronic Control Co., Ltd, STMicroelectronics, and others in the final report.
The Electric Vehicle On-Board Charger Market Size was valued at USD 4.48 billion in 2023.
Get in Touch
