Electronic Accessories Market Report Scope & Overview:

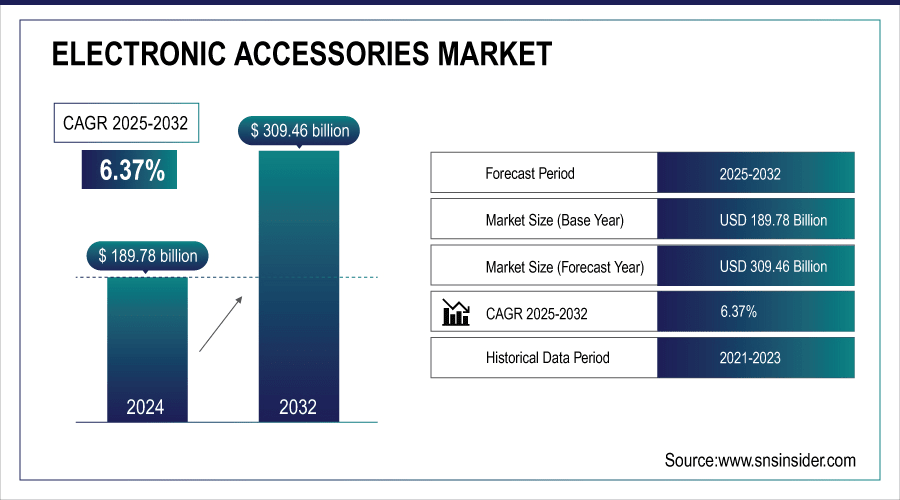
The Electronic Accessories Market size was valued at USD 189.78 Billion in 2024 and is projected to reach USD 309.46 Billion by 2032, growing at a CAGR of 6.37% during 2025-2032.

The global market includes a detailed Electronic Accessories Market analysis by market segmentation, regional analysis, competitive landscape with insights on market dynamics drivers, restraints, and opportunities. The growing usage of smartphones, laptops, and wearable and connected gadgets is increasing the demand for accessories such as chargers, headphones, speakers, and smart devices. Robust growth is also driven by technological advancements and the growing preference of consumers for convenience, portability, and multifaceted products. All these trends, in combination, lead to expansion of the global electronic accessories market.

  • More than 60% of consumers prefer accessories with portability, fast charging, or multifunctionality.

  • Over 50% of audio accessory buyers now prioritize noise-cancellation and wireless features.
Key Electronic Accessories Market Trends

  • Increasing sales of electronic accessories via e-commerce and digital retail platforms are boosting market growth.

  • Buyers favor online shopping due to convenience, competitive pricing, diverse product options, and easy return policies.

  • Companies leverage online platforms to target wider geographic regions and tap into new markets.

  • AI and AR technologies enable virtual try-ons, personalized recommendations, and tailored product experiences, improving adoption rates.

  • Online promotions, discounts, and special offers incentivize purchases and enhance revenue opportunities.

  • Support Growth: Quick delivery and efficient logistics strengthen consumer satisfaction and encourage repeated purchases, further driving market expansion.

Electronic Accessories Market Report Highlights

The U.S. Electronic Accessories Market size was valued at USD 36.19 Billion in 2024 and is projected to reach USD 57.98 Billion by 2032, growing at a CAGR of 6.14% during 2025-2032. The U.S. market growth is propelled by the growing smartphone penetration, increasing adoption of smart homes and connected devices, and innovations in smart wearables and audio accessories. Consumers spend more on durable and versatile electronic accessories that are also stylish. Additionally, the rise of online shopping portals offers easy buying alternatives, increasing reach and options for the consumers. These factors cumulatively lead to a healthy growth, even positioning the U.S. electronic accessories market as one of the most prospective ones for the upcoming years.
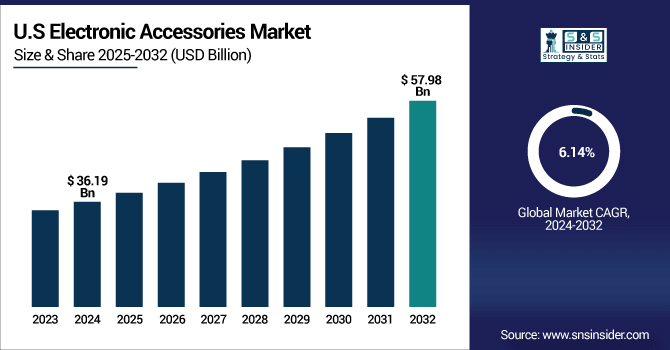
Electronic Accessories Market trends are mainly covered by high adoption rates of smartphone, laptop, and wearable devices and Smart gadgets along with growing need of end-users for convenience, portability, and innovative multifunctional electronic accessories.

Electronic Accessories Market Growth Drivers:

  • Rising E-Commerce Penetration and Online Retail Channels Expands Market Reach

The electronic accessories market is majorly being driven by the fast-expanding e-commerce platforms and online retail channels. Consumer preferences have increasingly been for flash shopping due to reasons such as convenience, affordable pricing, and diversity in products offered. Digital companies are targeting their products and services on a larger geographical region than before which facilitated through quick delivery and easy return process. The provision of online promotions, discounts and product personalization attracts more customers. Augmented reality brings in its own part to help in virtual try-ons and smash recommendations and help in the purchase decision. Such factors together enhance accessibility and uptake of products there by reinforcing revenue opportunities and market growth prospects across the regions.

  • Over 60% of consumers now prefer wireless headphones or earbuds for convenience and mobility.

  • Around 55% of smartphone users utilize fast-charging accessories for improved efficiency.

Electronic Accessories Market Restraints:

  • Intense Competition and Rapid Product Obsolescence Affects Market Expansion

The market for electronic accessories is fiercely competitive, plagued by rival firms providing comparable products. Accelerating technology leads to increasing product life cycles trimmed and obligating companies to innovate continuously. Consumers regularly swap out their vintage accessories for newer versions, creating intense pricing and differentiation pressure. Also, counterfeit and shoddy goods can touch brand reputation and sales. The rapidly changing dynamics of the market environment mandates the very high investment in research and development, advertising and distribution. This intense competition curtails profit margins and impacts the long-run growth of participants in the market, presenting a significant impediment to the growth of the sector.

Electronic Accessories Market Opportunities:

  • Expansion of E-Commerce Platforms and Digital Retail Channels Drives Market Potential

A growing sale of electronic accessories via e-commerce and digital retail channels could act as a prominent factor to accelerate the growth of the market through the forecasted period. Which enhances customer engagement through convenience, competitive pricing, and exposure to a larger product assortment. Companies can tap in to new markets, provide tailored solutions and even implement digital marketing techniques to increase sales. Consumers are drawing more towards AI and AR combined launch for personalized experiences and with speedy delivery of logistics. This enables manufacturers and retailers to reach a global audience, fuel growth, drive adoption, and take advantage of changing buying patterns of best such consumers.

  • Over 65% of laptop users connect external accessories such as wireless mice, keyboards, or docking stations.

  • Around 70% of smart home device users control gadgets via mobile apps or voice assistants.

Electronic Accessories Market Segment Analysis

  • By product type, mobile accessories led the market with ~35.20% share in 2024, while audio accessories are expected to be the fastest growing segment during 2025–2032, registering a CAGR of 8.22%.

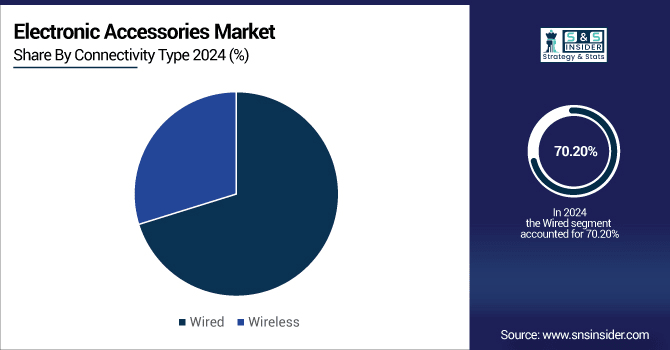
  • By connectivity type, wired accessories dominated the market with ~70.20% share in 2024, whereas wireless accessories are projected to grow at the fastest pace with a CAGR of 6.50% over 2025–2032.

  • By distribution channel, offline sales accounted for the largest share of ~70.80% in 2024, while online channels are anticipated to witness the fastest growth at a CAGR of 6.26% during the forecast period 2025–2032.

  • By end-user, the residential segment led the market with ~71.50% share in 2024, whereas the commercial segment is expected to register the fastest growth at a CAGR of 6.56% during 2025–2032.

By Product Type, Mobile Accessories Leads Market While Audio Accessories Registers Fastest Growth

In 2024, the electronic accessories market share was dominated by the mobile accessories with a revenue share of 35.20% owing to high mobile pool, high device upgrade ratio and need for personal styling further protection of mobile similar devices. Technological advancements, including quick chargers, protective cases, and aesthetics, gained traction within the segment. The audio accessories segment is anticipated to hold the fastest CAGR of 8.22% over the forecast period owing to rising adoption of music streaming, gaming, and home entertainment among the consumers. Premium mobile and audio accessories bolsters this segment in part and via part from Apple Inc., which draws in a loyal and tech-savvy consumer base across the globe.

By Connectivity Type, Wired Dominate While Wireless Shows Rapid Growth

In 2024, the market was dominated by the wired connectivity segment, which held a 70.20% revenue share due to consumers prioritizing reliable performance, rapid charging, and cost-effective and robust charging solutions. In particular, wireless accessories can expect to develop most rapidly with a CAGR of 6.50%, as they easily enable mobility, convenience, and integration with smart devices. Continual productivity in Bluetooth and Wi-Fi technology and AI-enabled connectivity boosts adoption. Anker Innovations is also a global leader in industry-proven wired and wireless solutions for the professional, residential, and gaming markets.
By Distribution Channel, Offline Lead While Online Registers Fastest Growth

In the year 2024, offline channels held a leading revenue share of 70.80%, aided by the presence of well-established retail stores, after sales support services, and consumer trust associated with reputed brands. This category is supported by the accessibility of product, in-store demos, and availability for immediate access. Convenience, competitive pricing, a wide range of product selection, and marketing strategies in the digital environment are rapid factors for the growth of online distribution. The rapid delivery, customized suggestions, and individualized solution offered by Amazon ensure that this trend is made possible, helping businesses to gain access to newer markets, improve engagement, and continue to shift with the changing patterns of consumer purchasing behavior.

By End-User, Residential Lead While Commercial Grows the Fastest

in 2024, the residential holding accounted for a revenue share of 71.50%, owing to personal consumer usage of smartphones, laptops, gaming, and smart home devices. Increased consumption of digital content, high frequency of device upgrading and demand for accessories that offer multifunctional features are driving growth. Commercial segment will register profit fastest CAGR of 6.56% owing to digitalization of workplace, remote collaboration, and adoption of enterprise technology. Logitech International supports commercial growth by offering high-quality peripherals and collaborative tools that transform offices, coworking spaces, and enterprises into productivity-enhancing premium destinations that help work groups adopt innovative electronic accessories.

Asia-pacific Electronic Accessories Market Insights

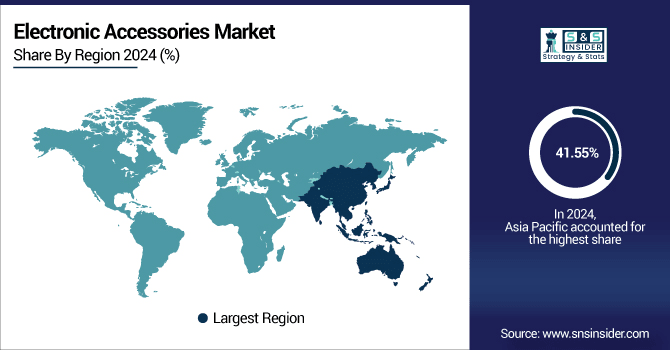
In 2024, Asia Pacific held a major portion of revenue share in the electronic accessories market, estimated at 41.55% and this region is estimated to grow at a CAGR of 7% during 2024-2032. The demand is driven by high smartphone penetration, rapid urbanization and a large tech-savvy consumer base. This area is an important producing base of electronic gadgets accessories with price benefit and product diversity. This is driven by the fast transition to smart appliances, gaming consoles, and wearables. The increasing number of retail chains, the boom in e-commerce, and increasing disposable income also boost the growth of the market. This consolidation is largely attributed to China, India, and Japan further solidifying the global electronic accessories market and corresponding share of Asia Pacific.
North America Electronic Accessories Market Insights

The North America electronic accessories market is driven by high penetration of smartphones, growing adoption of smart home devices, and rising adoption of wearables and audio accessories. The growth is propelled by technology, e-commerce setup and consumer willingness to pay for multi-functional high-end products. Major media producers such as Apple Inc. and Logitech International define the market and consumer preferences as they evolve.

Europe Electronic Accessories Market Insights

The Europe electronic accessories market is expanding due to increasing smartphone and consumer durable adoption, growing requirement for high-fidelity audio and other mobile accessories, coupled with increasing digitalization of homes and workplaces. While continued e-commerce penetration, mature retail infrastructure, and the introduction of newer wireless and smart accessories categories provide additional impetus for this growth. Major players including Samsung Electronics and Sony Corporation promote market development and changing consumer choices.

Latin America (LATAM) and Middle East & Africa (MEA) Electronic Accessories Market Insights

The Middle East & Africa and Latin America electronic accessories markets benefit from increase in adoption of smartphones and other connected devices, and expansion of digital infrastructure. The rising e-commerce growth and high demand for premium multifunctional accessories fuel the sales of the headset in which large corporations such as Samsung Electronics, Apple Inc., and Sony Corporation expand their reach in these regions.

Electronic Accessories Market Competitive Landscape:

Apple Inc. is one of the most dominant technology companies globally known for its consumer electronics, software, and services. The electronic accessory portfolio of the company includes iPhone Chargers, which are quick-charging, long-lasting, and perfectly compatible, and AirPods, wireless earphones with premium audio, noise cancellation, and device integration. The loyalty that Apple attracts from consumers stems from a few different places, but its penchant for premium design, seamless ecosystem connectivity, and willingness to embrace new technology, allow the global electronic accessories market to grow further each year.

  • In September 2024, Apple Inc. unveiled AirPods 4 feature an open-ear design for improved comfort and Active Noise Cancellation. They also introduce a hearing health experience, including Hearing Protection, Hearing Test, and Hearing Aid features, marking a significant advancement in wearable audio technology.

Samsung Electronics is a global consumer electronics, smart device, and semiconductor giant. In its electronic accessories are Galaxy Wireless Chargers that allow more than a single device to be charged at once, fast and efficiently while the line of Galaxy Buds, wireless earphones with crisp sound quality, extended battery life, and a comfortable feel that helps you stay connected through phone calls and easily switch sounds better than most earphones have offered before. Samsung can penetrate different consumer types and markets across the globe by focusing on its unique strength of innovative technologies, general quality service, and global distribution capabilities.

  • In August 2024, Samsung Electronics Co., Ltd. launched the Galaxy Buds3 Pro which offers high-resolution audio with SSC HiFi and UHQ audio codecs, providing 24bit/96KHz sound quality. They also feature AI Real-Time Interpreter for seamless multilingual conversations, catering to a global user base.

Electronic Accessories Market Key Players:

Some of the Electronic Accessories Market Companies are:

  • Apple Inc.

  • Samsung Electronics

  • Sony Corporation

  • Logitech International

  • Xiaomi Corporation

  • Anker Innovations

  • Belkin International

  • Bose Corporation

  • HP Inc.

  • Dell Technologies

  • Sennheiser

  • Harman International

  • AmazonBasics

  • Portronics Digital Private Limited

  • Boat

  • Garmin Ltd.

  • Mophie

  • UGREEN

  • Baseus

  • HyperX

Electronic Accessories Market Report Scope:

Report Attributes Details
Market Size in 2024 USD 189.78 Billion
Market Size by 2032 USD 309.46 Millon
CAGR CAGR of 6.37% From 2025 to 2032
Base Year 2024
Forecast Period 2025-2032
Historical Data 2021-2023
Report Scope & Coverage Market Size, Segments Analysis, Competitive  Landscape, Regional Analysis, DROC & SWOT Analysis, Forecast Outlook
Key Segments • By Product Type (Mobile Accessories, Computer Accessories, Audio Accessories, Wearable Accessories, Automobile Accessories, Camera Accessories and Others)
• By Connectivity Type (Wired and Wireless)
• By Distribution Channel (Online and Offline)
• By End-User (Residential and Commercial)
Regional Analysis/Coverage North America (US, Canada, Mexico), Europe (Germany, France, UK, Italy, Spain, Poland, Turkey, Rest of Europe), Asia Pacific (China, India, Japan, South Korea, Singapore, Australia, Taiwan,  Rest of Asia Pacific), Middle East & Africa (UAE, Saudi Arabia, Qatar, South Africa, Rest of Middle East & Africa), Latin America (Brazil, Argentina, Rest of Latin America)
Company Profiles Apple Inc., Samsung Electronics, Sony Corporation, Logitech International, Xiaomi Corporation, Anker Innovations, Belkin International, Bose Corporation, HP Inc., Dell Technologies, Sennheiser, Harman International, AmazonBasics, Portronics Digital Private Limited, Boat, Garmin Ltd., Mophie, UGREEN, Baseus and HyperX.

Table Of Contents

1. Introduction

1.1 Market Definition & Scope

 1.2 Research Assumptions & Abbreviations

 1.3 Research Methodology

2. Executive Summary

2.1 Market Snapshot

 2.2 Market Absolute $ Opportunity Assessment & Y-o-Y Analysis, 2021–2032

 2.3 Market Size & Forecast, By Segmentation, 2021–2032

  2.3.1 Market Size By Product Type

  2.3.2 Market Size By Connectivity Type

         2.3.3 Market Size By Distribution Channel

         2.3.4 Market Size By End-User

 2.4 Market Share & Bps Analysis By Region, 2024

 2.5 Industry Growth Scenarios – Conservative, Likely & Optimistic

 2.6 Industry CxO’s Perspective

3. Market Overview

3.1 Market Dynamics

  3.1.1 Drivers

  3.1.2 Restraints

  3.1.3 Opportunities

  3.1.4 Key Market Trends

 3.2 Industry PESTLE Analysis

 3.3 Key Industry Forces (Porter’s) Impacting Market Growth

 3.4 Industry Supply Chain Analysis

  3.4.1 Raw Material Suppliers

  3.4.2 Manufacturers

  3.4.3 Distributors/Suppliers

  3.4.4 Customers/End-Users

 3.5 Industry Life Cycle Assessment

 3.6 Parent Market Overview

 3.7 Market Risk Assessment

4. Statistical Insights & Trends Reporting

4.1 Pricing Analysis & Forecast

 4.1.1 Overview

 4.1.2 Pricing Analysis & Forecast By Product

 4.1.3 Price Benchmarking By Key Players

4.2 R&D Investment Statistics

 4.2.1 Overview

 4.2.2 R&D Investment By Key Players

 4.2.3 R&D Trends By Product Type

4.3 Supply Chain Metrics

 4.3.1 Overview

 4.3.2 Manufacturing & Production Capacity

 4.3.3 Distribution & Logistics Efficiency

4.4 Customer Preference Statistics

 4.4.1 Overview

 4.4.2 Customer Survey Analysis By Product

 4.4.3 Brand & Feature Preferences

4.5 Import/Export Data

 4.5.1 Overview

 4.5.2 Import Analysis (Value & Volume), By Country

 4.5.3 Export Analysis (Value & Volume), By Country

 4.5.4 Major Importing Countries

 4.5.5 Major Exporting Countries

4.6 Production Capacity Utilization

 4.6.1 Overview

 4.6.2 Capacity Utilization By Manufacturer

 4.6.3 Trends & Forecast in Production Efficiency

5. Thermal Printing Market Segmental Analysis & Forecast, By Product Type, 2021 – 2032, Value (Usd Billion)

5.1 Introduction

 5.2 Mobile Accessories

  5.2.1 Key Trends

  5.2.2 Market Size & Forecast, 2021 – 2032

 5.3 Computer Accessories

  5.3.1 Key Trends

  5.3.2 Market Size & Forecast, 2021 – 2032

 5.4 Audio Accessories

  5.4.1 Key Trends

  5.4.2 Market Size & Forecast, 2021 – 2032

    5.5 Wearable Accessories

  5.5.1 Key Trends

  5.5.2 Market Size & Forecast, 2021 – 2032

     5.6 Automobile Accessories

  5.6.1 Key Trends

  5.6.2 Market Size & Forecast, 2021 – 2032

    5.7 Camera Accessories

  5.7.1 Key Trends

  5.7.2 Market Size & Forecast, 2021 – 2032

   5.8 Others

  5.8.1 Key Trends

  5.8.2 Market Size & Forecast, 2021 – 2032

6. Thermal Printing Market Segmental Analysis & Forecast, By Connectivity Type, 2021 – 2032, Value (Usd Billion)

    6.1 Introduction

 6.2 Wired

  6.2.1 Key Trends

  6.2.2 Market Size & Forecast, 2021 – 2032

 6.3 Wireless

  6.3.1 Key Trends

  6.3.2 Market Size & Forecast, 2021 – 2032

7. Thermal Printing Market Segmental Analysis & Forecast, By Distribution Channel, 2021 – 2032, Value (Usd Billion)

    7.1 Introduction

 7.2 Online

  7.2.1 Key Trends

  7.2.2 Market Size & Forecast, 2021 – 2032

 7.3 Offline

  7.3.1 Key Trends

  7.3.2 Market Size & Forecast, 2021 – 2032

8. Thermal Printing Market Segmental Analysis & Forecast, By End-User, 2021 – 2032, Value (Usd Billion)

    8.1 Introduction

 8.2 Residential

  8.2.1 Key Trends

  8.2.2 Market Size & Forecast, 2021 – 2032

 8.3 Commercial

  8.3.1 Key Trends

  8.3.2 Market Size & Forecast, 2021 – 2032

9. Thermal Printing Market Segmental Analysis & Forecast By Region, 2021 – 2025, Value (Usd Billion)

9.1 Introduction

9.2 North America

 9.2.1 Key Trends

 9.2.2 Thermal Printing Market Size & Forecast, By Product Type, 2021 – 2032

 9.2.3 Thermal Printing Market Size & Forecast, By Connectivity Type, 2021 – 2032

 9.2.4 Thermal Printing Market Size & Forecast, By Distribution Channel, 2021 – 2032

 9.2.5 Thermal Printing Market Size & Forecast, By End-User, 2021 – 2032

 9.2.6 Thermal Printing Market Size & Forecast, By Country, 2021 – 2032

  9.2.6.1 USA

   9.2.6.1.1 Thermal Printing Market Size & Forecast, By Product Type, 2021 – 2032

   9.2.6.1.2 Thermal Printing Market Size & Forecast, By Connectivity Type, 2021 – 2032

   9.2.6.1.3 Thermal Printing Market Size & Forecast, By Distribution Channel, 2021 – 2032

   9.2.6.1.4 Thermal Printing Market Size & Forecast, By End-User, 2021 – 2032

  9.2.6.2 Canada

   9.2.6.2.1 Thermal Printing Market Size & Forecast, By Product Type, 2021 – 2032

   9.2.6.2.2 Thermal Printing Market Size & Forecast, By Connectivity Type, 2021 – 2032

   9.2.6.2.3 Thermal Printing Market Size & Forecast, By Distribution Channel, 2021 – 2032

   9.2.6.2.4 Thermal Printing Market Size & Forecast, By End-User, 2021 – 2032

9.3 Europe

 9.3.1 Key Trends

 9.3.2 Thermal Printing Market Size & Forecast, By Product Type, 2021 – 2032

 9.3.3 Thermal Printing Market Size & Forecast, By Connectivity Type, 2021 – 2032

 9.3.4 Thermal Printing Market Size & Forecast, By Distribution Channel, 2021 – 2032

 9.3.5 Thermal Printing Market Size & Forecast, By End-User, 2021 – 2032

 9.3.6 Thermal Printing Market Size & Forecast, By Country, 2021 – 2032

  9.3.6.1 Germany

   9.3.6.1.1 Thermal Printing Market Size & Forecast, By Product Type, 2021 – 2032

   9.3.6.1.2 Thermal Printing Market Size & Forecast, By Connectivity Type, 2021 – 2032

   9.3.6.1.3 Thermal Printing Market Size & Forecast, By Distribution Channel, 2021 – 2032

   9.3.6.1.4 Thermal Printing Market Size & Forecast, By End-User, 2021 – 2032

  9.3.6.2 UK

   9.3.6.2.1 Thermal Printing Market Size & Forecast, By Product Type, 2021 – 2032

   9.3.6.2.2 Thermal Printing Market Size & Forecast, By Connectivity Type, 2021 – 2032

   9.3.6.2.3 Thermal Printing Market Size & Forecast, By Distribution Channel, 2021 – 2032

   9.3.6.2.4 Thermal Printing Market Size & Forecast, By End-User, 2021 – 2032

  9.3.6.3 France

   9.3.6.3.1 Thermal Printing Market Size & Forecast, By Product Type, 2021 – 2032

   9.3.6.3.2 Thermal Printing Market Size & Forecast, By Connectivity Type, 2021 – 2032

   9.3.6.3.3 Thermal Printing Market Size & Forecast, By Distribution Channel, 2021 – 2032

   9.3.6.3.4 Thermal Printing Market Size & Forecast, By End-User, 2021 – 2032

  9.3.6.4 Italy

   9.3.6.4.1 Thermal Printing Market Size & Forecast, By Product Type, 2021 – 2032

   9.3.6.4.2 Thermal Printing Market Size & Forecast, By Connectivity Type, 2021 – 2032

   9.3.6.4.3 Thermal Printing Market Size & Forecast, By Distribution Channel, 2021 – 2032

   9.3.6.4.4 Thermal Printing Market Size & Forecast, By End-User, 2021 – 2032

  9.3.6.5 Spain

   9.3.6.5.1 Thermal Printing Market Size & Forecast, By Product Type, 2021 – 2032

   9.3.6.5.2 Thermal Printing Market Size & Forecast, By Connectivity Type, 2021 – 2032

   9.3.6.5.3 Thermal Printing Market Size & Forecast, By Distribution Channel, 2021 – 2032

   9.3.6.5.4 Thermal Printing Market Size & Forecast, By End-User, 2021 – 2032

  9.3.6.6 Russia

   9.3.6.6.1 Thermal Printing Market Size & Forecast, By Product Type, 2021 – 2032

   9.3.6.6.2 Thermal Printing Market Size & Forecast, By Connectivity Type, 2021 – 2032

   9.3.6.6.3 Thermal Printing Market Size & Forecast, By Distribution Channel, 2021 – 2032

   9.3.6.6.4 Thermal Printing Market Size & Forecast, By End-User, 2021 – 2032

  9.3.6.7 Poland

   9.3.6.7.1 Thermal Printing Market Size & Forecast, By Product Type, 2021 – 2032

   9.3.6.7.2 Thermal Printing Market Size & Forecast, By Connectivity Type, 2021 – 2032

   9.3.6.7.3 Thermal Printing Market Size & Forecast, By Distribution Channel, 2021 – 2032

   9.3.6.7.4 Thermal Printing Market Size & Forecast, By End-User, 2021 – 2032

  9.3.6.8 Rest of Europe

   9.3.6.8.1 Thermal Printing Market Size & Forecast, By Product Type, 2021 – 2032

   9.3.6.8.2 Thermal Printing Market Size & Forecast, By Connectivity Type, 2021 – 2032

   9.3.6.8.3 Thermal Printing Market Size & Forecast, By Distribution Channel, 2021 – 2032

   9.3.6.8.4 Thermal Printing Market Size & Forecast, By End-User, 2021 – 2032   

9.4 Asia-Pacific

 9.4.1 Key Trends

 9.4.2 Thermal Printing Market Size & Forecast, By Product Type, 2021 – 2032

 9.4.3 Thermal Printing Market Size & Forecast, By Connectivity Type, 2021 – 2032

 9.4.4 Thermal Printing Market Size & Forecast, By Distribution Channel, 2021 – 2032

 9.4.5 Thermal Printing Market Size & Forecast, By End-User, 2021 – 2032

 9.4.6 Thermal Printing Market Size & Forecast, By Country, 2021 – 2032

  9.4.6.1 China

   9.4.6.1.1 Thermal Printing Market Size & Forecast, By Product Type, 2021 – 2032

   9.4.6.1.2 Thermal Printing Market Size & Forecast, By Connectivity Type, 2021 – 2032

   9.4.6.1.3 Thermal Printing Market Size & Forecast, By Distribution Channel, 2021 – 2032

   9.4.6.1.4 Thermal Printing Market Size & Forecast, By End-User, 2021 – 2032

  9.4.6.2 India

   9.4.6.2.1 Thermal Printing Market Size & Forecast, By Product Type, 2021 – 2032

   9.4.6.2.2 Thermal Printing Market Size & Forecast, By Connectivity Type, 2021 – 2032

   9.4.6.2.3 Thermal Printing Market Size & Forecast, By Distribution Channel, 2021 – 2032

   9.4.6.2.4 Thermal Printing Market Size & Forecast, By End-User, 2021 – 2032

  9.4.6.3 Japan

   9.4.6.3.1 Thermal Printing Market Size & Forecast, By Product Type, 2021 – 2032

   9.4.6.3.2 Thermal Printing Market Size & Forecast, By Connectivity Type, 2021 – 2032

   9.4.6.3.3 Thermal Printing Market Size & Forecast, By Distribution Channel, 2021 – 2032

   9.4.6.3.4 Thermal Printing Market Size & Forecast, By End-User, 2021 – 2032

  9.4.6.4 South Korea

   9.4.6.4.1 Thermal Printing Market Size & Forecast, By Product Type, 2021 – 2032

   9.4.6.4.2 Thermal Printing Market Size & Forecast, By Connectivity Type, 2021 – 2032

   9.4.6.4.3 Thermal Printing Market Size & Forecast, By Distribution Channel, 2021 – 2032

   9.4.6.4.4 Thermal Printing Market Size & Forecast, By End-User, 2021 – 2032

  9.4.6.5 Australia

   9.4.6.5.1 Thermal Printing Market Size & Forecast, By Product Type, 2021 – 2032

   9.4.6.5.2 Thermal Printing Market Size & Forecast, By Connectivity Type, 2021 – 2032

   9.4.6.5.3 Thermal Printing Market Size & Forecast, By Distribution Channel, 2021 – 2032

   9.4.6.5.4 Thermal Printing Market Size & Forecast, By End-User, 2021 – 2032

  9.4.6.6 ASEAN Countries

   9.4.6.6.1 Thermal Printing Market Size & Forecast, By Product Type, 2021 – 2032

   9.4.6.6.2 Thermal Printing Market Size & Forecast, By Connectivity Type, 2021 – 2032

   9.4.6.6.3 Thermal Printing Market Size & Forecast, By Distribution Channel, 2021 – 2032

   9.4.6.6.4 Thermal Printing Market Size & Forecast, By End-User, 2021 – 2032

  9.4.6.7 Rest of Asia-Pacific

   9.4.6.7.1 Thermal Printing Market Size & Forecast, By Product Type, 2021 – 2032

   9.4.6.7.2 Thermal Printing Market Size & Forecast, By Connectivity Type, 2021 – 2032

   9.4.6.7.3 Thermal Printing Market Size & Forecast, By Distribution Channel, 2021 – 2032

   9.4.6.7.4 Thermal Printing Market Size & Forecast, By End-User, 2021 – 2032

9.5 Latin America

 9.5.1 Key Trends

 9.5.2 Thermal Printing Market Size & Forecast, By Product Type, 2021 – 2032

 9.5.3 Thermal Printing Market Size & Forecast, By Connectivity Type, 2021 – 2032

 9.5.4 Thermal Printing Market Size & Forecast, By Distribution Channel, 2021 – 2032

 9.5.5 Thermal Printing Market Size & Forecast, By End-User, 2021 – 2032

 9.5.6 Thermal Printing Market Size & Forecast, By Country, 2021 – 2032

  9.5.6.1 Brazil

   9.5.6.1.1 Thermal Printing Market Size & Forecast, By Product Type, 2021 – 2032

   9.5.6.1.2 Thermal Printing Market Size & Forecast, By Connectivity Type, 2021 – 2032

   9.5.6.1.3 Thermal Printing Market Size & Forecast, By Distribution Channel, 2021 – 2032

   9.5.6.1.4 Thermal Printing Market Size & Forecast, By End-User, 2021 – 2032

  9.5.6.2 Argentina

   9.5.6.2.1 Thermal Printing Market Size & Forecast, By Product Type, 2021 – 2032

   9.5.6.2.2 Thermal Printing Market Size & Forecast, By Connectivity Type, 2021 – 2032

   9.5.6.2.3 Thermal Printing Market Size & Forecast, By Distribution Channel, 2021 – 2032

   9.5.6.2.4 Thermal Printing Market Size & Forecast, By End-User, 2021 – 2032

  9.5.6.3 Mexico

   9.5.6.3.1 Thermal Printing Market Size & Forecast, By Product Type, 2021 – 2032

   9.5.6.3.2 Thermal Printing Market Size & Forecast, By Connectivity Type, 2021 – 2032

   9.5.6.3.3 Thermal Printing Market Size & Forecast, By Distribution Channel, 2021 – 2032

   9.5.6.3.4 Thermal Printing Market Size & Forecast, By End-User, 2021 – 2032

  9.5.6.4 Colombia

   9.5.6.4.1 Thermal Printing Market Size & Forecast, By Product Type, 2021 – 2032

   9.5.6.4.2 Thermal Printing Market Size & Forecast, By Connectivity Type, 2021 – 2032

   9.5.6.4.3 Thermal Printing Market Size & Forecast, By Distribution Channel, 2021 – 2032

   9.5.6.4.4 Thermal Printing Market Size & Forecast, By End-User, 2021 – 2032

  9.5.6.5 Rest of Latin America

   9.5.6.5.1 Thermal Printing Market Size & Forecast, By Product Type, 2021 – 2032

   9.5.6.5.2 Thermal Printing Market Size & Forecast, By Connectivity Type, 2021 – 2032

   9.5.6.5.3 Thermal Printing Market Size & Forecast, By Distribution Channel, 2021 – 2032

   9.5.6.5.4 Thermal Printing Market Size & Forecast, By End-User, 2021 – 2032

9.6 Middle East & Africa

 9.6.1 Key Trends

 9.6.2 Thermal Printing Market Size & Forecast, By Product Type, 2021 – 2032

 9.6.3 Thermal Printing Market Size & Forecast, By Connectivity Type, 2021 – 2032

 9.6.4 Thermal Printing Market Size & Forecast, By Distribution Channel, 2021 – 2032

 9.6.5 Thermal Printing Market Size & Forecast, By End-User, 2021 – 2032

 9.6.6 Thermal Printing Market Size & Forecast, By Country, 2021 – 2032

  9.6.6.1 UAE

   9.6.6.1.1 Thermal Printing Market Size & Forecast, By Product Type, 2021 – 2032

   9.6.6.1.2 Thermal Printing Market Size & Forecast, By Connectivity Type, 2021 – 2032

   9.6.6.1.3 Thermal Printing Market Size & Forecast, By Distribution Channel, 2021 – 2032

   9.6.6.1.4 Thermal Printing Market Size & Forecast, By End-User, 2021 – 2032

  9.6.6.2 Saudi Arabia

   9.6.6.2.1 Thermal Printing Market Size & Forecast, By Product Type, 2021 – 2032

   9.6.6.2.2 Thermal Printing Market Size & Forecast, By Connectivity Type, 2021 – 2032

   9.6.6.2.3 Thermal Printing Market Size & Forecast, By Distribution Channel, 2021 – 2032

   9.6.6.2.4 Thermal Printing Market Size & Forecast, By End-User, 2021 – 2032

  9.6.6.3 Qatar

   9.6.6.3.1 Thermal Printing Market Size & Forecast, By Product Type, 2021 – 2032

   9.6.6.3.2 Thermal Printing Market Size & Forecast, By Connectivity Type, 2021 – 2032

   9.6.6.3.3 Thermal Printing Market Size & Forecast, By Distribution Channel, 2021 – 2032

   9.6.6.3.4 Thermal Printing Market Size & Forecast, By End-User, 2021 – 2032

  9.6.6.4 Egypt

   9.6.6.4.1 Thermal Printing Market Size & Forecast, By Product Type, 2021 – 2032

   9.6.6.4.2 Thermal Printing Market Size & Forecast, By Connectivity Type, 2021 – 2032

   9.6.6.4.3 Thermal Printing Market Size & Forecast, By Distribution Channel, 2021 – 2032

   9.6.6.4.4 Thermal Printing Market Size & Forecast, By End-User, 2021 – 2032

  9.6.6.5 South Africa

   9.6.6.5.1 Thermal Printing Market Size & Forecast, By Product Type, 2021 – 2032

   9.6.6.5.2 Thermal Printing Market Size & Forecast, By Connectivity Type, 2021 – 2032

   9.6.6.5.3 Thermal Printing Market Size & Forecast, By Distribution Channel, 2021 – 2032

   9.6.6.5.4 Thermal Printing Market Size & Forecast, By End-User, 2021 – 2032

  9.6.6.6 Rest of Middle East & Africa

   9.6.6.6.1 Thermal Printing Market Size & Forecast, By Product Type, 2021 – 2032

   9.6.6.6.2 Thermal Printing Market Size & Forecast, By Connectivity Type, 2021 – 2032

   9.6.6.6.3 Thermal Printing Market Size & Forecast, By Distribution Channel, 2021 – 2032

   9.6.6.6.4 Thermal Printing Market Size & Forecast, By End-User, 2021 – 2032

10. Competitive Landscape

 10.1 Key Players' Positioning

 10.2 Competitive Developments

  10.2.1 Key Strategies Adopted (%), By Key Players, 2024

  10.2.2 Year-Wise Strategies & Development, 2021 – 2025

  10.2.3 Number Of Strategies Adopted By Key Players, 2024

 10.3 Market Share Analysis, 2024

 10.4 Product/Service & Application Benchmarking

  10.4.1 Product/Service Specifications & Features By Key Players

  10.4.2 Product/Service Heatmap By Key Players

  10.4.3 Application Heatmap By Key Players

 10.5 Industry Start-Up & Innovation Landscape

10.6 Key Company Profiles

 10.6.1 Apple Inc.

  10.6.1.1 Company Overview & Snapshot

  10.6.1.2 Product/Service Portfolio

  10.6.1.3 Key Company Financials

  10.6.1.4 SWOT Analysis

 10.6.2 Samsung Electronics

  10.6.2.1 Company Overview & Snapshot

  10.6.2.2 Product/Service Portfolio

  10.6.2.3 Key Company Financials

  10.6.2.4 SWOT Analysis

 10.6.3 Sony Corporation

  10.6.3.1 Company Overview & Snapshot

  10.6.3.2 Product/Service Portfolio

  10.6.3.3 Key Company Financials

  10.6.3.4 SWOT Analysis

 10.6.4 Logitech International

  10.6.4.1 Company Overview & Snapshot

  10.6.4.2 Product/Service Portfolio

  10.6.4.3 Key Company Financials

  10.6.4.4 SWOT Analysis

 10.6.5 Xiaomi Corporation

  10.6.5.1 Company Overview & Snapshot

  10.6.5.2 Product/Service Portfolio

  10.6.5.3 Key Company Financials

  10.6.5.4 SWOT Analysis

 10.6.6 Anker Innovations

  10.6.6.1 Company Overview & Snapshot

  10.6.6.2 Product/Service Portfolio

  10.6.6.3 Key Company Financials

  10.6.6.4 SWOT Analysis

 10.6.7 Belkin International

  10.6.7.1 Company Overview & Snapshot

  10.6.7.2 Product/Service Portfolio

  10.6.7.3 Key Company Financials

  10.6.7.4 SWOT Analysis

 10.6.8 Bose Corporation

  10.6.8.1 Company Overview & Snapshot

  10.6.8.2 Product/Service Portfolio

  10.6.8.3 Key Company Financials

  10.6.8.4 SWOT Analysis

 10.6.9 HP Inc.

  10.6.9.1 Company Overview & Snapshot

  10.6.9.2 Product/Service Portfolio

  10.6.9.3 Key Company Financials

  10.6.9.4 SWOT Analysis

 10.6.10 Dell Technologies

  10.6.10.1 Company Overview & Snapshot

  10.6.10.2 Product/Service Portfolio

  10.6.10.3 Key Company Financials

  10.6.10.4 SWOT Analysis

 10.6.11 Sennheiser

  10.6.11.1 Company Overview & Snapshot

  10.6.11.2 Product/Service Portfolio

  10.6.11.3 Key Company Financials

  10.6.11.4 SWOT Analysis

 10.6.12 Harman International

  10.6.12.1 Company Overview & Snapshot

  10.6.12.2 Product/Service Portfolio

  10.6.12.3 Key Company Financials

  10.6.12.4 SWOT Analysis

 10.6.13 AmazonBasics

  10.6.13.1 Company Overview & Snapshot

  10.6.13.2 Product/Service Portfolio

  10.6.13.3 Key Company Financials

  10.6.13.4 SWOT Analysis

 10.6.14 Portronics Digital Private Limited

  10.6.14.1 Company Overview & Snapshot

  10.6.14.2 Product/Service Portfolio

  10.6.14.3 Key Company Financials

  10.6.14.4 SWOT Analysis

 10.6.15 Boat

  10.6.15.1 Company Overview & Snapshot

  10.6.15.2 Product/Service Portfolio

  10.6.15.3 Key Company Financials

  10.6.15.4 SWOT Analysis

 10.6.16 Garmin Ltd.

  10.6.16.1 Company Overview & Snapshot

  10.6.16.2 Product/Service Portfolio

  10.6.16.3 Key Company Financials

  10.6.16.4 SWOT Analysis

 10.6.17 Mophie

  10.6.17.1 Company Overview & Snapshot

  10.6.17.2 Product/Service Portfolio

  10.6.17.3 Key Company Financials

  10.6.17.4 SWOT Analysis

 10.6.18 UGREEN

  10.6.18.1 Company Overview & Snapshot

  10.6.18.2 Product/Service Portfolio

  10.6.18.3 Key Company Financials

  10.6.18.4 SWOT Analysis

 10.6.19 Baseus

  10.6.19.1 Company Overview & Snapshot

  10.6.19.2 Product/Service Portfolio

  10.6.19.3 Key Company Financials

  10.6.19.4 SWOT Analysis

 10.6.20 HyperX

  10.6.20.1 Company Overview & Snapshot

  10.6.20.2 Product/Service Portfolio

  10.6.20.3 Key Company Financials

  10.6.20.4 SWOT Analysis

11. Analyst Recommendations

 11.1 SNS Insider Opportunity Map

 11.2 Industry Low-Hanging Fruit Assessment

 11.3 Market Entry & Growth Strategy

 11.4 Analyst Viewpoint & Suggestions On Market Growth

12. Assumptions

13. Disclaimer

14. Appendix

 14.1 List Of Tables

 14.2 List Of Figures

Key Segments: 

By Product Type

  • Mobile Accessories

  • Computer Accessories

  • Audio Accessories

  • Wearable Accessories

  • Automobile Accessories

  • Camera Accessories

  • Others  

By Connectivity Type

  • Wired

  • Wireless

By Distribution Channel

  • Online

  • Offline

By End-User

  • Residential 

  • Commercial

Request for Segment Customization as per your Business Requirement: Segment Customization Request

Regional Coverage:

North America

  • US

  • Canada

Europe

  • Germany

  • UK

  • France

  • Italy

  • Spain

  • Russia

  • Poland

  • Rest of Europe

Asia Pacific

  • China

  • India

  • Japan

  • South Korea

  • Australia

  • ASEAN Countries

  • Rest of Asia Pacific

Middle East & Africa

  • UAE

  • Saudi Arabia

  • Qatar

  • South Africa

  • Rest of Middle East & Africa

Latin America

  • Brazil

  • Argentina

  • Mexico

  • Colombia

  • Rest of Latin America

Request for Country Level Research Report: Country Level Customization Request

Available Customization 

With the given market data, SNS Insider offers customization as per the company’s specific needs. The following customization options are available for the report: 

  • Detailed Volume Analysis 

  • Criss-Cross segment analysis (e.g. Product X Application) 

  • Competitive Product Benchmarking 

  • Geographic Analysis 

  • Additional countries in any of the regions 

  • Customized Data Representation 

  • Detailed analysis and profiling of additional market players

An accurate research report requires proper strategizing as well as implementation. There are multiple factors involved in the completion of good and accurate research report and selecting the best methodology to compete the research is the toughest part. Since the research reports we provide play a crucial role in any company’s decision-making process, therefore we at SNS Insider always believe that we should choose the best method which gives us results closer to reality. This allows us to reach at a stage wherein we can provide our clients best and accurate investment to output ratio.

Each report that we prepare takes a timeframe of 350-400 business hours for production. Starting from the selection of titles through a couple of in-depth brain storming session to the final QC process before uploading our titles on our website we dedicate around 350 working hours. The titles are selected based on their current market cap and the foreseen CAGR and growth.


The 5 steps process:

Step 1: Secondary Research:

Secondary Research or Desk Research is as the name suggests is a research process wherein, we collect data through the readily available information. In this process we use various paid and unpaid databases which our team has access to and gather data through the same. This includes examining of listed companies’ annual reports, Journals, SEC filling etc. Apart from this our team has access to various associations across the globe across different industries. Lastly, we have exchange relationships with various university as well as individual libraries.

Secondary Research

Step 2: Primary Research

When we talk about primary research, it is a type of study in which the researchers collect relevant data samples directly, rather than relying on previously collected data.  This type of research is focused on gaining content specific facts that can be sued to solve specific problems. Since the collected data is fresh and first hand therefore it makes the study more accurate and genuine.

We at SNS Insider have divided Primary Research into 2 parts.

Part 1 wherein we interview the KOLs of major players as well as the upcoming ones across various geographic regions. This allows us to have their view over the market scenario and acts as an important tool to come closer to the accurate market numbers. As many as 45 paid and unpaid primary interviews are taken from both the demand and supply side of the industry to make sure we land at an accurate judgement and analysis of the market.

This step involves the triangulation of data wherein our team analyses the interview transcripts, online survey responses and observation of on filed participants. The below mentioned chart should give a better understanding of the part 1 of the primary interview.

Primary Research

Part 2: In this part of primary research the data collected via secondary research and the part 1 of the primary research is validated with the interviews from individual consultants and subject matter experts.

Consultants are those set of people who have at least 12 years of experience and expertise within the industry whereas Subject Matter Experts are those with at least 15 years of experience behind their back within the same space. The data with the help of two main processes i.e., FGDs (Focused Group Discussions) and IDs (Individual Discussions). This gives us a 3rd party nonbiased primary view of the market scenario making it a more dependable one while collation of the data pointers.

Step 3: Data Bank Validation

Once all the information is collected via primary and secondary sources, we run that information for data validation. At our intelligence centre our research heads track a lot of information related to the market which includes the quarterly reports, the daily stock prices, and other relevant information. Our data bank server gets updated every fortnight and that is how the information which we collected using our primary and secondary information is revalidated in real time.

Data Bank Validation

Step 4: QA/QC Process

After all the data collection and validation our team does a final level of quality check and quality assurance to get rid of any unwanted or undesired mistakes. This might include but not limited to getting rid of the any typos, duplication of numbers or missing of any important information. The people involved in this process include technical content writers, research heads and graphics people. Once this process is completed the title gets uploader on our platform for our clients to read it.

Step 5: Final QC/QA Process:

This is the last process and comes when the client has ordered the study. In this process a final QA/QC is done before the study is emailed to the client. Since we believe in giving our clients a good experience of our research studies, therefore, to make sure that we do not lack at our end in any way humanly possible we do a final round of quality check and then dispatch the study to the client.