Audio Amplifier Market Size & Overview:
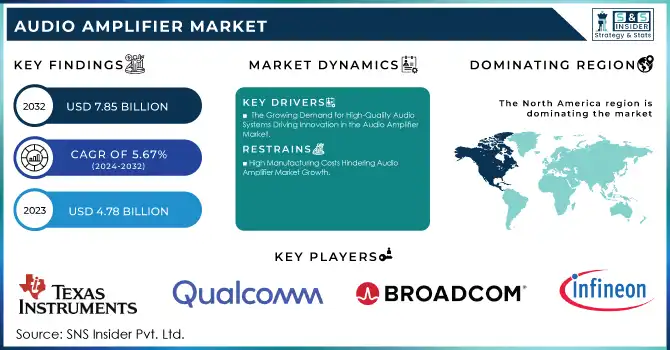
The Audio Amplifier Market Size was valued at USD 4.78 billion in 2023 and is expected to reach USD 7.85 billion by 2032 and grow at a CAGR of 5.67% over the forecast period 2024-2032.
Get more information on Audio Amplifier Market - Request Sample Report
The audio amplifier market is experiencing significant growth, particularly due to the rise in demand for high-quality automotive audio systems. With automotive manufacturers increasingly focusing on enhancing in-car entertainment, the adoption of advanced audio amplifiers has surged. Modern vehicles are now equipped with sophisticated sound systems that offer immersive audio experiences, including surround sound, enhanced bass,. As consumers prioritize superior sound quality, automotive audio amplifiers have become a crucial component in achieving optimal performance. The digital revolution in car audio systems, including the shift to class D amplifiers and GaN-based technologies, is enabling more efficient, powerful, and compact audio systems, offering improved audio quality without compromising on space or weight. Additionally, automotive OEMs and aftermarket audio system manufacturers are constantly innovating to meet consumer expectations for top-tier audio experiences, further fueling the market’s expansion. According to industry reports, companies such as Harman Kardon, Bose, and Pioneer have been at the forefront of integrating high-performance amplifiers into automotive audio solutions, contributing to a surge in adoption. The continuous evolution of automotive infotainment systems and in-car audio technologies, combined with rising consumer demand for high-fidelity audio experiences, ensures that the automotive sector will remain a dominant driver for the audio amplifier market in the coming years. As smart vehicles and electric vehicles (EVs) become more prevalent, the integration of cutting-edge audio amplifiers will only grow, pushing the market toward new heights. The global automotive audio amplifier market is poised for robust growth, driven by innovation, demand for high-quality audio, and technological advancements in the automotive sector. Automotive audio amplifier market growth will continue to accelerate as manufacturers incorporate state-of-the-art sound systems, enhancing the driving experience with unparalleled audio performance.
Audio Amplifier Market Dynamics
Drivers
-
The Growing Demand for High-Quality Audio Systems Driving Innovation in the Audio Amplifier Market
The rise of advanced automotive audio systems is a significant driver for the audio amplifier market, as consumers demand higher quality in-car entertainment. Automotive manufacturers are increasingly integrating high-performance audio amplifiers into vehicles to meet these growing expectations. Innovations like Texas Instruments' (TI) radar sensor and audio processors are enhancing the in-cabin audio experience by improving sound clarity and voice recognition. For example, TI's NA1150 audio amplifier, which utilizes pulse-width modulation (PWM) technology, efficiently drives speakers, boosting both audio quality and reducing power consumption. This technology is helping automotive manufacturers deliver clearer, more powerful sound systems while maintaining energy efficiency. Simultaneously, the home audio market is experiencing a surge in demand for high-fidelity sound systems, with products like the Onkyo Icon Series amplifiers that support both vinyl and streaming formats. These amplifiers cater to consumers who seek premium audio experiences in their home theaters, further fueling the demand for advanced audio amplifiers. As the need for premium sound rises, automotive and home audio markets are witnessing the increasing integration of smart amplifiers that connect to streaming services. This growing trend is driving the audio amplifier market by enabling more innovative and energy-efficient solutions. Consumers are increasingly seeking best-in-class audio experiences both in their vehicles and at home, which continues to spur the adoption of advanced amplifiers. The increasing focus on high-quality sound is shaping the future of the audio amplifier market, making it a critical area for ongoing technological innovation and investment. As automotive and home entertainment systems evolve, the demand for high-performance audio amplifiers will continue to rise, propelling market growth across industries.
Restraints
-
High Manufacturing Costs Hindering Audio Amplifier Market Growth
One of the key restraints in the audio amplifier market is the high manufacturing costs associated with advanced technologies. Cutting-edge features like pulse-width modulation (PWM), smart amplification, and AI integration significantly increase production expenses. For instance, high-power amplifiers designed for professional audio systems require premium components such as custom capacitors and power transistors, which make up a large portion of the overall material costs. Reports from KSA Audio indicate that material costs account for 40-60% of total manufacturing expenses, which can drive up the retail price of the product. The complexity of the production process, including the need for specialized labor and high-quality materials, adds further costs. Additionally, the global supply chain disruptions, particularly in semiconductor shortages, have caused delays and escalated prices for essential components, affecting the affordability of high-performance audio amplifiers. This is particularly evident in the automotive and consumer electronics sectors, where manufacturers must balance cost and performance. As a result, these high production costs limit the market's ability to cater to price-sensitive consumers and restrict the widespread adoption of premium audio amplifiers. While there is increasing demand for high-fidelity sound systems in both home entertainment and automotive applications, the elevated costs associated with these innovations continue to challenge manufacturers in reaching broader customer bases, especially in emerging markets where affordability plays a significant role in purchasing decisions.
Audio Amplifier Market Segment Analysis
By Channel Type
The Mono Channel segment currently dominates the audio amplifier market, accounting for approximately 46% of the market share. Mono channel amplifiers are preferred for their simplicity and efficiency in driving single speakers, making them ideal for compact audio systems, portable speakers, and home theater setups. These amplifiers are particularly popular in budget-friendly products and entry-level audio devices, where cost-effectiveness is crucial. Additionally, mono amplifiers offer benefits like lower power consumption and reduced size, which are appealing for manufacturers aiming to create lightweight, energy-efficient audio solutions. This growing demand for mono channel audio amplifiers is largely driven by the increasing use of audio systems in consumer electronics and automotive applications, where compact and high-performance solutions are needed.
By End User
The consumer electronics segment holds the dominant share of around 56% in the audio amplifier market as of 2023. This dominance is driven by the increasing demand for high-quality audio experiences in a wide range of devices such as smartphones, TVs, laptops, and portable speakers. With the continuous innovation in home entertainment systems and wearable audio devices, consumer electronics remain the primary driver for the audio amplifier market. Additionally, the growing popularity of streaming services and smart home ecosystems has further fueled the demand for audio amplifiers that deliver superior sound quality. As consumer preferences shift towards premium sound experiences, the consumer electronics sector continues to lead in amplifying market growth.
Audio Amplifier Market Regional Outlook:
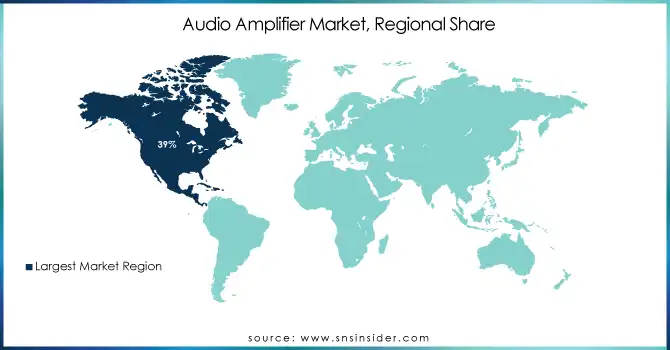
In 2023, North America holds the dominant share of around 39% in the audio amplifier market, driven by significant developments in both the U.S. and Canada. The region's leadership is attributed to the rapid growth of consumer electronics, automotive, and entertainment industries, where high-quality audio systems are essential. The U.S. is a hub for technological innovation, with companies like Texas Instruments, NXP Semiconductors, and Analog Devices pioneering advanced audio amplifier technologies. The rise of premium audio systems in automotive manufacturing, particularly in high-end vehicles, has fueled demand for cutting-edge amplifiers. Strong consumer spending, coupled with increasing adoption of smart home devices, ensures North America remains at the forefront of the global audio amplifier market, driving innovation and growth.
The Asia-Pacific region is the fastest-growing market for audio amplifiers, projected to witness robust growth from 2024 to 2032. This expansion is fueled by the increasing adoption of consumer electronics, rapid urbanization, and a burgeoning middle class with rising disposable incomes. Countries like China, India, and Japan are at the forefront, with China being a global manufacturing hub for audio equipment and India experiencing a surge in smartphone and smart device adoption. Additionally, the growing popularity of home entertainment systems and the integration of advanced audio technologies in automotive sectors drive regional demand. Government initiatives supporting industrial automation and the proliferation of IoT-enabled devices further contribute to growth. Asia-Pacific's dynamic consumer base and technological advancements make it a crucial driver for the global audio amplifier market.
Get Customized Report as per your Business Requirement - Request For Customized Report
KEY PLAYERS:
Some of the major key players in Audio Amplifier Market with their product:
-
Texas Instruments (Class D Audio Amplifiers)
-
Qualcomm Technologies (Snapdragon Audio, Class D Amplifiers)
-
NXP Semiconductors (Digital Amplifiers, Automotive Audio Amplifiers)
-
STMicroelectronics (Class D Audio Amplifiers, Integrated Circuits for Audio Systems)
-
Cirrus Logic (Audio Codec Amplifiers, Digital Amplifiers)
-
Analog Devices (Power Amplifiers, Audio Signal Processing ICs)
-
Broadcom Inc. (Audio Amplifier ICs)
-
On Semiconductor (Class D Amplifiers, Audio Amplifier ICs)
-
Infineon Technologies (Class D Audio Amplifiers)
-
Harman International (Samsung Electronics) (Car Audio Systems, Home Audio Systems)
-
NAD Electronics (Home Audio Amplifiers, Integrated Amplifiers)
-
Pioneer Corporation (Car Audio Amplifiers, Home Audio Systems)
-
Sony Corporation (Portable Audio Amplifiers, Home Audio Systems)
-
Cambridge Audio (Hi-Fi Audio Amplifiers, Integrated Amplifiers)
-
Yamaha Corporation (AV Receivers, Hi-Fi Audio Amplifiers)
-
LG Electronics (Soundbars, Home Audio Systems)
-
Vizio Inc. (Home Audio Systems, Soundbars)
-
Denon (Sound United) (Home Theater Amplifiers, AV Receivers)
-
KEF Audio (Hi-Fi Amplifiers, Audio Systems)
-
Bose Corporation (Portable Audio Amplifiers, Home Audio Systems)
List Potential Customer in Audio Amplifier Market
-
Sony
-
Samsung
-
LG Electronics
-
Tesla
-
Ford
-
BMW
-
General Motors
-
Bose
-
Sonos
-
Harman Kardon
-
Shure
-
Behringer
-
Mackie
-
Apple
-
Google
-
JBL
-
Ultimate Ears
-
Anker
-
Vizio
-
Panasonic
RECENT DEVELOPMENT
-
January 2025, Texas Instruments (TI) has unveiled advanced automotive chips featuring edge AI capabilities, enhancing safety and premium in-cabin experiences. Highlights include the industry's first 60GHz mmWave radar sensor for in-cabin safety, vector-based DSP cores for superior audio, and innovative one-inductor modulation technology for Class-D amplifiers.
-
Aug 2024, Qualcomm unveiled the Snapdragon 7s Gen 3, a mid-range 4nm chipset boasting 20% better CPU performance, 45% efficiency, and 40% enhanced GPU capabilities. Key features include GenAI, 144Hz FHD+ displays, 4K HDR video capture, and advanced audio support.
-
Nov 2024, Bose Corporation announced the acquisition of McIntosh Group, combining over 175 years of expertise in high-performance audio to expand Bose's portfolio with luxury amplifiers, speakers, and turntables.
| Report Attributes | Details |
| Market Size in 2023 | USD 4.78 Billion |
| Market Size by 2032 | USD 7.85 Billion |
| CAGR | CAGR of 5.67% From 2024 to 2032 |
| Base Year | 2023 |
| Forecast Period | 2024-2032 |
| Historical Data | 2020-2022 |
| Report Scope & Coverage | Market Size, Segments Analysis, Competitive Landscape, Regional Analysis, DROC & SWOT Analysis, Forecast Outlook |
| Key Segments | • By Channel Type(Mono Channel, Two Channel, Four Channel, Six Channel, Others) • By Device (Smartphones, Television Sets, Tablets, Desktops & Laptops, Home Audio Systems, Automotive Infotainment Systems, Professional Audio Systems) • By End User (Consumer Electronics, Automotive, Entertainment) |
| Regional Analysis/Coverage | North America (US, Canada, Mexico), Europe (Eastern Europe [Poland, Romania, Hungary, Turkey, Rest of Eastern Europe] Western Europe] Germany, France, UK, Italy, Spain, Netherlands, Switzerland, Austria, Rest of Western Europe]), Asia Pacific (China, India, Japan, South Korea, Vietnam, Singapore, Australia, Rest of Asia Pacific), Middle East & Africa (Middle East [UAE, Egypt, Saudi Arabia, Qatar, Rest of Middle East], Africa [Nigeria, South Africa, Rest of Africa], Latin America (Brazil, Argentina, Colombia, Rest of Latin America) |
| Company Profiles | Texas Instruments, Qualcomm Technologies, NXP Semiconductors, STMicroelectronics, Cirrus Logic, Analog Devices, Broadcom Inc., On Semiconductor, Infineon Technologies, Harman International (Samsung Electronics), NAD Electronics, Pioneer Corporation, Sony Corporation, Cambridge Audio, Yamaha Corporation, LG Electronics, Vizio Inc., Denon (Sound United), KEF Audio, and Bose Corporation. |
| Key Drivers | • The Growing Demand for High-Quality Audio Systems Driving Innovation in the Audio Amplifier Market. |
| Restraints | • High Manufacturing Costs Hindering Audio Amplifier Market Growth. |
Frequently Asked Questions
Ans: The market driver in the audio amplifier market is the increasing demand for high-quality sound systems in consumer electronics, automotive, and home entertainment applications.
Ans: Texas Instruments, Qualcomm Technologies, NXP Semiconductors, STMicroelectronics, Cirrus Logic, Analog Devices, Broadcom Inc., On Semiconductor, Infineon Technologies, Harman International (Samsung Electronics), NAD Electronics, Pioneer Corporation, Sony Corporation, Cambridge Audio, Yamaha Corporation, LG Electronics, Vizio Inc., Denon (Sound United), KEF Audio, and Bose Corporation.
Ans: The expected CAGR of the global Audio Amplifier Market during the forecast period is 5.67%.
Ans: The Audio Amplifier Market was valued at USD 4.78 billion in 2023.
Ans:North America is the dominating Region in Audio Amplifier Market
Get in Touch
