PM2.5 Sensors Market Report Scope and Overview:
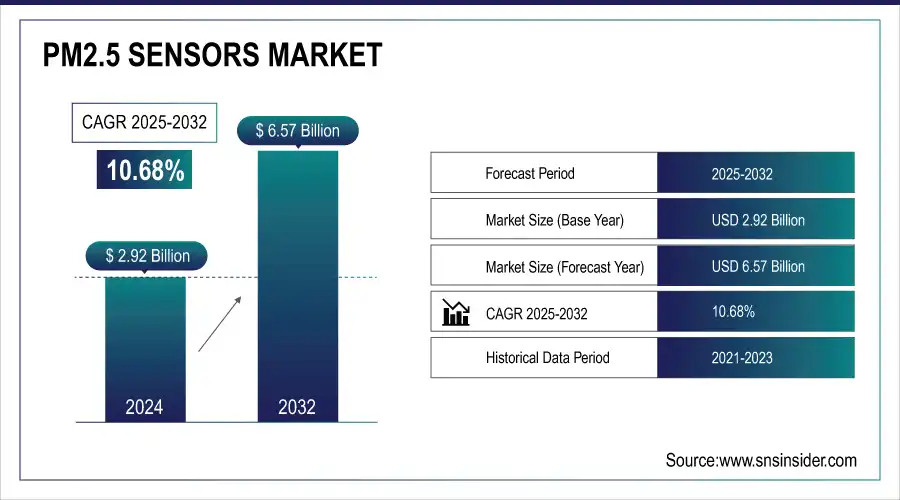
The PM2.5 Sensors Market size was valued at USD 3.23 Billion in 2025E and is projected to reach USD 7.28 Billion by 2033, at 10.68% CAGR from 2026-2033.
The PM2.5 sensor market is experiencing steady growth due to increasing concerns over air pollution and its effects on public health. Demand is rising across urban and rural areas for real-time, low-cost air quality monitoring solutions that can be easily deployed in schools, cities, and industrial zones. Governments, environmental organizations, and community groups are actively investing in sensor networks to support awareness, policy-making, and preventive health strategies. The market is also benefiting from improvements in sensor accuracy, durability, and integration with digital platforms for data sharing. As more regions prioritize clean air initiatives, especially in developing countries, the need for scalable and locally adaptable PM2.5 sensors continues to expand, creating new opportunities for manufacturers and service providers globally.
IQAir’s 2024 World Air Quality Report highlights PM2.5 as the leading environmental health risk, with data sourced from over 40,000 ground-level monitors across 138 countries.Through its Schools4Earth initiative, IQAir is scaling real-time PM2.5 monitoring in schools globally, aiming to reach one million institutions to boost awareness and protect student health.
PM2.5 Sensors Market Size and Forecast:
-
Market Size in 2025E: USD 3.23 Billion
-
Market Size by 2033: USD 7.28 Billion
-
CAGR: 10.68% from 2026 to 2033
-
Base Year: 2025E
-
Forecast Period: 2026–2033
-
Historical Data: 2022–2024
To Get More Information On PM2.5 Sensors Market - Request Free Sample Report
PM2.5 Sensors Market Highlights:
-
Seasonal variation drives calibration needs as accuracy of low-cost PM2.5 sensors is affected by seasonal changes, necessitating local calibration and regular maintenance for reliable environmental monitoring
-
Growing importance in public health with low-cost sensors increasingly used by municipal authorities, researchers, and civic organizations to track pollution, issue alerts, and inform health policies, especially in regions lacking traditional infrastructure
-
Integration challenges limit scalability because incorporating PM2.5 sensors into IoT devices, HVAC systems, and wearables is complex due to space, power, calibration, and software compatibility issues, slowing mass adoption
-
Rising demand for indoor air quality monitoring with industrial, residential, and portable applications driving need for highly accurate, energy-efficient, small-footprint PM2.5 sensors
-
Innovation in smart sensors demonstrated by products like Honeywell’s IPM Series offering self-calibration, ultra-low power consumption, and precise PM2.5/PM10 detection, enabling reliable long-term operation in compact IoT applications
-
Regulatory and market growth opportunities as regulatory emphasis on real-time air quality data and increasing awareness of pollutant health impacts expand demand for advanced, multi-sensor indoor air monitoring solutions
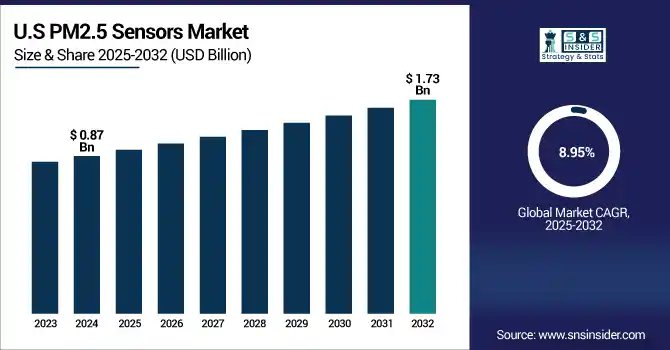
The U.S PM2.5 Sensors Market size was valued at USD 0.95 Billion in 2025E and is projected to reach USD 1.88 Billion by 2033, growing at a CAGR of 8.95% during 2026-2033. The PM2.5 Sensors market growth is influenced by growing health awareness, strict environmental norms, growing penetration in smart homes and smart city projects, requirement for real-time air quality monitoring and declining prices of sensors.
PM2.5 Sensors Market Drivers:
-
Seasonal Variations Impact Accuracy of Low-Cost PM2.5 Sensors, Driving Need for Context-Specific Calibration and Maintenance
Low-cost PM2.5 sensors are emerging as vital tools for environmental health monitoring, especially in regions lacking traditional infrastructure. A recent study in West Africa found that while these sensors correlate well with reference-grade monitors, their accuracy is significantly affected by seasonal changes particularly during dry periods when long-range pollution transport occurs. This inconsistency highlights the need for regular maintenance and local calibration to ensure data reliability. Municipal authorities can use these sensors to track pollution patterns, issue alerts, and craft health-responsive policies. Civic organizations and researchers can utilize the data for community engagement and advocacy. As Africa urbanizes rapidly, these sensors can provide actionable air quality intelligence bridging the environmental monitoring gap and supporting public health protection efforts.
On March 25, 2025, a study titled "Low-Cost PM2.5 Sensor Performance Characteristics against Meteorological Influence in Sub-Saharan Africa" revealed strong R² correlations (up to 0.97) between low-cost sensors and reference monitors in West Africa.
PM2.5 Sensors Market Restraints:
-
Integration Complexity Limits Scalability of PM2.5 Sensors in Smart Systems
The integration of PM2.5 sensors into compact, multi-functional systems such as IoT-enabled devices, HVAC units, and wearable technologies presents a major technical restraint for the market. Manufacturers face challenges in ensuring seamless sensor performance without compromising space, energy efficiency, or device aesthetics. The need for specialized hardware interfaces, sensor calibration, and software compatibility increases development time and costs, making it difficult to scale production for mass-market applications. Furthermore, integrating advanced features like wireless connectivity, real-time data analysis, and cloud sync while maintaining low power consumption adds to the complexity. These integration hurdles can slow adoption rates, particularly among budget-sensitive or resource-constrained developers, restraining broader implementation across residential and commercial environmental monitoring solutions.
PM2.5 Sensors Market Opportunities:
-
Rising Demand for Accurate Indoor Air Monitoring Drives Opportunities for Energy-Efficient Smart Sensors
The growing emphasis on indoor air quality monitoring especially in industrial, residential, and portable applications is opening new market opportunities for advanced PM2.5 sensors. The increasing demand for monitoring indoor air quality especially for industrial, residential, and portable applications – is expected to create new market opportunities for advanced PM 2. 5 sensors. As more is understood about the health dangers of airborne pollutants, the demand is moving toward extremely precise, energy-efficient, small-footprint sensor devices. Innovations such as Honeywell s self-calibrating IPM Series exemplify the appetite of the market for smart sensors that guarantee long-term reliability with the minimum maintenance. These attributes make them well-suited for battery-operated and size-constrained IoT applications. Additionally, regulatory driven demand for real-time air quality data in indoor spaces is driving strong availability for multi-sensor solutions. As sensor makers focus more on performance-compactness-energy consumption trade-offs, smart buildings, HVAC systems, and consumer health devices will experience especially strong growth.
Honeywell launched the IPM Series particulate matter sensor featuring self-calibration, ultra-low power use, and precision PM2.5/PM10 detection.
PM2.5 Sensors Market Segment Analysis:
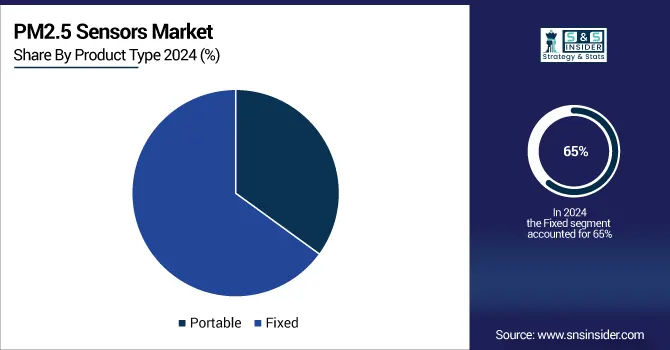
By Product Type
The Fixed segment held a dominant PM2.5 Sensors Market share of around 65% in 2025E, on account of its broad application in industry, environment and regulatory control monitoring. Delivering reliable high precision performance over time, it is the perfect solution for stationary air quality monitoring in urban and industrial sites enabling the expansion of existing air quality networks.
The Portable segment is expected to experience the fastest growth in the PM2.5 Sensors Market over 2026-2033 with a CAGR of 12.07%. driven by rising demand for real-time, on-the-go air quality monitoring. Increased adoption in wearable devices, mobile air quality monitors, and personal health gadgets is fueling growth, especially amid heightened awareness of individual respiratory health and urban pollution exposure.
By Technology
The Optical segment dominated the PM2.5 Sensors Market with a 65% share in 2025E and is projected to grow fastest through 2032 The high accuracy, real-time monitoring and low maintenance of M(II)EE make it popular. Rising need for compact, low-cost, and low-power solutions for consumer electronic, industrial, and environmental applications continue to drive the explosive growth within technology sector.
By Application
The Indoor Air Quality Monitoring segment held a dominant PM2.5 Sensors Market share of around 44% in 2025E, driven by growing concerns over indoor pollution, especially in residential, commercial, and institutional settings. Rising health awareness, stricter indoor air quality regulations, and increased deployment of smart HVAC and building automation systems are fueling demand for accurate, real-time indoor particulate monitoring solutions.
The Outdoor Air Quality Monitoring segment is expected to experience the fastest growth in the PM2.5 Sensors Market over 2026-2033 with a CAGR of 12.07%. fueled by urbanization, growing air pollution and increased regulations to protect the environment. The increasingly rapid installation of smart city systems and investment from governments for public health monitoring have also contributed to the acceleration of outdoor PM2. 5 sensor technologies.
By End User
The Residential segment held a dominant PM2.5 Sensors Market share of around 34% in 2025E, driven by growing consumer awareness of indoor air pollution and health risks. Increasing adoption of smart home technologies, air purifiers, and IoT-based monitoring devices is boosting demand. Rising urbanization and concerns about respiratory health are further accelerating sensor integration into household environments.
The Commercial segment is expected to experience the fastest growth in the PM2.5 Sensors Market over 2026-2033 with a CAGR of 11.51%, due to the stringent indoor air quality regulations and growing installation of sensors in offices, malls, schools, hospitals, among others. Increasing focus on employee, and customer well-being and ESG and usage in building automation are driving mass adoption of sensors in commercial settings.
PM2.5 Sensors Market Regional Highlights:
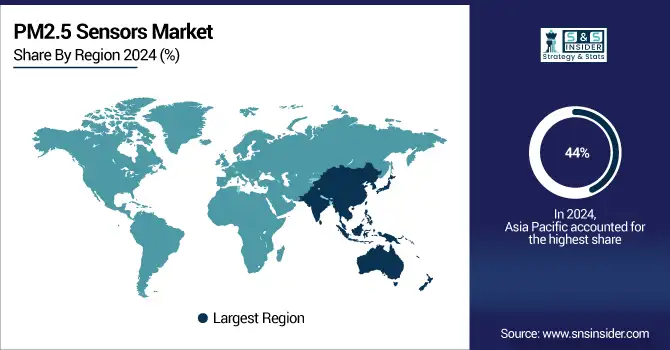
Asia-Pacific PM2.5 Sensors Market Trends:
In 2025E, the Asia Pacific dominated the PM2.5 Sensors Market and accounted for 44% of revenue share, due to large scale urbanization, industrialization and increasing air pollution. Market Trends Governmental regulations for environmental monitoring are driving strong adoption of PM2. 5 monitoring stations in residential, commercial, and industrial areas of the region.
China’s dominance in the Asia Pacific PM2.5 Sensors Market, due to heavy urban pollution, stringent regulations, and rapid adoption of smart monitoring technologies across residential, industrial, and public infrastructure segments.
Get Customized Report as Per Your Business Requirement - Enquiry Now
North America PM2.5 Sensors Market Trends:
North America is projected to register the significant growth for CAGR of 9.06% during 2026-2033, as this region witnesses an increasing health conscious populace, high installation of advanced HVAC, implementation of government air quality control regulations as well as rising incorporation of smart air monitoring systems in industrial facilities, schools, and homes.
The U.S. leads the PM2.5 Sensors Market, driven by strict air quality regulations, smart device adoption, and growing demand for accurate indoor and outdoor pollution monitoring across residential and industrial sectors.
Europe PM2.5 Sensors Market Trends:
In 2025E, Europe emerged as a promising region in PM2.5 Sensors Market, is the increasing environmental concern, strict EU air quality regulations and investments for smart city infrastructure. The increasing awareness and regulatory pressure related to health issues are driving the demand for cutting-edge air quality monitoring systems for residential, industrial, and urban settings.
Latin America & Middle East & Africa PM2.5 Sensors Market Trends:
LATAM and MEA is experiencing steady growth in the PM2.5 Sensors Market, has been growing in the PM2. 5 sensors market due to urbanization, pollution levels, and demand for better respiratory health. Environmental monitoring-oriented government projects and international cooperation have stimulated the use of sensors in smart city programs and industrial parks in these developing areas as well.
PM2.5 Sensors Market Competitive Landscape:
Thermo Fisher Scientific, established in 2006, is a global leader in scientific instrumentation, reagents, and laboratory services. The company provides advanced solutions for research, healthcare, environmental monitoring, and industrial applications, including PM2.5 air quality monitors, analytical instruments, and laboratory equipment, serving scientists and organizations worldwide.
-
In Jul 2024 – Thermo Fisher Scientific launched the 5014iQ Beta Attenuation Monitor and 5030iQ SHARP Monitor for real-time, continuous PM2.5 monitoring globally. These instruments combine beta attenuation and light scattering technologies for precise, high-resolution air quality measurements
PM2.5 Sensors Market Key Players:
-
Honeywell International Inc.
-
Rohde & Schwarz
-
Bosch Sensortec GmbH
-
Sensirion AG
-
Aeroqual Ltd.
-
Amphenol Advanced Sensors
-
Siemens AG
-
Teledyne Technologies Inc.
-
TSI Incorporated
-
3M Company
-
Sharp Corporation
-
Panasonic Corporation
-
Plantower Co., Ltd.
-
Shinyei Technology Co., Ltd.
-
Omron Corporation
-
Thermo Fisher Scientific Inc.
-
Alphasense Ltd.
-
Airthings AS
-
Kanomax USA, Inc.
-
Enviro Technology Services Plc
| Report Attributes | Details |
|---|---|
| Market Size in 2025E | USD 3.23 Billion |
| Market Size by 2033 | USD 7.28 Billion |
| CAGR | CAGR of 10.68% From 2026 to 2033 |
| Base Year | 2025E |
| Forecast Period | 2026-2033 |
| Historical Data | 2022-2024 |
| Report Scope & Coverage | Market Size, Segments Analysis, Competitive Landscape, Regional Analysis, DROC & SWOT Analysis, Forecast Outlook |
| Key Segments | • By Product Type (Portable, Fixed) • By Technology (Optical, Electrochemical, Gravimetric, Others) • By Application (Indoor Air Quality Monitoring, Outdoor Air Quality Monitoring, Industrial Emissions Monitoring, Others) • By End User (Residential, Commercial, Industrial, Government, Others) |
| Regional Analysis/Coverage | North America (US, Canada), Europe (Germany, UK, France, Italy, Spain, Russia, Poland, Rest of Europe), Asia Pacific (China, India, Japan, South Korea, Australia, ASEAN Countries, Rest of Asia Pacific), Middle East & Africa (UAE, Saudi Arabia, Qatar, South Africa, Rest of Middle East & Africa), Latin America (Brazil, Argentina, Mexico, Colombia, Rest of Latin America). |
| Company Profiles | Honeywell International Inc., Rohde & Schwarz, Bosch Sensortec GmbH, Sensirion AG, Aeroqual Ltd., Amphenol Advanced Sensors, Siemens AG, Teledyne Technologies Inc., TSI Incorporated, 3M Company, Sharp Corporation, Panasonic Corporation, Plantower Co., Ltd., Shinyei Technology Co., Ltd., Omron Corporation, Thermo Fisher Scientific Inc., Alphasense Ltd., Airthings AS, Kanomax USA, Inc., Enviro Technology Services Plc. |
Frequently Asked Questions
Ans: Asia-Pacific dominated the PM2.5 Sensors Market in 2025.
Ans: The “Fixed” segment dominated the PM2.5 Sensors Market.
Ans: Rising health concerns, stricter environmental regulations, and growing adoption of air quality monitoring in smart cities are key drivers of the PM2.5 sensors market.
The PM2.5 Sensors Market size was valued at USD 3.23 Billion in 2025E and is projected to reach USD 7.28 Billion by 2033, at 10.68% CAGR from 2026-2033.
Ans: The PM2.5 Sensors Market is expected to grow at a CAGR of 10.68% during 2026-2033.
Get in Touch
