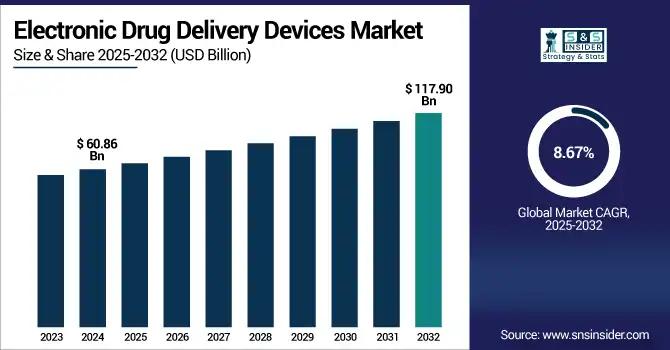
The electronic drug delivery devices market size was valued at USD 60.86 billion in 2024 and is expected to reach USD 117.90 billion by 2032, growing at a CAGR of 8.67% over the forecast period of 2025-2032.
The global electronic drug delivery devices market is growing on account of the increasing prevalence of chronic diseases, working across patient care settings, and the introduction of connected healthcare devices. Adopting IoT and smart sensors in drug adherence, remote monitoring, and treatment precision. Rising use of home care and convenient wearable devices would continue to provide market growth. Favorable regulatory landscapes and digital health investments are projected to drive growth through 2032 in diabetes, oncology, respiratory, and cardiovascular device subsegments.
The U.S. electronic drug delivery devices market size was valued at USD 19.50 billion in 2024 and is expected to reach USD 36.85 billion by 2032, growing at a CAGR of 8.33% over the forecast period of 2025-2032.
The U.S. dominated the electronic drug delivery devices market due to the well-established healthcare sector, along with diabetes and asthma being well-penetrated, which are the major advantages that the North American sector has over all the other regions. Positive reimbursement environments and a rise in digital health investments also contribute to the country’s leadership in the market.
In January 2025, West Pharmaceutical Services introduced Daikyo PLASCAP Ready-to-Use Validated (RUV) closures, which are metal-free polypropylene closures with an integrated stopper for easy press-fit vial sealing in one step. These closures are packaged in response to the demand that they be offered to you in both the 13mm and 20mm vial sizes. The new design of the nested tray is engineered to directly support West’s Compact 10ml Nested CZ vials, along with select nested vials with a 20mm crown.
Market Dynamics:
Drivers:
Increasing Demand for Home-Based and Remote Patient Monitoring is Driving the Market Growth
Healthcare is moving away from hospital-based treatment to home-based treatment, especially in areas such as chronic diseases, such as diabetes, asthma, and hypertension. Patients are comfortable and prefer to manage their therapies at home, which saves hospital visits and costs. Available electronic delivery systems, including wearable infusion pumps and smart inhalers, appear to be highly appropriate for this context, given their precision dosing, convenient self-administration, and compatibility with telehealth modalities. This challenge is augmented by the increasing geriatric population and the requirement for long-term control of diseases at non-clinical locations.
RPM was utilized by more than 60 million people in the U.S. in 2024, demonstrating a fast-rising use of home-based care modalities.
In many states, Medicare and Medicaid pay for RPM installation and monitoring reimbursement, furthering homecare device and service integration.
As highlighted in the academic literature, AI-driven, IoT-based RPM offers significant value in managing chronic and elderly care1 by allowing early-onset detection of health decline and reducing hospital readmission rates.
Market Growth of Electronic Drug Delivery Devices is Stimulated by Technological Improvements
The current electronic drug delivery systems are becoming more and more Bluetooth-, Wi-Fi-, and smartphone-enabled and can provide real-time information from the patient to the physician. These intelligent functions aid monitoring adherence, reminder notification, dosage history recording, and even remote therapy adjustment. Such connectivity is not only beneficial to precision treatment and patient safety, but also to remote monitoring and digital health ecosystems. With increasing reliance on data in healthcare and the personalization of treatments, such technologies are significantly driving the electronic drug delivery devices market growth.
In March 2024, the FDA approved Adherium’s Hailie Smartinhaler (also known as Plug-in) for AstraZeneca Airsupra and Breztri inhalers, offering real-time medication adherence monitoring and technique feedback.
Industry collaborations are connecting SaMD platforms with injectors and inhalers– Aptar Digital Health collaborates with SHL Medical to strengthen real-time monitoring and clinician dashboards.
Restraints:
Data Privacy and Cybersecurity Concerns are Restricting the Market Growth
As electronic drug delivery devices become more networked, employing Bluetooth, Wi-Fi, and smartphone applications, they will relay sensitive health information, including dosage regimens, adherence logs, and patient-specific treatment details. This being a good thing for remote monitoring and online control, it also opens up the system to cyberattacks. Such unauthorized access, data theft, or hacking could potentially endanger patient safety and breach privacy-related laws. In addition, stringent data privacy regulations on HIPAA (U.S.) and GDPR (Europe) demand that their products include strong encryption, secure cloud storage, and compliance protocols, further adding to design complexity and operational expenses. Those concerns can sometimes slow the pace of adoption, particularly in areas that are sensitive to digital security.
Segmentation Analysis:
By Product
The implantable drug delivery devices segment dominated the electronic drug delivery devices market share in 2024 with a 31.29%, since drug release can be controlled over the long term for chronic diseases (cancer, cardiovascular diseases, and neurological diseases). These devices promote increased patient adherence, shorter dosing intervals, and better treatment results and are highly favored in hospital and specialty clinic environments. Furthermore, improvements in the biocompatibility of materials and miniaturization technology have significantly increased the reliability and reduced invasiveness of implantable devices, and, as a result, these are now being increasingly adopted in developed health care sectors.
The smart metered dose inhalers (inhalation devices) segment is expected to be the fastest-growing during the forecast period as the incidence of respiratory diseases, such as asthma and COPD, is increasing, especially in emerging countries. These developments incorporate conventional inhalation with intelligent systems, including dose monitoring, usage alerts, and links with mobile applications, resulting in a device offering enhanced drug compliance and the ability to monitor remotely. The increasing trend of patient-friendly, disposable, portable, and convenient drug delivery devices, coupled with the rising adoption of IoT and digital health platforms, is anticipated to drive the segment in homecare and clinical settings.
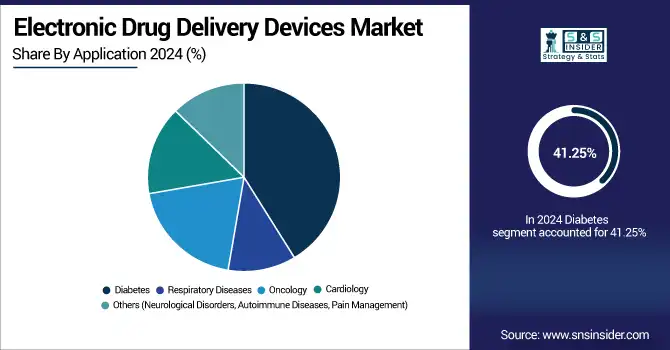
By Application
In 2024, the electronic drug delivery devices market was led by the diabetes segment with around 41.25% market share on account of the high prevalence of diabetes globally, and increasing adoption of electronic insulin delivery devices, such as smart insulin pumps and connected pen injectors. These systems provide accurate dosing, linkage to continuous glucose monitoring, and instantaneous feedback, which greatly improve adherence to regimen and glycemic control. Furthermore, rising awareness, well-established reimbursement systems, and a move toward home care for diabetes are other factors that drive users toward the adoption of electronic drug delivery systems by diabetes patients.
The oncology segment is projected to grow at the fastest CAGR during the forecast period, attributed to the increasing prevalence of cancer across the globe and the increasing demand for targeted, personalized, and minimally invasive treatment options. Electronic drug delivery modes-esp. The implantable and the infusion-based systems allow for to programming of controlled and continuous drug administration with chemotherapeutic agents, ultimately leading to better therapeutic results with fewer side effects. The growing adoption of these devices in cancer care has been further propelled by technology improvements, increased clinical trials on smart delivery platforms, and growing investment in precision oncology.
By Connectivity
The Bluetooth-enabled devices segment dominated the electronic drug delivery devices market share with a 46.2% on account of their provision of aggregated and real-time data transmission from the drug delivery device to the healthcare monitoring systems. Such products improve patient acceptability and clinical judgement with features including remote monitoring, dose counting, and missed dose alerts. The fact that they have been broadly adopted in existing healthcare environments, such as hospitals and home care, has made them the preferred choice for patients and healthcare providers looking for connected and reliable drug delivery solutions.
The smartphone-connected devices segment is expected to exhibit the fastest growth over the forecast period, driven by the increase in mobile health applications and dramatic growth in smartphone adoption, as hookup apps allow the smartphone to become a hub connecting integrated portable sensors that form part of data networks. The devices can be directly interacted with to receive dosage reminders, visualize health data, and communicate with care teams through mobile applications. Increasing penetration of smartphones globally, particularly in the emerging economies, and the need for convenient, portable, and user-friendly medical devices, are likely to stimulate quick uptake of smartphone-connected drug delivery devices in developed and developing countries.
By End-User
The hospitals & clinics segment held the largest share in 2024 in the electronic drug delivery devices market with around 55.40% market share, owing to the increasing patient population, presence of a large number of skilled physicians, and highly advanced medical infrastructure. Initiating and following the in-home care with electronic drug delivery systems are considered first-line treatment for a variety of acute and chronic diseases, including cancer, cardiovascular diseases, and post-surgical care. Moreover, in many cases, hospitals are the first point of care that patients report to, to receive diagnosis and treatment for chronic diseases, and that leads to an increasing need for safe, highly precise drug delivery systems.
During the forecast period, the fastest growth in the market will be in the homecare settings segment, driven by the growing adoption of decentralized and patient-centered care methodologies by the healthcare industry. Increasing patient inclination toward home-based treatment in chronic diseases, wearability and patient convenience of drug delivery devices, and incorporation of telemedicine and remote patient monitoring are driving the trend. Furthermore, increasing cost of healthcare and the desire to minimize re-hospitalization rates among providers and patients are driving the demand for smart drug delivery products, which help with better healthcare management away from hospitals.
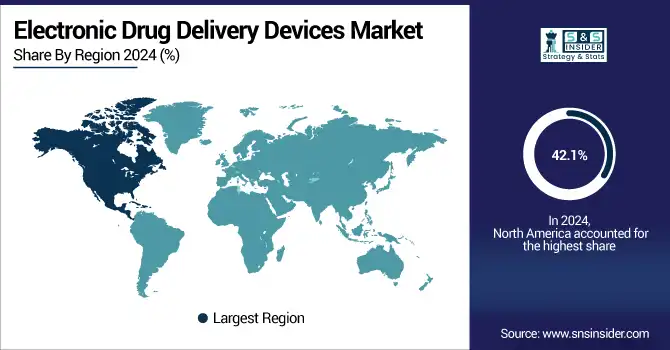
Regional Analysis:
North America is leading the electronic drug delivery devices market with a 42.1% market share as it has an established healthcare system, greater healthcare expenditure, and high acceptance of the technologically advanced medical devices. It has a high burden of chronic diseases such as diabetes, asthma, and heart problems, and therefore, there is a high need for an innovative and efficient way to deliver drugs. Moreover, favorable reimbursement scenario, presence of major players, and rising adoption of IoT and smart technologies in healthcare systems are some of the factors that are likely to drive the growth of the market in the region.
The electronic drug delivery devices market analysis is growing fastest with a 9.21% CAGR over the forecast period due to an increase in healthcare awareness, growing burden of chronic diseases, middle-class population in the Asia Pacific is the main driver for the electronic drug delivery devices. Rapid urbanization is expected to pave the way for an increase in the drug delivery devices market. Demand for smart drug delivery will be further accelerated in lucrative markets owing to increasing healthcare infrastructure investment in urban areas, such as China, India, and Japan, among others. Additionally, the large patient pool in the region and increased access to mobile and digital health solutions will create lucrative growth prospects for connected and home-use drug delivery devices.
The electronic drug delivery devices market trends in Europe are growing owing to developed healthcare infrastructure, increasing geriatric population, and prevalence of chronic diseases, including diabetes, cancer, and respiratory diseases. While the government is backing digital health innovation, favorable regulations and increasing demand for home care are boosting the use of electronic drug delivery systems. Moreover, leading pharmaceutical and medtech players in countries such as Germany, the U.K., and France also play a significant role in propelling the market in the region.
Latin America and MEA are growing at a moderate rate in the electronic drug delivery devices market, owing to the rising healthcare facilities and increasing awareness of advanced drug delivery technologies. Among Latin American countries, there is an increase in the prevalence of chronic diseases and growth in healthcare investments. Rising urban population and increased access to digital health platforms are also adding value to the gradual adoption of the market.
In MEA, the electronic drug delivery devices market growth developments are backed by healthcare reforms initiated by the government and improvements in the medical systems. The fast-growing connected health solutions, such as the inhalable drug systems, are also being adopted at various levels by countries, such as the UAE and Saudi Arabia. The increasing healthcare expenditure, medical tourism, and partnerships with international medtech players are boosting the market growth.
Key Players:
The electronic drug delivery devices market companies are Medtronic, Insulet Corporation, Tandem Diabetes Care, Becton Dickinson and Company (BD), Novo Nordisk, Teva Pharmaceutical Industries, Propeller Health, Adherium, Vectura Group, Aptar Pharma, Ypsomed, Elcam Medical, West Pharmaceutical Services, Stevanato Group, Gerresheimer, Smiths Medical, Debiotech, Eli Lilly and Company, Phillips-Medisize, Bayer, and other players.
In March 2025Tandem Diabetes Care made available its next-generation Control-IQ+ automated insulin delivery algorithm. The new algorithm is an extension of Tandem's hybrid closed-loop technology and aims to further improve glycemic control. Control-IQ+ is integrated with both the t: slim X2 and Mobi insulin pumps, allowing a wider population of patients to take advantage of the new technology.
In November 2023, Medtronic plc informed that it had won the approval of the U.S. Food and Drug Administration (FDA) for its Symplicity Spyral renal denervation (RDN) system or the Symplicity™ blood pressure procedure. The system will be used to treat hypertension. After the FDA approval, Medtronic announced the immediate beginning of commercialization efforts in the United States.
Report Attributes | Details |
Market Size in 2024 | USD 60.86 Billion |
Market Size by 2032 | USD 117.90 Billion |
CAGR | CAGR of 8.67% From 2025 to 2032 |
Base Year | 2024 |
Forecast Period | 2025-2032 |
Historical Data | 2021-2023 |
Report Scope & Coverage | Market Size, Segments Analysis, Competitive Landscape, Regional Analysis, DROC & SWOT Analysis, Forecast Outlook |
Key Segments | • By Product (Smart Infusion Pumps, Smart Metered Dose Inhalers, Implantable Drug Delivery Devices, Smart Transdermal Patches, Others) • By Application (Diabetes, Respiratory Diseases, Oncology, Cardiology, Others) • By Connectivity (Bluetooth-Enabled Devices, Smartphone-Integrated Devices, Standalone Devices) • By End User (Hospitals & Clinics, Homecare Settings, Ambulatory Surgical Centers, Specialty Clinics, Others) |
Regional Analysis/Coverage | North America (US, Canada, Mexico), Europe (Germany, France, UK, Italy, Spain, Poland, Turkey, Rest of Europe), Asia Pacific (China, India, Japan, South Korea, Singapore, Australia, Rest of Asia Pacific), Middle East & Africa (UAE, Saudi Arabia, Qatar, South Africa, Rest of Middle East & Africa), Latin America (Brazil, Argentina, Rest of Latin America) |
Company Profiles | Medtronic, Insulet Corporation, Tandem Diabetes Care, Becton Dickinson and Company (BD), Novo Nordisk, Teva Pharmaceutical Industries, Propeller Health, Adherium, Vectura Group, Aptar Pharma, Ypsomed, Elcam Medical, West Pharmaceutical Services, Stevanato Group, Gerresheimer, Smiths Medical, Debiotech, Eli Lilly and Company, Phillips-Medisize, Bayer, and other players. |
Ans: The Electronic Drug Delivery Devices Market is expected to grow at a CAGR of 8.67% from 2025 to 2032.
Ans: The Electronic Drug Delivery Devices Market was USD 60.86 billion in 2024 and is expected to reach USD 117.90 billion by 2032.
Ans: Increasing Demand for Home-Based and Remote Patient Monitoring is Driving the Market Growth.
Ans: IoT can track medical conditions in real time, transmit real-time data, and provide remote control for electronic drug delivery systems, which produces advantages in treatment accuracy and patient adherence. It also enables integration with mobile applications and cloud solutions to deliver personalized therapy and interventions.
Ans: North America dominated the Electronic Drug Delivery Devices Market in 2024.
Table Of Contents
1. Introduction
1.1 Market Definition & Scope
1.2 Research Assumptions & Abbreviations
1.3 Research Methodology
2. Executive Summary
2.1 Market Snapshot
2.2 Market Absolute $ Opportunity Assessment & Y-o-Y Analysis, 2021–2032
2.3 Market Size & Forecast, By Segmentation, 2021–2032
2.3.1 Market Size By Product
2.3.2 Market Size By Application
2.3.2 Market Size By Connectivity
2.3.2 Market Size By End User
2.4 Market Share & Bps Analysis By Region, 2024
2.5 Industry Growth Scenarios – Conservative, Likely & Optimistic
2.6 Industry CxO’s Perspective
3. Market Overview
3.1 Market Dynamics
3.1.1 Drivers
3.1.2 Restraints
3.1.3 Opportunities
3.1.4 Key Market Trends
3.2 Industry PESTLE Analysis
3.3 Key Industry Forces (Porter’s) Impacting Market Growth
3.4 Industry Supply Chain Analysis
3.4.1 Raw Material Suppliers
3.4.2 Manufacturers
3.4.3 Distributors/Suppliers
3.4.4 Customers/End-Users
3.5 Industry Life Cycle Assessment
3.6 Parent Market Overview
3.7 Market Risk Assessment
4. Statistical Insights & Trends Reporting
4.1 Incidence & Prevalence (2024)
4.1.1 Global burden of non-communicable diseases (NCDs) relevant to electronic drug delivery
4.1.2 Disease-wise prevalence: Diabetes, Respiratory Diseases (Asthma/COPD), Cardiology, Oncology, Others
4.1.3 Age-stratified prevalence (pediatric, adult, geriatric)
4.1.4 Regional prevalence comparison (North America, Europe, Asia-Pacific, Latin America, Middle East & Africa)
4.2 Prescription Trends, by Region (2024)
4.2.1 Shift from conventional to electronic/connected drug delivery devices
4.2.2 Regional prescription patterns
4.2.3 Care-setting split: Hospitals & Clinics vs. Homecare vs. ASCs vs. Specialty Clinics
4.2.4 Connectivity split: Bluetooth-enabled vs. Smartphone-integrated vs. Standalone devices
4.2.5 Therapy-area mix of prescriptions (Diabetes, Respiratory, Oncology, Cardiology, Others)
4.3 Device Volume, by Region (2020–2032)
4.3.1 Historical (2020–2024) vs. forecast (2025–2032) volumes
4.3.2 Volume by product type
4.3.2.1 Smart Infusion Pumps
4.3.2.2 Smart Metered Dose Inhalers
4.3.2.3 Implantable Drug Delivery Devices
4.3.2.4 Smart Transdermal Patches
4.3.2.5 Others (Electronic Inhalers, Injectors, Wearables)
4.4 Healthcare Spending, by Region (2024)
4.4.1 Payer mix definitions: Government, Commercial, Private, Out-of-Pocket
4.4.2 Regional spending distribution by payer type
4.4.3 Spend by care setting (hospital vs. home-based care)
4.4.4 Allocation to digital health / remote patient monitoring within drug delivery budgets
4.4.5 Out-of-pocket burden & affordability analysis
4.5 Technology Adoption Trends (2020–2032)
4.5.1 Penetration of Bluetooth- and smartphone-integrated devices
4.5.2 AI- and analytics-enabled dosing, alerts, and decision support
4.5.3 IoT/cloud interoperability and data integration maturity
4.5.4 Cybersecurity & data privacy compliance trends
4.5.5 EHR/EMR integration and interoperability standards adoption
5. Electronic Drug Delivery Devices Market Segmental Analysis & Forecast, By Product, 2021 – 2032, Value (USD Billion)
5.1 Introduction
5.2 Smart Infusion Pumps (Infusion Systems)
5.2.1 Key Trends
5.2.2 Market Size & Forecast, 2021 – 2032
5.2 Non-biologic Smart Infusion Systems
5.2.1.1 Key Trends
5.2.2.2 Market Size & Forecast, 2021 – 2032
5.2.3 Biologic Smart Infusion Systems
5.2.3.1 Key Trends
5.2.3.2 Market Size & Forecast, 2021 – 2032
5.3 Smart Metered Dose Inhalers (Inhalation Devices)
5.3.1 Key Trends
5.3.2 Market Size & Forecast, 2021 – 2032
5.4 Implantable Drug Delivery Devices
5.4.1 Key Trends
5.4.2 Market Size & Forecast, 2021 – 2032
5.4.3 Biologic Implantable Drug Delivery Devices
5.4.3.1 Key Trends
5.4.3.2 Market Size & Forecast, 2021 – 2032
5.4.4 Non-biologic Implantable Drug Delivery Devices
5.4.4.1 Key Trends
5.4.4.2 Market Size & Forecast, 2021 – 2032
5.5 Smart Transdermal Patches (Transdermal Delivery Systems)
5.5.1 Key Trends
5.5.2 Market Size & Forecast, 2021 – 2032
5.6 Others
5.6.1 Key Trends
5.6.2 Market Size & Forecast, 2021 – 2032
6. Electronic Drug Delivery Devices Market Segmental Analysis & Forecast, By Application, 2021 – 2032, Value (USD Billion)
6.1 Introduction
6.2 Diabetes
6.2.1 Key Trends
6.2.2 Market Size & Forecast, 2021 – 2032
6.3 Respiratory Diseases
6.3.1 Key Trends
6.3.2 Market Size & Forecast, 2021 – 2032
6.4 Oncology
6.4.1 Key Trends
6.4.2 Market Size & Forecast, 2021 – 2032
6.5 Cardiology
6.5.1 Key Trends
6.5.2 Market Size & Forecast, 2021 – 2032
6.6 Others (Neurological Disorders, Autoimmune Diseases, Pain Management)
6.6.1 Key Trends
6.6.2 Market Size & Forecast, 2021 – 2032
7. Electronic Drug Delivery Devices Market Segmental Analysis & Forecast, By Connectivity 2021 – 2032, Value (USD Billion)
7.1 Introduction
7.2 Bluetooth-Enabled Devices
7.2.1 Key Trends
7.2.2 Market Size & Forecast, 2021 – 2032
7.3 Smartphone-Integrated Devices
7.3.1 Key Trends
7.3.2 Market Size & Forecast, 2021 – 2032
7.4 Standalone (Non-connected) Devices
7.4.1 Key Trends
7.4.2 Market Size & Forecast, 2021 – 2032
8. Electronic Drug Delivery Devices Market Segmental Analysis & Forecast, By Vertical, 2021 – 2032, Value (USD Billion)
8.1 Introduction
8.2 Hospitals & Clinics
8.2.1 Key Trends
8.2.2 Market Size & Forecast, 2021 – 2032
8.3 Homecare Settings
8.3.1 Key Trends
8.3.2 Market Size & Forecast, 2021 – 2032
8.4 Ambulatory Surgical Centers
8.4.1 Key Trends
8.4.2 Market Size & Forecast, 2021 – 2032
8.5 Specialty Clinics
8.5.1 Key Trends
8.5.2 Market Size & Forecast, 2021 – 2032
8.6 Others (e.g., Military, Long-term Care Facilities)
8.6.1 Key Trends
8.6.2 Market Size & Forecast, 2021 – 2032
9. Electronic Drug Delivery Devices Market Segmental Analysis & Forecast By Region, 2021 – 2025, Value (USD Billion)
9.1 Introduction
9.2 North America
9.2.1 Key Trends
9.2.2 Electronic Drug Delivery Devices Market Size & Forecast, By Product, 2021 – 2032
9.2.3 Electronic Drug Delivery Devices Market Size & Forecast, By Application, 2021 – 2032
9.2.4 Electronic Drug Delivery Devices Market Size & Forecast, By Connectivity, 2021 – 2032
9.2.5 Electronic Drug Delivery Devices Market Size & Forecast, By End User, 2021 – 2032
9.2.6 Electronic Drug Delivery Devices Market Size & Forecast, By Country, 2021 – 2032
9.2.6.1 USA
9.2.6.1.1 Electronic Drug Delivery Devices Market Size & Forecast, By Product, 2021 – 2032
9.2.6.1.2 Electronic Drug Delivery Devices Market Size & Forecast, By Application, 2021 – 2032
9.2.6.1.3 Electronic Drug Delivery Devices Market Size & Forecast, By Connectivity, 2021 – 2032
9.2.6.1.4 Electronic Drug Delivery Devices Market Size & Forecast, By End User, 2021 – 2032
9.2.6.2 Canada
9.2.6.2.1 Electronic Drug Delivery Devices Market Size & Forecast, By Product, 2021 – 2032
9.2.6.2.2 Electronic Drug Delivery Devices Market Size & Forecast, By Application, 2021 – 2032
9.2.6.2.3 Electronic Drug Delivery Devices Market Size & Forecast, By Connectivity, 2021 – 2032
9.2.6.2.4 Electronic Drug Delivery Devices Market Size & Forecast, By End User, 2021 – 2032
9.3 Europe
9.3.1 Key Trends
9.3.2 Electronic Drug Delivery Devices Market Size & Forecast, By Product, 2021 – 2032
9.3.3 Electronic Drug Delivery Devices Market Size & Forecast, By Application, 2021 – 2032
9.3.4 Electronic Drug Delivery Devices Market Size & Forecast, By Connectivity, 2021 – 2032
9.3.5 Electronic Drug Delivery Devices Market Size & Forecast, By End User, 2021 – 2032
9.3.6 Electronic Drug Delivery Devices Market Size & Forecast, By Country, 2021 – 2032
9.3.6.1 Germany
9.3.6.1.1 Electronic Drug Delivery Devices Market Size & Forecast, By Product, 2021 – 2032
9.3.6.1.2 Electronic Drug Delivery Devices Market Size & Forecast, By Application, 2021 – 2032
9.3.6.1.3 Electronic Drug Delivery Devices Market Size & Forecast, By Connectivity, 2021 – 2032
9.3.6.1.4 Electronic Drug Delivery Devices Market Size & Forecast, By End User, 2021 – 2032
9.3.6.2 UK
9.3.6.2.1 Electronic Drug Delivery Devices Market Size & Forecast, By Product, 2021 – 2032
9.3.6.2.2 Electronic Drug Delivery Devices Market Size & Forecast, By Application, 2021 – 2032
9.3.6.2.3 Electronic Drug Delivery Devices Market Size & Forecast, By Connectivity, 2021 – 2032
9.3.6.2.4 Electronic Drug Delivery Devices Market Size & Forecast, By End User, 2021 – 2032
9.3.6.3 France
9.3.6.3.1 Electronic Drug Delivery Devices Market Size & Forecast, By Product, 2021 – 2032
9.3.6.3.2 Electronic Drug Delivery Devices Market Size & Forecast, By Application, 2021 – 2032
9.3.6.3.3 Electronic Drug Delivery Devices Market Size & Forecast, By Connectivity, 2021 – 2032
9.3.6.3.4 Electronic Drug Delivery Devices Market Size & Forecast, By End User, 2021 – 2032
9.3.6.4 Italy
9.3.6.4.1 Electronic Drug Delivery Devices Market Size & Forecast, By Product, 2021 – 2032
9.3.6.4.2 Electronic Drug Delivery Devices Market Size & Forecast, By Application, 2021 – 2032
9.3.6.4.3 Electronic Drug Delivery Devices Market Size & Forecast, By Connectivity, 2021 – 2032
9.3.6.4.4 Electronic Drug Delivery Devices Market Size & Forecast, By End User, 2021 – 2032
9.3.6.5 Spain
9.3.6.5.1 Electronic Drug Delivery Devices Market Size & Forecast, By Product, 2021 – 2032
9.3.6.5.2 Electronic Drug Delivery Devices Market Size & Forecast, By Application, 2021 – 2032
9.3.6.5.3 Electronic Drug Delivery Devices Market Size & Forecast, By Connectivity, 2021 – 2032
9.3.6.5.4 Electronic Drug Delivery Devices Market Size & Forecast, By End User, 2021 – 2032
9.3.6.6 Russia
9.3.6.6.1 Electronic Drug Delivery Devices Market Size & Forecast, By Product, 2021 – 2032
9.3.6.6.2 Electronic Drug Delivery Devices Market Size & Forecast, By Application, 2021 – 2032
9.3.6.6.3 Electronic Drug Delivery Devices Market Size & Forecast, By Connectivity, 2021 – 2032
9.3.6.6.4 Electronic Drug Delivery Devices Market Size & Forecast, By End User, 2021 – 2032
9.3.6.7 Poland
9.3.6.7.1 Electronic Drug Delivery Devices Market Size & Forecast, By Product, 2021 – 2032
9.3.6.7.2 Electronic Drug Delivery Devices Market Size & Forecast, By Application, 2021 – 2032
9.3.6.7.3 Electronic Drug Delivery Devices Market Size & Forecast, By Connectivity, 2021 – 2032
9.3.6.7.4 Electronic Drug Delivery Devices Market Size & Forecast, By End User, 2021 – 2032
9.3.6.8 Rest of Europe
9.3.6.8.1 Electronic Drug Delivery Devices Market Size & Forecast, By Product, 2021 – 2032
9.3.6.8.2 Electronic Drug Delivery Devices Market Size & Forecast, By Application, 2021 – 2032
9.3.6.8.3 Electronic Drug Delivery Devices Market Size & Forecast, By Connectivity, 2021 – 2032
9.3.6.8.4 Electronic Drug Delivery Devices Market Size & Forecast, By End User, 2021 – 2032
9.4 Asia-Pacific
9.4.1 Key Trends
9.4.2 Electronic Drug Delivery Devices Market Size & Forecast, By Product, 2021 – 2032
9.4.3 Electronic Drug Delivery Devices Market Size & Forecast, By Application, 2021 – 2032
9.4.4 Electronic Drug Delivery Devices Market Size & Forecast, By Connectivity, 2021 – 2032
9.4.5 Electronic Drug Delivery Devices Market Size & Forecast, By End User, 2021 – 2032
9.4.6 Electronic Drug Delivery Devices Market Size & Forecast, By Country, 2021 – 2032
9.4.6.1 China
9.4.6.1.1 Electronic Drug Delivery Devices Market Size & Forecast, By Product, 2021 – 2032
9.4.6.1.2 Electronic Drug Delivery Devices Market Size & Forecast, By Application, 2021 – 2032
9.4.6.1.3 Electronic Drug Delivery Devices Market Size & Forecast, By Connectivity, 2021 – 2032
9.4.6.1.4 Electronic Drug Delivery Devices Market Size & Forecast, By End User, 2021 – 2032
9.4.6.2 India
9.4.6.2.1 Electronic Drug Delivery Devices Market Size & Forecast, By Product, 2021 – 2032
9.4.6.2.2 Electronic Drug Delivery Devices Market Size & Forecast, By Application, 2021 – 2032
9.4.6.2.3 Electronic Drug Delivery Devices Market Size & Forecast, By Connectivity, 2021 – 2032
9.4.6.2.4 Electronic Drug Delivery Devices Market Size & Forecast, By End User, 2021 – 2032
9.4.6.3 Japan
9.4.6.3.1 Electronic Drug Delivery Devices Market Size & Forecast, By Product, 2021 – 2032
9.4.6.3.2 Electronic Drug Delivery Devices Market Size & Forecast, By Application, 2021 – 2032
9.4.6.3.3 Electronic Drug Delivery Devices Market Size & Forecast, By Connectivity, 2021 – 2032
9.4.6.3.4 Electronic Drug Delivery Devices Market Size & Forecast, By End User, 2021 – 2032
9.4.6.4 South Korea
9.4.6.4.1 Electronic Drug Delivery Devices Market Size & Forecast, By Product, 2021 – 2032
9.4.6.4.2 Electronic Drug Delivery Devices Market Size & Forecast, By Application, 2021 – 2032
9.4.6.4.3 Electronic Drug Delivery Devices Market Size & Forecast, By Connectivity, 2021 – 2032
9.4.6.4.4 Electronic Drug Delivery Devices Market Size & Forecast, By End User, 2021 – 2032
9.4.6.5 Australia
9.4.6.5.1 Electronic Drug Delivery Devices Market Size & Forecast, By Product, 2021 – 2032
9.4.6.5.2 Electronic Drug Delivery Devices Market Size & Forecast, By Application, 2021 – 2032
9.4.6.5.3 Electronic Drug Delivery Devices Market Size & Forecast, By Connectivity, 2021 – 2032
9.4.6.5.4 Electronic Drug Delivery Devices Market Size & Forecast, By End User, 2021 – 2032
9.4.6.6 ASEAN Countries
9.4.6.6.1 Electronic Drug Delivery Devices Market Size & Forecast, By Product, 2021 – 2032
9.4.6.6.2 Electronic Drug Delivery Devices Market Size & Forecast, By Application, 2021 – 2032
9.4.6.6.3 Electronic Drug Delivery Devices Market Size & Forecast, By Connectivity, 2021 – 2032
9.4.6.6.4 Electronic Drug Delivery Devices Market Size & Forecast, By End User, 2021 – 2032
9.4.6.7 Rest of Asia-Pacific
9.4.6.7.1 Electronic Drug Delivery Devices Market Size & Forecast, By Product, 2021 – 2032
9.4.6.7.2 Electronic Drug Delivery Devices Market Size & Forecast, By Application, 2021 – 2032
9.4.6.7.3 Electronic Drug Delivery Devices Market Size & Forecast, By Connectivity, 2021 – 2032
9.4.6.7.4 Electronic Drug Delivery Devices Market Size & Forecast, By End User, 2021 – 2032
9.5 Latin America
9.5.1 Key Trends
9.5.2 Electronic Drug Delivery Devices Market Size & Forecast, By Product, 2021 – 2032
9.5.3 Electronic Drug Delivery Devices Market Size & Forecast, By Application, 2021 – 2032
9.5.4 Electronic Drug Delivery Devices Market Size & Forecast, By Connectivity, 2021 – 2032
9.5.5 Electronic Drug Delivery Devices Market Size & Forecast, By End User, 2021 – 2032
9.5.6 Electronic Drug Delivery Devices Market Size & Forecast, By Country, 2021 – 2032
9.5.6.1 Brazil
9.5.6.1.1 Electronic Drug Delivery Devices Market Size & Forecast, By Product, 2021 – 2032
9.5.6.1.2 Electronic Drug Delivery Devices Market Size & Forecast, By Application, 2021 – 2032
9.5.6.1.3 Electronic Drug Delivery Devices Market Size & Forecast, By Connectivity, 2021 – 2032
9.5.6.1.4 Electronic Drug Delivery Devices Market Size & Forecast, By End User, 2021 – 2032
9.5.6.2 Argentina
9.5.6.2.1 Electronic Drug Delivery Devices Market Size & Forecast, By Product, 2021 – 2032
9.5.6.2.2 Electronic Drug Delivery Devices Market Size & Forecast, By Application, 2021 – 2032
9.5.6.2.3 Electronic Drug Delivery Devices Market Size & Forecast, By Connectivity, 2021 – 2032
9.5.6.2.4 Electronic Drug Delivery Devices Market Size & Forecast, By End User, 2021 – 2032
9.5.6.3 Mexico
9.5.6.3.1 Electronic Drug Delivery Devices Market Size & Forecast, By Product, 2021 – 2032
9.5.6.3.2 Electronic Drug Delivery Devices Market Size & Forecast, By Application, 2021 – 2032
9.5.6.3.3 Electronic Drug Delivery Devices Market Size & Forecast, By Connectivity, 2021 – 2032
9.5.6.3.4 Electronic Drug Delivery Devices Market Size & Forecast, By End User, 2021 – 2032
9.5.6.4 Colombia
9.5.6.4.1 Electronic Drug Delivery Devices Market Size & Forecast, By Product, 2021 – 2032
9.5.6.4.2 Electronic Drug Delivery Devices Market Size & Forecast, By Application, 2021 – 2032
9.5.6.4.3 Electronic Drug Delivery Devices Market Size & Forecast, By Connectivity, 2021 – 2032
9.5.6.4.4 Electronic Drug Delivery Devices Market Size & Forecast, By End User, 2021 – 2032
9.5.6.5 Rest of Latin America
9.5.6.5.1 Electronic Drug Delivery Devices Market Size & Forecast, By Product, 2021 – 2032
9.5.6.5.2 Electronic Drug Delivery Devices Market Size & Forecast, By Application, 2021 – 2032
9.5.6.5.3 Electronic Drug Delivery Devices Market Size & Forecast, By Connectivity, 2021 – 2032
9.5.6.5.4 Electronic Drug Delivery Devices Market Size & Forecast, By End User, 2021 – 2032
9.6 Middle East & Africa
9.6.1 Key Trends
9.6.2 Electronic Drug Delivery Devices Market Size & Forecast, By Product, 2021 – 2032
9.6.3 Electronic Drug Delivery Devices Market Size & Forecast, By Application, 2021 – 2032
9.6.4 Electronic Drug Delivery Devices Market Size & Forecast, By Connectivity, 2021 – 2032
9.6.5 Electronic Drug Delivery Devices Market Size & Forecast, By End User, 2021 – 2032
9.6.6 Electronic Drug Delivery Devices Market Size & Forecast, By Country, 2021 – 2032
9.6.6.1 UAE
9.6.6.1.1 Electronic Drug Delivery Devices Market Size & Forecast, By Product, 2021 – 2032
9.6.6.1.2 Electronic Drug Delivery Devices Market Size & Forecast, By Application, 2021 – 2032
9.6.6.1.3 Electronic Drug Delivery Devices Market Size & Forecast, By Connectivity, 2021 – 2032
9.6.6.1.4 Electronic Drug Delivery Devices Market Size & Forecast, By End User, 2021 – 2032
9.6.6.2 Saudi Arabia
9.6.6.2.1 Electronic Drug Delivery Devices Market Size & Forecast, By Product, 2021 – 2032
9.6.6.2.2 Electronic Drug Delivery Devices Market Size & Forecast, By Application, 2021 – 2032
9.6.6.2.3 Electronic Drug Delivery Devices Market Size & Forecast, By Connectivity, 2021 – 2032
9.6.6.2.4 Electronic Drug Delivery Devices Market Size & Forecast, By End User, 2021 – 2032
9.6.6.3 Qatar
9.6.6.3.1 Electronic Drug Delivery Devices Market Size & Forecast, By Product, 2021 – 2032
9.6.6.3.2 Electronic Drug Delivery Devices Market Size & Forecast, By Application, 2021 – 2032
9.6.6.3.3 Electronic Drug Delivery Devices Market Size & Forecast, By Connectivity, 2021 – 2032
9.6.6.3.4 Electronic Drug Delivery Devices Market Size & Forecast, By End User, 2021 – 2032
9.6.6.4 Egypt
9.6.6.4.1 Electronic Drug Delivery Devices Market Size & Forecast, By Product, 2021 – 2032
9.6.6.4.2 Electronic Drug Delivery Devices Market Size & Forecast, By Application, 2021 – 2032
9.6.6.4.3 Electronic Drug Delivery Devices Market Size & Forecast, By Connectivity, 2021 – 2032
9.6.6.4.4 Electronic Drug Delivery Devices Market Size & Forecast, By End User, 2021 – 2032
9.6.6.5 South Africa
9.6.6.5.1 Electronic Drug Delivery Devices Market Size & Forecast, By Product, 2021 – 2032
9.6.6.5.2 Electronic Drug Delivery Devices Market Size & Forecast, By Application, 2021 – 2032
9.6.6.5.3 Electronic Drug Delivery Devices Market Size & Forecast, By Connectivity, 2021 – 2032
9.6.6.5.4 Electronic Drug Delivery Devices Market Size & Forecast, By End User, 2021 – 2032
9.6.6.6 Rest of Middle East & Africa
9.6.6.6.1 Electronic Drug Delivery Devices Market Size & Forecast, By Product, 2021 – 2032
9.6.6.6.2 Electronic Drug Delivery Devices Market Size & Forecast, By Application, 2021 – 2032
9.6.6.6.3 Electronic Drug Delivery Devices Market Size & Forecast, By Connectivity, 2021 – 2032
9.6.6.6.4 Electronic Drug Delivery Devices Market Size & Forecast, By End User, 2021 – 2032
10. Competitive Landscape
10.1 Key Players' Positioning
10.2 Competitive Developments
10.2.1 Key Strategies Adopted (%), By Key Players, 2024
10.2.2 Year-Wise Strategies & Development, 2021 – 2025
10.2.3 Number Of Strategies Adopted By Key Players, 2024
10.3 Market Share Analysis, 2024
10.4 Product/Service & Application Benchmarking
10.4.1 Product/Service Specifications & Features By Key Players
10.4.2 Product/Service Heatmap By Key Players
10.4.3 Application Heatmap By Key Players
10.5 Industry Start-Up & Innovation Landscape
10.6 Key Company Profiles
10.6.1 Pfizer, Inc.
10.6.1.1 Company Overview & Snapshot
10.6.1.2 Product/Service Portfolio
10.6.1.3 Key Company Financials
10.6.1.4 SWOT Analysis
10.6.2 Medtronic
10.6.2.1 Company Overview & Snapshot
10.6.2.2 Product/Service Portfolio
10.6.2.3 Key Company Financials
10.6.2.4 SWOT Analysis
10.6.3 Insulet Corporation
10.6.3.1 Company Overview & Snapshot
10.6.3.2 Product/Service Portfolio
10.6.3.3 Key Company Financials
10.6.3.4 SWOT Analysis
10.6.4 Tandem Diabetes Care
10.6.4.1 Company Overview & Snapshot
10.6.4.2 Product/Service Portfolio
10.6.4.3 Key Company Financials
10.6.4.4 SWOT Analysis
10.6.5 Becton Dickinson and Company (BD)
10.6.5.1 Company Overview & Snapshot
10.6.5.2 Product/Service Portfolio
10.6.5.3 Key Company Financials
10.6.5.4 SWOT Analysis
10.6.6 Novo Nordisk
10.6.6.1 Company Overview & Snapshot
10.6.6.2 Product/Service Portfolio
10.6.6.3 Key Company Financials
10.6.6.4 SWOT Analysis
10.6.7 Teva Pharmaceutical Industries
10.6.7.1 Company Overview & Snapshot
10.6.7.2 Product/Service Portfolio
10.6.7.3 Key Company Financials
10.6.7.4 SWOT Analysis
10.6.8 Propeller Health
10.6.8.1 Company Overview & Snapshot
10.6.8.2 Product/Service Portfolio
10.6.8.3 Key Company Financials
10.6.8.4 SWOT Analysis
10.6.9 Adherium
10.6.9.1 Company Overview & Snapshot
10.6.9.2 Product/Service Portfolio
10.6.9.3 Key Company Financials
10.6.9.4 SWOT Analysis
10.6.10 Vectura Group
10.6.10.1 Company Overview & Snapshot
10.6.10.2 Product/Service Portfolio
10.6.10.3 Key Company Financials
10.6.10.4 SWOT Analysis
10.6.11 Aptar Pharma
10.6.11.1 Company Overview & Snapshot
10.6.11.2 Product/Service Portfolio
10.6.11.3 Key Company Financials
10.6.11.4 SWOT Analysis
10.6.12 Ypsomed
10.6.12.1 Company Overview & Snapshot
10.6.12.2 Product/Service Portfolio
10.6.12.3 Key Company Financials
10.6.12.4 SWOT Analysis
10.6.13 Elcam Medical
10.6.13.1 Company Overview & Snapshot
10.6.13.2 Product/Service Portfolio
10.6.13.3 Key Company Financials
10.6.13.4 SWOT Analysis
10.6.14 West Pharmaceutical Services
10.6.14.1 Company Overview & Snapshot
10.6.14.2 Product/Service Portfolio
10.6.14.3 Key Company Financials
10.6.14.4 SWOT Analysis
10.6.15 Stevanato Group
10.6.15.1 Company Overview & Snapshot
10.6.15.2 Product/Service Portfolio
10.6.15.3 Key Company Financials
10.6.15.4 SWOT Analysis
10.6.16 Gerresheimer
10.6.16.1 Company Overview & Snapshot
10.6.16.2 Product/Service Portfolio
10.6.16.3 Key Company Financials
10.6.16.4 SWOT Analysis
10.6.17 Smiths Medical
10.6.17.1 Company Overview & Snapshot
10.6.17.2 Product/Service Portfolio
10.6.17.3 Key Company Financials
10.6.17.4 SWOT Analysis
10.6.18 Debiotech
10.6.18.1 Company Overview & Snapshot
10.6.18.2 Product/Service Portfolio
10.6.18.3 Key Company Financials
10.6.18.4 SWOT Analysis
10.6.19 Eli Lilly and Company
10.6.19.1 Company Overview & Snapshot
10.6.19.2 Product/Service Portfolio
10.6.19.3 Key Company Financials
10.6.19.4 SWOT Analysis
10.6.20 Phillips-Medisize
10.6.20.1 Company Overview & Snapshot
10.6.20.2 Product/Service Portfolio
10.6.20.3 Key Company Financials
10.6.20.4 SWOT Analysis
10.6.21 Bayer
10.6.21.1 Company Overview & Snapshot
10.6.21.2 Product/Service Portfolio
10.6.21.3 Key Company Financials
10.6.21.4 SWOT Analysis
11. Analyst Recommendations
11.1 SNS Insider Opportunity Map
11.2 Industry Low-Hanging Fruit Assessment
11.3 Market Entry & Growth Strategy
11.4 Analyst Viewpoint & Suggestions On Market Growth
12. Assumptions
13. Disclaimer
14. Appendix
14.1 List Of Tables
14.2 List Of Figures
An accurate research report requires proper strategizing as well as implementation. There are multiple factors involved in the completion of good and accurate research report and selecting the best methodology to compete the research is the toughest part. Since the research reports we provide play a crucial role in any company’s decision-making process, therefore we at SNS Insider always believe that we should choose the best method which gives us results closer to reality. This allows us to reach at a stage wherein we can provide our clients best and accurate investment to output ratio.
Each report that we prepare takes a timeframe of 350-400 business hours for production. Starting from the selection of titles through a couple of in-depth brain storming session to the final QC process before uploading our titles on our website we dedicate around 350 working hours. The titles are selected based on their current market cap and the foreseen CAGR and growth.
The 5 steps process:
Step 1: Secondary Research:
Secondary Research or Desk Research is as the name suggests is a research process wherein, we collect data through the readily available information. In this process we use various paid and unpaid databases which our team has access to and gather data through the same. This includes examining of listed companies’ annual reports, Journals, SEC filling etc. Apart from this our team has access to various associations across the globe across different industries. Lastly, we have exchange relationships with various university as well as individual libraries.
Step 2: Primary Research
When we talk about primary research, it is a type of study in which the researchers collect relevant data samples directly, rather than relying on previously collected data. This type of research is focused on gaining content specific facts that can be sued to solve specific problems. Since the collected data is fresh and first hand therefore it makes the study more accurate and genuine.
We at SNS Insider have divided Primary Research into 2 parts.
Part 1 wherein we interview the KOLs of major players as well as the upcoming ones across various geographic regions. This allows us to have their view over the market scenario and acts as an important tool to come closer to the accurate market numbers. As many as 45 paid and unpaid primary interviews are taken from both the demand and supply side of the industry to make sure we land at an accurate judgement and analysis of the market.
This step involves the triangulation of data wherein our team analyses the interview transcripts, online survey responses and observation of on filed participants. The below mentioned chart should give a better understanding of the part 1 of the primary interview.
Part 2: In this part of primary research the data collected via secondary research and the part 1 of the primary research is validated with the interviews from individual consultants and subject matter experts.
Consultants are those set of people who have at least 12 years of experience and expertise within the industry whereas Subject Matter Experts are those with at least 15 years of experience behind their back within the same space. The data with the help of two main processes i.e., FGDs (Focused Group Discussions) and IDs (Individual Discussions). This gives us a 3rd party nonbiased primary view of the market scenario making it a more dependable one while collation of the data pointers.
Step 3: Data Bank Validation
Once all the information is collected via primary and secondary sources, we run that information for data validation. At our intelligence centre our research heads track a lot of information related to the market which includes the quarterly reports, the daily stock prices, and other relevant information. Our data bank server gets updated every fortnight and that is how the information which we collected using our primary and secondary information is revalidated in real time.
Step 4: QA/QC Process
After all the data collection and validation our team does a final level of quality check and quality assurance to get rid of any unwanted or undesired mistakes. This might include but not limited to getting rid of the any typos, duplication of numbers or missing of any important information. The people involved in this process include technical content writers, research heads and graphics people. Once this process is completed the title gets uploader on our platform for our clients to read it.
Step 5: Final QC/QA Process:
This is the last process and comes when the client has ordered the study. In this process a final QA/QC is done before the study is emailed to the client. Since we believe in giving our clients a good experience of our research studies, therefore, to make sure that we do not lack at our end in any way humanly possible we do a final round of quality check and then dispatch the study to the client.
Key Segments:
By Product
By Application
By Connectivity
By End User
Request for Segment Customization as per your Business Requirement: Segment Customization Request
Regional Coverage:
North America
Europe
Asia Pacific
Middle East & Africa
Latin America
Request for Country Level Research Report: Country Level Customization Request
Available Customization
With the given market data, SNS Insider offers customization as per the company’s specific needs. The following customization options are available for the report: