Energy Recovery Ventilator Market Report Scope & Overview:
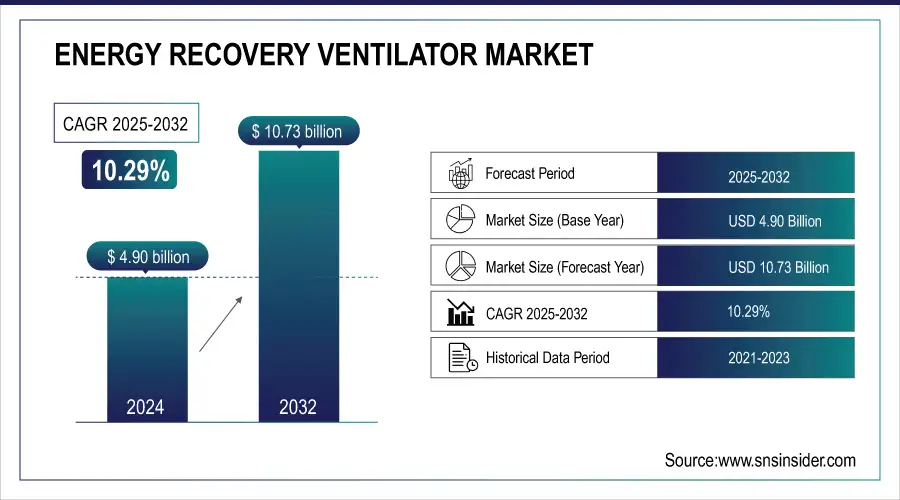
The Energy Recovery Ventilator Market size was valued at USD 4.90 Billion in 2024 and is expected to reach USD 10.73 Billion by 2032 at a CAGR of 10.29% during the forecast period of 2025-2032.
The Energy Recovery Ventilator market, while playing an increasingly significant role in improving energy efficiency within buildings, faces several challenges that limit its broader adoption. One of the main obstacles is the high initial installation cost, which can deter consumers, particularly in the residential sector. Although Energy Recovery Ventilator offer considerable long-term energy savings, the upfront investment can be a barrier, especially in markets where the financial benefits may not be immediately apparent. In commercial buildings, the capital needed for advanced Energy Recovery Ventilator systems may require additional budget allocation, posing a challenge in regions with limited financial resources. Moreover, integrating Energy Recovery Ventilator into older buildings presents another complication. Retrofitting existing HVAC systems to accommodate Energy Recovery Ventilator can be costly and complex, requiring significant infrastructure changes, which slows adoption in older buildings or low-budget projects compared to new, energy-efficient constructions.
To Get More Information on Energy Recovery Ventilator Market - Request Sample Report
Another issue impacting the Energy Recovery Ventilator market is the lack of standardized regulations across regions, which adds uncertainty to the adoption process. While some areas have implemented green building codes that encourage energy efficiency, inconsistent or limited regulatory support in other regions may restrict the widespread use of energy recovery technologies. Technologically, have made significant progress, but integrating them with other smart building systems, such as IoT-enabled HVAC, still presents compatibility and interoperability challenges. Additionally, the performance of Energy Recovery Ventilator can vary in extreme climates, with temperature fluctuations impacting their effectiveness. Despite these challenges, Energy Recovery Ventilator provide substantial benefits, such as reducing heating and cooling energy costs by up to 30% to 50%, depending on factors like system design, climate, and building type. They also improve indoor air quality by filtering up to 85% of particulate matter and achieving energy recovery efficiencies of 60% to 90%. Furthermore, around 70% of LEED-certified buildings in the U.S. incorporate Energy Recovery Ventilator as part of their sustainability initiatives, and these systems can reduce HVAC loads by 15-25%, extending system lifespans and lowering maintenance costs. In extreme climates, Energy Recovery Ventilator pre-condition incoming air, cutting heating needs by up to 50%, offering significant energy savings and operational advantages.

Key Energy Recovery Ventilator Market Trends
-
Utilization of machine-learning powered airflow calibration tools enhances system balance, minimizes inefficiencies, and extends operational lifespan.
-
Increasing preference for eco-conscious heat-exchange materials and recyclable composites supporting sustainability goals and low-emission standards.
-
Deployment of smart building twins enabling predictive fault detection, indoor climate simulations, and long-term asset optimization.
-
Advancement of compact plug-and-play ventilator modules facilitating simplified retrofitting, faster installation, and flexible building integration.
-
Growing integration of automated maintenance robotics and sensor-equipped inspection drones ensures uninterrupted functionality and reduced downtime.
| Feature | Description | Commercial Products |
|---|---|---|
| Energy Recovery Efficiency | Enables efficient recovery of energy from exhaust air, reducing overall energy consumption in HVAC systems. | Greenheck ERVs, Trane Energy Recovery Units |
| Indoor Air Quality Improvement | Enhances indoor air quality by exchanging stale indoor air with fresh outdoor air, removing contaminants and moisture. | Panasonic Intelli-Balance ERV, RenewAire EV Premium Series |
| Humidity Control | Maintains optimal humidity levels by transferring moisture between incoming and outgoing air streams. | Daikin Heat & Energy Recovery Ventilators, Broan ERV90S |
| Low Noise Operation | Ensures quiet operation suitable for residential and commercial settings, minimizing disruptions. | Mitsubishi Lossnay ERV, Fantech HERO Series |
| Scalability for Building Sizes | Offers scalability to suit various building sizes and requirements, from small residential units to large commercial systems. | LG ERV, Venmar AVS ERV |
| High Efficiency Heat Exchanger | Equipped with high-efficiency heat exchangers to maximize energy transfer between air streams. | Lennox Energy Recovery Ventilators, Zehnder ComfoAir Q |
| Energy-Saving Controls | Incorporates smart controls and sensors to optimize ventilation and reduce energy waste based on occupancy. | Carrier ERVs with Humidi-MiZer Technology, Honeywell TrueFRESH |
| Compact and Lightweight Design | Designed for easy installation in various building configurations, saving space and reducing structural load. | Aldes InspirAIR Compact ERV, S&P EC ERV |
| Compliance with Standards | Meets industry standards like ASHRAE 90.1 and ENERGY STAR® for energy efficiency and indoor air quality. | Ventacity Energy Recovery Ventilators, ERVs from Fujitsu |
| Ease of Maintenance | Features easy access for filter replacement and system maintenance, reducing operational downtime. | YORK Affinity ERV, Aprilaire Energy Recovery Ventilator |
Energy Recovery Ventilator Market Growth Drivers:
-
Growing health awareness and rising cases of respiratory issues are driving demand for energy recovery ventilators to improve indoor air quality by reducing pollutants, balancing humidity, and providing fresh air.
The growing awareness of health and the rising prevalence of respiratory issues are expected to significantly boost the Energy Recovery Ventilator (ERV) market. As air pollution and respiratory diseases like asthma, allergies, and chronic obstructive pulmonary disease (COPD) increase, the demand for clean indoor air is becoming more critical. According to research that asthma affects 262 million people globally, while COPD causes over 3 million deaths annually. This surge in respiratory issues has intensified the need for improved indoor air quality, with ERVs playing a vital role in addressing these concerns. The U.S. Environmental Protection Agency (EPA) has found that indoor air is often more polluted than outdoor air, prompting individuals and businesses to seek effective air quality solutions. ERVs are designed to filter airborne pollutants such as dust, pollen, and volatile organic compounds (VOCs), while exchanging stale indoor air for fresh outdoor air, all while conserving energy. This combination of health benefits and energy efficiency makes ERVs particularly attractive in residential and commercial spaces. Furthermore, the energy savings offered by ERVs, which can reduce heating and cooling costs by up to 30%, align with global efforts to reduce energy consumption, as buildings are responsible for a significant portion of global energy use. As the demand for cleaner air and energy-efficient solutions rises, the ERV market is set to expand, encouraging innovation and competition among manufacturers, and positioning ERVs as a sustainable choice for healthier indoor environments.
-
Modern ERV systems, with advanced features like high-efficiency energy exchange, smart sensors, and IoT compatibility, are increasingly efficient and versatile, boosting their adoption across industries.
Technological advancements in Energy Recovery Ventilator (ERV) systems are significantly enhancing their efficiency and expanding their functionality, driving greater adoption across industries. Modern ERV systems are now equipped with high-efficiency heat and moisture exchange mechanisms, which allow them to transfer energy between incoming and outgoing air streams with minimal energy loss. This feature is essential in climates where maintaining stable indoor temperatures and humidity levels is critical, helping reduce the overall load on heating, ventilation, and air conditioning (HVAC) systems.
In addition to efficient energy transfer, many of today’s ERV systems include smart sensors that monitor various environmental factors such as temperature, humidity, and air quality. These sensors allow the ERV systems to adjust ventilation rates dynamically, ensuring optimal air quality while conserving energy. Integration with the Internet of Things (IoT) enables real-time performance monitoring, allowing facility managers to track and control ERV operations remotely. This IoT connectivity also allows for predictive maintenance, where the system can alert managers about potential issues before they lead to malfunctions, reducing downtime and maintenance costs. Together, these advancements make ERV systems more attractive to a wide range of industries, particularly those focused on energy efficiency and indoor air quality. From commercial buildings to healthcare facilities, the enhanced functionality of ERVs helps meet the growing demands for sustainable, energy-efficient solutions, supporting both environmental goals and cost savings. As these technologies continue to evolve, ERVs are expected to play an even larger role in modern building systems.
Energy Recovery Ventilator Market Restraints:
-
The high upfront cost of installing ERVs can deter adoption, particularly in budget-sensitive small-scale residential and commercial buildings.
In the Energy Recovery Ventilator (ERV) market, the high upfront cost of installation remains a key challenge, particularly for budget-sensitive small-scale residential and commercial buildings. The installation of an ERV system can cost between USD 1,000 and USD 5,000, depending on the building size, complexity, and brand. This is significantly higher than more affordable ventilation solutions like exhaust fans, which typically cost under USD 500 for installation. While ERVs can reduce energy consumption by 10% to 30% in heating and cooling costs, the payback period for the initial investment is often between 3 to 7 years, which can be discouraging for smaller building owners who may not see immediate financial returns. Additionally, while ERVs help lower energy costs by consuming 25% to 50% less energy compared to traditional systems, the ongoing operational and maintenance costs can still be a concern. Furthermore, installing an ERV system in smaller buildings may require modifications to existing HVAC systems, further increasing the initial cost. These extra expenses can be a deterrent for those with limited budgets or space for significant upgrades. As a result, the high upfront costs associated with ERV systems, coupled with the delayed return on investment, make it difficult for smaller-scale residential and commercial properties to justify the expense despite the long-term energy efficiency benefits.
Energy Recovery Ventilator Market Segment Analysis
-
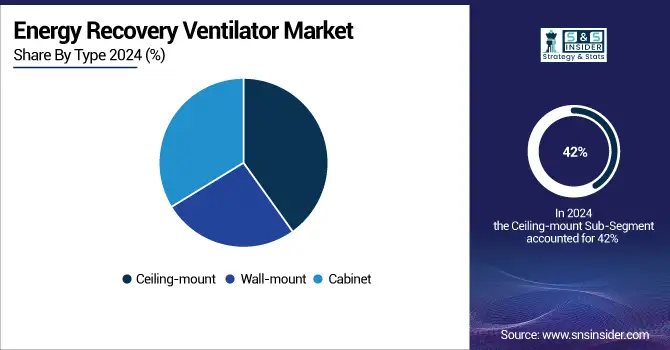
By Type
The ceiling-mount segment of the Energy Recovery Ventilator (ERV) market dominated with over 42% of the market share in 2023. This type is increasingly preferred due to its cost-effectiveness and ease of installation. Ceiling-mounted ERVs leverage existing ducting and wiring systems, reducing installation costs and minimizing the disruption typically associated with wall-mounted units. The reduced invasiveness of this installation method is a significant factor driving the demand, especially in commercial and residential buildings. Ceiling-mounted ERVs also offer better integration with building design, making them suitable for spaces with limited wall space or aesthetic considerations.
-
By Application
In 2023, the Commercial segment led the Energy Recovery Ventilator (ERV) market, capturing over 52% of the market share. This dominance is driven by the rising demand for energy-efficient solutions across commercial buildings and spaces. Commercial facilities, such as office buildings, schools, hospitals, and retail establishments, are increasingly prioritizing both energy conservation and indoor air quality. ERVs play a crucial role in maintaining a balance between energy efficiency and ventilation by recovering energy from exhausted air and transferring it to incoming fresh air. This helps reduce heating and cooling costs, making ERVs an attractive option for businesses seeking to lower operational costs while complying with sustainability standards. As building regulations become stricter and the emphasis on green building certifications like LEED grows, the demand for ERVs in the commercial sector continues to rise, supporting the segment's growth and dominance in the market.
Energy Recovery Ventilator Market Regional Analysis
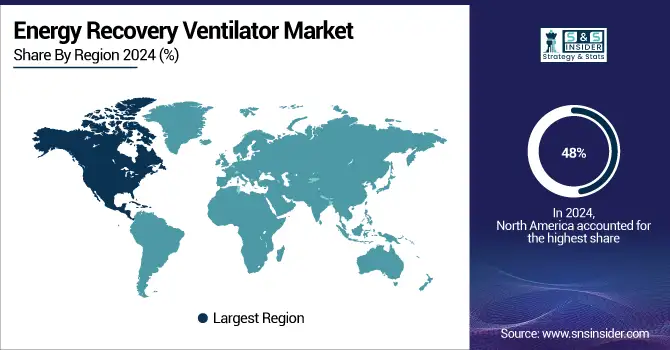
North America Energy Recovery Ventilator Market Insights
North America region dominated the market share over 48% in 2023, primarily driven by the region's strong focus on energy efficiency and enhancing indoor air quality in both residential and commercial buildings. With cities across the U.S. and Canada experiencing harsh weather conditions, including heavy snowfall, hailstorms, and hurricanes, there is a heightened need for effective ventilation solutions. These extreme climatic conditions often lead to poor indoor air quality, affecting the health and comfort of occupants. The demand for ERVs is further propelled by increasing regulations and green building initiatives aimed at reducing energy consumption. These factors combine to create a favorable environment for the growth of the ERV market in North America, as consumers and businesses look for sustainable solutions to maintain indoor air quality while improving energy efficiency.
Do You Need any Customization Research on Energy Recovery Ventilator Market - Inquire Now
Asia Pacific Energy Recovery Ventilator Market Insights
Asia Pacific region experience the highest growth rate in the Energy Recovery Ventilator (ERV) market over the forecast period. This growth is driven by rapidly improving living standards in key emerging markets like China, India, South Korea, Malaysia, and Thailand. These countries are undergoing significant urbanization and modernization, with a focus on enhancing the infrastructure of residential and commercial buildings. As energy efficiency becomes a priority in the construction industry, there is a growing adoption of technologies such as ERVs to meet both energy-saving and air quality demands.
Europe Energy Recovery Ventilator Market Insights
The Europe ERV market is witnessing steady growth, driven by stringent environmental regulations and widespread adoption of green building standards. Countries such as Germany, France, and the UK are emphasizing energy-efficient solutions to reduce carbon footprints in residential and commercial infrastructure. Increasing awareness about indoor air quality, coupled with supportive government incentives for sustainable construction, further accelerates the market adoption of ERVs across the region.
Middle East & Africa Energy Recovery Ventilator Market Insights
The Middle East & Africa (MEA) region shows moderate growth in the ERV market, fueled by rapid urbanization and extreme climatic conditions, including high temperatures and dust-prone environments. Countries like the UAE, Saudi Arabia, and South Africa are investing in advanced ventilation technologies to improve indoor comfort and meet energy efficiency targets. Government initiatives supporting sustainable building practices also encourage the integration of ERVs in new construction projects.
Latin America Energy Recovery Ventilator Market Insights
The Latin America ERV market is gradually expanding, supported by the growing construction sector and increased emphasis on energy-efficient infrastructure. Nations such as Brazil, Mexico, and Argentina are adopting modern ventilation systems to address poor air quality in urban areas and enhance building sustainability. Economic growth, coupled with rising environmental awareness and government incentives for green buildings, is contributing to the steady adoption of ERV solutions throughout the region.
Energy Recovery Ventilator Market Companies are:
-
Carrier (United Technologies) – Carrier Energy Recovery Ventilators (ERVs)
-
Johnson Controls – YORK Energy Recovery Ventilators
-
Daikin Industries, Ltd. – Daikin Heat Recovery Ventilators (HRV)
-
Mitsubishi Electric Corporation – Lossnay Energy Recovery Ventilator
-
Trane – Trane ERV Systems (Thermal and Energy Recovery Ventilators)
-
LG Electronics – LG ERV (Energy Recovery Ventilation Systems)
-
Nortek Air Solutions, LLC – Nortek ERV Units (Venmar and Broan brands)
-
Lennox International Inc. – Lennox HRV/ERV Systems
-
Greenheck – Greenheck Energy Recovery Ventilators
-
Fujitsu Limited – Fujitsu Energy Recovery Ventilators
-
Zehnder Group – Zehnder ComfoAir Energy Recovery Ventilators
-
Vent-Axia – Vent-Axia HRV (Heat Recovery Ventilators)
-
Renewaire – Renewaire ERVs and HRVs
-
Broan-NuTone LLC – Broan ERVs and HRVs
-
Airxchange, Inc. – Airxchange Energy Recovery Ventilators
-
Panasonic Corporation – Panasonic ERV (Energy Recovery Ventilation Systems)
-
Swegon – Swegon Gold and Gold RX ERVs
-
Koch Industries, Inc. – Koch Energy Recovery Ventilators
-
Daikin Applied – Daikin Applied ERV and HRV Systems
-
Robur S.p.A. – Robur Energy Recovery Systems
Competitive Landscape for Energy Recovery Ventilator Market:
Panasonic Corporation, founded in 1918 by Konosuke Matsushita, is a leading Japanese multinational conglomerate headquartered in Kadoma, Osaka, Japan. Originally established as a producer of light bulb sockets, the company has since evolved into a global leader in electronics, home appliances, automotive solutions, industrial equipment, and energy technologies. With a strong focus on innovation and sustainability, Panasonic provides solutions spanning smart homes, mobility, and clean energy. The company continues to expand its footprint across consumer electronics, B2B solutions, and eco-friendly initiatives, reinforcing its reputation as a pioneer in driving technological advancements and improving quality of life worldwide.
-
In February 2024: Panasonic has launched the WhisperComfort 60 Energy Recovery Ventilator (ERV), designed for residential construction and remodeling projects. It provides balanced ventilation with customizable airflow, using powerful DC motors and MERV 13 filters for improved indoor air quality. The ERV features a heat recovery core for energy efficiency and moisture control. It's HVI certified for sound and energy recovery, suitable for wall or ceiling installation.
| Report Attributes | Details |
|---|---|
| Market Size in 2024 | USD 4.90 Billion |
| Market Size by 2032 | USD 10.73 Billion |
| CAGR | CAGR of 10.29% From 2025 to 2032 |
| Base Year | 2024 |
| Forecast Period | 2025-2032 |
| Historical Data | 2021-2023 |
| Report Scope & Coverage | Market Size, Segments Analysis, Competitive Landscape, Regional Analysis, DROC & SWOT Analysis, Forecast Outlook |
| Key Segments | • By Type (Wall-Mount, Celling-Mount, Cabinet) • By Application (Residential, Commercial, Others (Industrial) |
| Regional Analysis/Coverage |
North America (US, Canada), Europe (Germany, France, UK, Italy, Spain, Poland, Russsia, Rest of Europe), Asia Pacific (China, India, Japan, South Korea, Australia,ASEAN Countries, Rest of Asia Pacific), Middle East & Africa (UAE, Saudi Arabia, Qatar, Egypt, South Africa, Rest of Middle East & Africa), Latin America (Brazil, Argentina, Mexico, Colombia Rest of Latin America) |
| Company Profiles | Carrier (United Technologies), Johnson Controls, Daikin Industries, Ltd., Mitsubishi Electric Corporation, Trane, LG Electronics, Nortek Air Solutions, LLC, Lennox International Inc., Greenheck, Fujitsu Limited, Zehnder Group, Vent-Axia, Renewaire, Broan-NuTone LLC, Airxchange, Inc., Panasonic Corporation, Swegon, Koch Industries, Inc., Daikin Applied, Robur S.p.A. |
Get in Touch
