Extended Reality (XR) Market Report Scope & Overview:
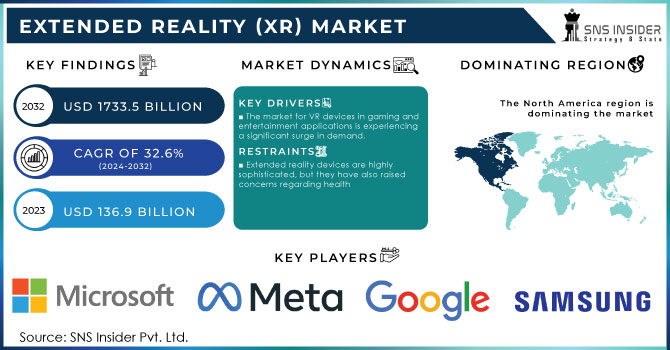
The Extended Reality (XR) Market size was valued at USD 136.9 Billion in 2023 and is expected to grow to USD 1733.5 Billion by 2032 and grow at a CAGR of 32.6 % over the forecast period of 2024-2032.
The growth of the Extended Reality market is significantly driven by the government’s measures and investments to support digital transformation. For instance, according to the recent statistics of the U.S. Department of Commerce, nearly $2 trillion was contributed by the digital economy to the U.S. GDP in 2023. As advances in immersive technologies have been realized and included in the digital economy, organizations adopting virtual reality, augmented reality, and mixed reality will become a substantial driving force for GDP growth. To support the digital economy and the next generation of technologies, the U.S. government allocated $1.2 billion under the Future Technologies Act to perform extended reality research and develop the necessary infrastructure. In Europe, $900 billion was allocated towards the XR industry in 2023 under the Digital Europe Programme to aid the efforts to contemplate XR across a wide range of applications namely, in the areas of education and training, healthcare, and manufacturing. Such measures and investments of the government create a fruitful environment for XR development and the rapid increase of adoption rates of these technologies across industries.
Moreover, various applications of XR technologies began in different sectors such as healthcare, education, and entertainment. Due to this, the governments start to allocate the funds and resources for the research and adoption of XR. The implementation of XR will allow businesses to create supportive conditions in the workplace that will be formed on the basis of the platform increasing the operating efficiency. Each year, the number of implemented XR technologies will help to decrease operational costs and boost productivity by 11-22%. The other benefit of using XR technologies is the increasing capability of organizations to use the techniques in their daily practice and offer real-world experiences to customers all over the world. It results in increased customer engagement, improved sales, and in the extent of the brand exposure.
Extended Reality (XR) Market Size and Forecast:
-
Market Size in 2023: USD 136.9 Billion
-
Market Size by 2032: USD 1,733.5 Billion
-
CAGR: 32.6% from 2024 to 2032
-
Base Year: 2023
-
Forecast Period: 2024–2032
-
Historical Data: 2021–2023
To Get More Information on Extended Reality Market - Request Sample Report
Extended Reality (XR) Market Trends:
-
Rising government investments supporting digital transformation and immersive technology development
-
Rapid adoption of VR, AR, and MR across healthcare, education, gaming, and manufacturing
-
Increasing demand for immersive training and simulation solutions in defense and aerospace
-
Growing integration of XR with AI, 5G, and cloud technologies for enhanced performance
-
Expanding use of XR to improve customer engagement, brand exposure, and operational efficiency
-
Surge in affordable VR devices accelerating consumer and enterprise adoption
Extended Reality (XR) Market Dynamics
Drivers
-
The market for VR devices in gaming and entertainment applications is experiencing a significant surge in demand.
-
Relatively inexpensive virtual reality (VR) devices are easily available.
These devices offer a glimpse into the future of gaming, with virtual reality and alternate reality games taking center stage. By utilizing XR technology, users can immerse themselves in data and analytical representations of both current and past games, tailored to their preferences. Additionally, the entertainment industry is embracing the use of VR headsets to provide viewers with a unique and captivating experience. These headsets allow users to view 3D objects from various angles, creating a truly immersive environment. Moreover, the emotional connection established between the user and the VR headset further fuels the demand for these devices in gaming and entertainment applications, ultimately driving market growth.
The availability of affordable virtual reality (VR) devices has not only resulted in a surge in the number of consumers embracing extended reality (XR) technology, but it has also fostered the creation of novel and groundbreaking XR applications. Consequently, there has been an exponential increase in XR content, encompassing an array of games, simulations, and training programs, all of which are propelling the expansion of the XR market. Moreover, the affordability of VR devices has prompted businesses to explore the utilization of XR technology across various sectors, such as healthcare, education, and entertainment. As a result, tailored XR applications have emerged, specifically designed to cater to the unique needs of these industries, thereby further fueling the growth of the XR market.
Restrains
-
Extended reality devices are highly sophisticated, but they have also raised concerns regarding health
-
High Implementation Cost Hinders Market Growth.
Extended reality (XR) technology creates virtual replicas of datasets that can be tested and shared with users. It is difficult for this approach to capture the minute features found in real-world photographs and specialist models. Providing a high-quality XR experience can be expensive, particularly when factoring in the costs of headsets and tactile sensors. This affects the overall cost of implementation and could slow the expansion of the Extended Reality (XR) business.
Opportunities
-
Extended reality (XR) technology is gaining widespread acceptance across various sectors.
Extended Reality (XR) Market Segmentation analysis
By Application
In 2023, the virtual reality segment dominated the XR market and held the largest revenue share of 54%. This dominance is primarily due to VR’s extensive adoption in such sectors as gaming, education, and training, where immersive experience is vital. Besides, as the U.S. Bureau of Economic Analysis cites, the country’s GDP depends significantly on VR-driven gaming, which constitutes 8% of the overall GDP in the entertainment and media sector. Moreover, VR is effectively used in professional training and simulation, mostly in such sectors as aerospace and defense. For these reasons, VR is extensively adopted, and its influence on the market will remain significant, although other segments’ impact will be growing as well.
The fastest CAGR growth will be demonstrated by the augmented reality segment, which is rising due to such government initiatives as those of the Innovate UK Fund, providing AR research and support of £200m focusing on the retail, automotive, and healthcare sectors. AR is oriented on the enhancement of the real world, which is why it is increasingly used in such areas as healthcare for the training of medical workers, as well as in retail for the improvement of the customer experience. Its application in real-world environments is vast and flexible, which is why AR will be demonstrating rapid growth.
By Industry Vertical
The largest share of the XR market was held by the gaming segment at 31% in 2023. VR and AR offer an immersive experience for gamers and have become more affordable due to their increasing popularity. According to the U.S. Census Bureau, in 2023, the gaming sector accumulated $140 billion in revenue, while the use of XR technologies has facilitated this growth. In addition, 5G networks have been introduced with the support of the nationwide project 5G Fast Plan from the Federal Communications Commission which ensures smooth and interactive gaming. The growing number of gaming companies employ VR and AR, and the sector has resulted to increase in the growth of the gaming segment.
The healthcare sector is projected to generate the fastest CAGR within the forecast period. The XR adoption was facilitated by government agencies, such as the National Health Service in the UK, which have introduced technologies for medical training, remote surgeries, and patient care. In 2023, the U.S. Department of Health and Human Services observed a 12% growth in the adoption of XR-based training modules in hospitals, implying the rapid increase of XR technology use in healthcare. Large investments are being made in the sector to ensure improved patient care and training.
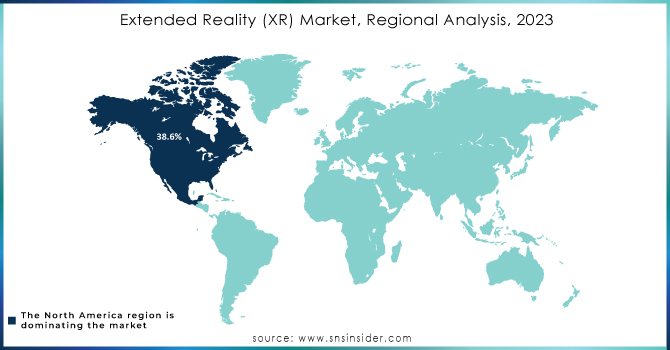
Extended Reality (XR) Market Regional Outlook
North America dominated the XR market in 2023 and held 38.6% revenue share in 2023. The region benefitted from the U.S. government, which made massive investments and favorable regulations for the tech industry to flourish. The U.S. Department of Commerce acknowledges that government support in digital infrastructure and the adoption of XR in education, defense, and health have been instrumental. Additionally, the increase in tech establishment in North America such as Microsoft and Meta, and other companies have invested in the development of XR technologies sets the region ahead of others. The region’s market also benefited from high consumer acceptance of immersive technologies and a recent report by the Federal Communications Commission shows that 5G has expanded in North America with 99.7% of the U.S population already connected. The FCC 2023 report also showed that 67.6% of U.S. households have access to high-speed internet, a precondition for XR devices – specifically VR and AR – to function. The availability of super digital infrastructure in North America and the increase in support for futuristic technologies give the region a head start in the XR market.
Meanwhile, the Asia Pacific region is expected to experience the highest compound annual growth rate (CAGR) during the forecast period. The increasing adoption of Artificial Intelligence (AI), Augmented Reality (AR), Virtual Reality (VR), and Big Data technologies in industries such as retail, e-commerce, and entertainment is driving the creation of fully virtual environments for users. This trend is anticipated to drive the demand for XR technology in the Asia Pacific region in the coming years. For instance, XROM, a Mumbai-based extended reality company, reports that India alone is home to 2,000 AR/VR startups, which will contribute significantly to the economic growth of this market in the near future.
Do You Need any Customization Research on Extended Reality Market - Inquire Now
Latest News in the XR Market
-
In July 2024, Meta presented its new XR lab with the Department of Defense, focusing on creating faithful training modules for the military. The technology giant invests $400 million in the project. The company’s long-term goal is to make use of XR not simply in the realm of consumers but to extend its capacities to the spheres where stakes are higher, such as defense and healthcare.
-
Apple announced in March 2024 that it had secured $500 million in funding from the National Science Foundation to accelerate the development of its AR glasses. The funding is part of a government initiative to promote innovation in wearable technology. Apple's AR glasses are expected to revolutionize sectors like retail, healthcare, and logistics by providing seamless integration with real-world tasks.
-
In February 2023, OnePlus announced a groundbreaking partnership with Qualcomm to introduce the Snapdragon Spaces extended reality feature to their highly anticipated OnePlus 11 5G smartphone. This collaboration seeks to empower developers in constructing a seamless and user-friendly XR ecosystem. The ultimate goal of this partnership is to offer OnePlus users an unparalleled digital experience, allowing them to immerse themselves in the world of movies and live concerts, while also enabling the delivery of immersive gaming experiences.
-
In February 2023, Sony Group Corporation introduced the highly anticipated PlayStation VR2 and PlayStation VR2 Sense Controller Charging Station, revolutionizing the gaming experience. The PS VR2 boasts cutting-edge features such as immersive headset feedback, precise eye tracking, captivating 3D audio, and the innovative adaptive triggers and haptic feedback from the PS VR2 Sense controllers.
-
In January 2023, HTC Corporation unveiled its latest consumer flagship, the VIVE XR Elite, an all-in-one marvel. This compact and lightweight headset combines the power and versatility of mixed reality (MR) and virtual reality (VR) technologies, making it the ultimate choice for a wide range of activities including gaming, productivity, fitness, and more.
Key Players
-
Microsoft Corporation (HoloLens, Dynamics 365 Remote Assist)
-
Meta Platforms, Inc. (Oculus Quest 2, Horizon Workrooms)
-
Google LLC (Google Glass Enterprise Edition, ARCore)
-
Sony Corporation (PlayStation VR, SmartEyeglass)
-
Apple Inc. (Apple Vision Pro, ARKit)
-
HTC Corporation (VIVE Pro, VIVE Focus 3)
-
Samsung Electronics Co., Ltd. (Gear VR, AR Emoji)
-
Qualcomm Technologies, Inc. (Snapdragon XR2, Vuforia)
-
Magic Leap, Inc. (Magic Leap 1, Magic Leap 2)
-
Lenovo Group Ltd. (ThinkReality A3, Mirage AR)
-
Unity Technologies (Unity AR Foundation, Unity Reflect)
-
Pico Interactive, Inc. (Pico Neo 3, Pico G2 4K)
-
Vuzix Corporation (Vuzix Blade, Vuzix M400)
-
HP Inc. (HP Reverb G2, HP Omnicept)
-
EON Reality, Inc. (EON-XR, AVR Platform)
-
Dassault Systèmes (3DEXPERIENCE, DELMIA VR)
-
Atheer, Inc. (Atheer AR Platform, AiR Enterprise)
-
Barco (Barco F80, Barco CAVE)
-
Varjo Technologies (Varjo XR-3, Varjo Aero)
-
zSpace, Inc. (zSpace Inspire, zSpace Studio) and other players
| Report Attributes | Details |
| Market Size in 2023 | USD 136.9 Billion |
| Market Size by 2032 | USD 1733.5 Billion |
| CAGR | CAGR of 32.6% From 2024 to 2032 |
| Base Year | 2023 |
| Forecast Period | 2024-2032 |
| Historical Data | 2020-2022 |
| Report Scope & Coverage | Market Size, Segments Analysis, Competitive Landscape, Regional Analysis, DROC & SWOT Analysis, Forecast Outlook |
| Key Segments | • By Component (Hardware, Software, Services) • By Application (Augmented Reality (AR), Virtual Reality (VR), Mixed Reality (MR)) • By Enterprise Size (Large Enterprises, Small & Medium Enterprises) • By Industry Vertical (Aerospace & Defense, Manufacturing, Automotive, Education, Media & Entertainment, Gaming, Healthcare, Retail & E-commerce) |
| Regional Analysis/Coverage | North America (US, Canada, Mexico), Europe (Eastern Europe [Poland, Romania, Hungary, Turkey, Rest of Eastern Europe] Western Europe] Germany, France, UK, Italy, Spain, Netherlands, Switzerland, Austria, Rest of Western Europe]), Asia Pacific (China, India, Japan, South Korea, Vietnam, Singapore, Australia, Rest of Asia Pacific), Middle East & Africa (Middle East [UAE, Egypt, Saudi Arabia, Qatar, Rest of Middle East], Africa [Nigeria, South Africa, Rest of Africa], Latin America (Brazil, Argentina, Colombia Rest of Latin America) |
| Company Profiles | Microsoft Corporation, Meta Platforms, Inc., Google LLC, Sony Corporation, Apple Inc., HTC Corporation, Samsung Electronics Co., Ltd., Qualcomm Technologies, Inc., Magic Leap, Inc., Lenovo Group Ltd., Unity Technologies, Pico Interactive, Inc., Vuzix Corporation, HP Inc., EON Reality, Inc. |
Frequently Asked Questions
The North American region dominated the Extended Reality (XR) Market in 2023.
Yes, you can customize the report as per your requirements.
The Extended Reality (XR) Market size was valued at USD 136.9 Billion in 2023.
The Extended Reality (XR) Market is to grow at CAGR of 32.6% Over the Forecast Period of 2024-2032.
The Major players are Microsoft Corporation, Meta Platforms, Inc., Google LLC, Sony Corporation, Apple Inc., HTC Corporation, Samsung Electronics Co., Ltd etc.
Get in Touch
