Failure Analysis Test Equipment Market Report Scope & Overview:
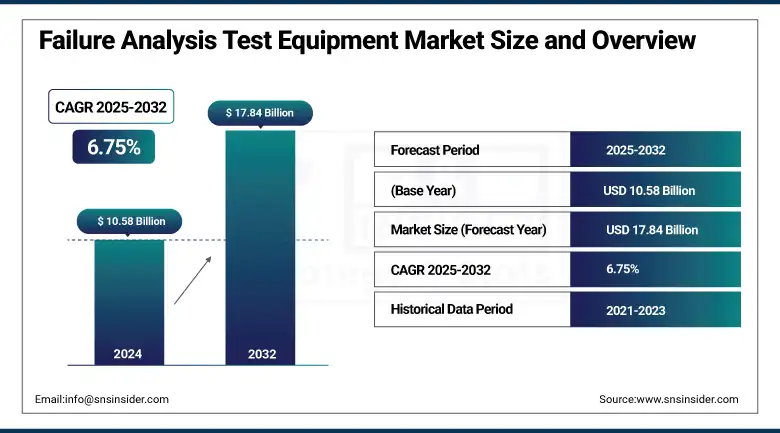
The Failure Analysis Test Equipment Market size was valued at USD 10.58 billion in 2024 and is expected to reach USD 17.84 billion by 2032, growing at a CAGR of 6.75% over the forecast period of 2025-2032.
The failure analysis test equipment market, or Failure analysis equipment market or defect analysis equipment market, is one of the ancillary markets for quality control and reliability assessment that plays a key role in various industries, such as semiconductor, aerospace, automotive, and manufacturing industries. The market in this consists of advanced tools and systems to detect, analyze, and understand materials or component failures. Some of the common technologies in this area include SEM, FIB, EDX, and X-ray inspection systems. The consistent need for defect-free products and high-performance electronic devices, and the miniaturization and complexity of electronics, is anticipated to drive the growth of the failure analysis test equipment industry over the forecast period.
To Get more information On Failure Analysis Test Equipment Market - Request Free Sample Report
The need for operational efficiency and reliability in a digital product has compelled many organizations to adopt a failure analysis tool to avert expensive recalls while enhancing product design and development. Advances in fundamental material science and nanotechnology are also accelerating the progress towards new, faster, and automated analysis systems. The role of the industry is pivotal in supporting research & development, quality assurance & lifecycle management. In this report, the Failure Analysis Test Equipment market growth is expected to be driven by the increasing demand for accuracy in defect identification and in-depth defect analysis capability.
For instance, Thermo Fisher Scientific Inc., headquartered in Waltham, Massachusetts, is a global leader in scientific solutions. It offers a broad range of analytical instruments, lab equipment, and reagents for industries including healthcare, life sciences, and forensics. The company also provides advanced tools for applications like optical and thermal fault isolation and TEM imaging.
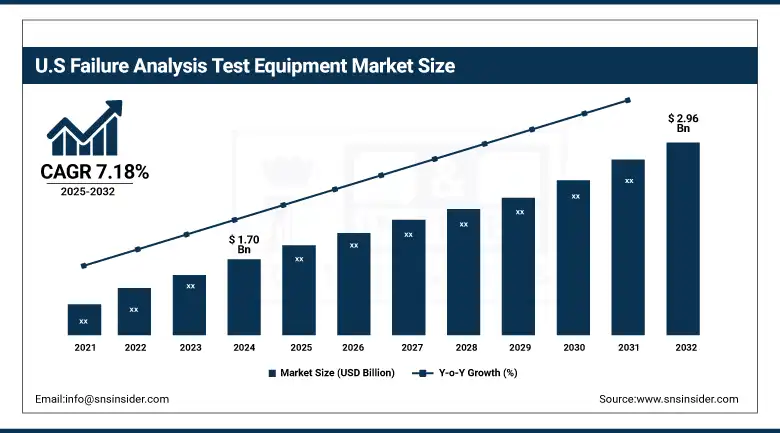
The U.S. failure analysis test equipment market is projected to grow from USD 1.70 billion in 2024 to USD 2.96 billion by 2032, at a CAGR of 7.18%. Strong demand for high-tech components for the semiconductor, aerospace, and automotive industries is fueling growth. Ongoing investments in research and development (R&D) and regulatory compliance serve to further propel the market.
Failure Analysis Test Equipment Market Dynamics:
Drivers:
- Industries Drive Quality and Safety Focus with Advanced Failure Analysis Equipment to Enhance Product Reliability and Regulatory Compliance
The increasing focus on product reliability and safety in industries, such as aerospace, automotive, and electronics, manufacturers are investing heavily in failure analysis equipment to reduce defects and meet strict quality standards. The growing focus on quality assurance stems from the need to comply with regulations, minimize product recalls, and preserve customer confidence. In this regard, advanced analytical tools such as non-destructive testing (NDT) and scanning acoustic microscopy (SAM) become an essential part of critical applications where even the slightest defect can jeopardize component integrity. For instance,, the implementation of SAM in semiconductor production has improved detection of subsurface defects, resulting in enhanced reliability of products. These investments not only enhance product quality, but also position the company competitively in markets with high precision and safety requirements.
In May 2025: Boeing announced it would maintain 737 MAX production at 38 jets per month, reflecting progress in improving its quality and safety culture. This move follows FAA restrictions after a panel blowout incident in January 2024. The company has adopted machine learning for supply chain monitoring and saw a 220% rise in employee safety reports. Boeing also plans to add a fourth production line once it meets stability goals.
Restraint
- High Costs and Training Needs Limit SMEs' Adoption of Advanced Failure Analysis Tools.
This initial investment along with the recurring cost of maintenance, if necessary, of advanced failure analysis test equipment demand it to be one of the biggest challenges, especially with small and medium-sized enterprises (SMEs). Modern devices like scanning electron microscopes (SEM), transmission electron microscopes (TEM) and focused ion beam (FIB) systems from USD 25,000 to above USD 2 million. Maintenance cost per year of these machines’ ranges from USD 15,000 to USD 100,000. The high costs usually require organizations to seek out alternative funding sources, meaning that groups with limited budgets have limited access. Additionally, servicing and translating findings from these high-powered instruments needs skilled training, further raising operational costs. This can make it hard for SMEs to justify the return on investment (ROI) and so limit the adoption of these basic quality assurance and product reliability tools.
Failure Analysis Test Equipment Market Segmentation Outlook:
By Product
The Scanning Electron Microscope (SEM) segment dominated the market and accounted for 42% of the Failure Analysis Test Equipment market share. The scanning electron microscopy (SEM) is one of the most successful techniques owing to its high-resolution imaging, surface morphology, and elemental composition capabilities, thus making SEM indispensable to electronics, material science, and forensics. They have gained a strong foothold in the market due to their widespread usage in both academic and industrial research. Their simple sample preparation and fast imaging also make them attractive for quality assurance and failure analysis in the semiconductor and other manufacturing sectors.
Transmission Electron Microscopes (TEMs) are projected to be the fastest-growing product segment in the Failure Analysis Test Equipment market driven by their capacity to provide atomic-level ultra-high-resolution imaging that makes them perfectly suited for the analysis of nanoscale structural defects, the crystallography of materials. Demand for high-resolution failure analysis tools, such as Transmission Electron Microscopes (TEMs) is evolving at an accelerated pace, as technological advancements continue to push the envelope of nanoscale manufacturing, especially in electronics and materials systems. Pooling this growth is R&D investments and the rising complexity of microelectronic components that can demand insight into failure diagnostics that is deeper and needs to be broader.
By Technology
The Energy Dispersive X-Ray Spectroscopy (EDX) dominated the technology segment with a 32% market share. Another common technique for elemental analysis used in conjunction with SEMs is EDX, which enable rapid and precise identification of the matrix and contaminants within the material. This led to an even wider spread of multiple scales of electronic, metallurgical, and manufacturing failure analysis processes where its use is integrated within the standard protocols. Its non-destructive method and ability to detect small defects and contaminants make it an important diagnostic tool for failures. Combining high reliability with broad utility, EDX has been an analytical workhorse, maintaining its segment-leading position.
Scanning Probe Microscopes (SPMs) are witnessing the fastest growth in the failure analysis test equipment market due to their unparalleled resolution and surface analysis capabilities at the nanoscale. Scanning probe microscopes (SPMs), such as atomic force microscopes (AFM), are indispensable tools for assessing surface characteristics that include roughness, adhesion, and elasticity in emerging materials and devices. This is in demand as the need for precision in nanotechnology applications in research and development increases. In addition, the flexibility (SPM) can be worked in vacuum, air, or in liquid of SPM also contributes to its fast progress in application to academic research and in industrial QC.
By Application
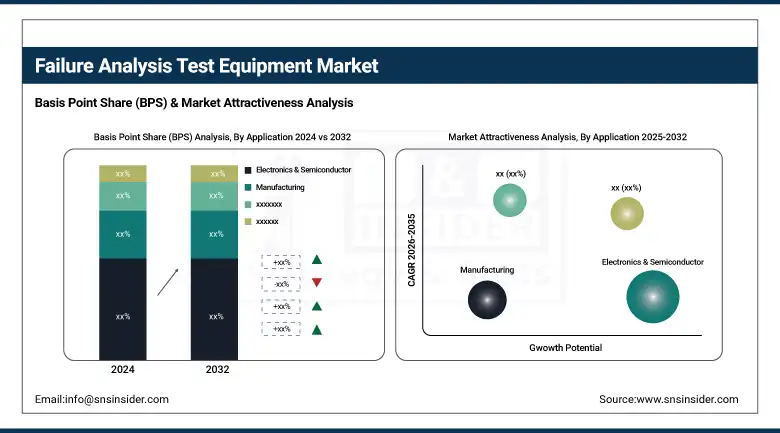
The Electronics & Semiconductor segment emerged as the dominant application area in 2024, contributing 38% of the Failure Analysis Test Equipment market share. As electronic components become increasingly miniaturized, and the complexity of semiconductor devices increases, the demand for advanced failure analysis techniques has also grown. These tools are used for quality control and defect detection and test and reliability of high-performance electronics in manufacturing and OEM. As frequent new launches, higher chip density and industry standards are making failure diagnostic accuracy mandatory, this segment is expected to continue leading etching equipment market. In addition, the fast innovation cycles in electronics turn failure analysis into a key element of the product development lifecycle.
The manufacturing segment is anticipated to be the fastest-growing in the failure analysis test equipment market. With the growing implementation of advanced manufacturing techniques and automated systems across industries, the failure complexities due to all these changes are constantly increasing. In automotive, aerospace, and heavy machinery, manufacturers are investing in failure analysis tools to improve reliability, accelerate uptime, and maintain rigorous quality standards. With the boom in smart manufacturing and Industry 4.0, there is an even greater demand for real-time defect analysis and root cause identification. The growing focus on improving operational efficiency and quality assurance is driving growth in the manufacturing application segment.
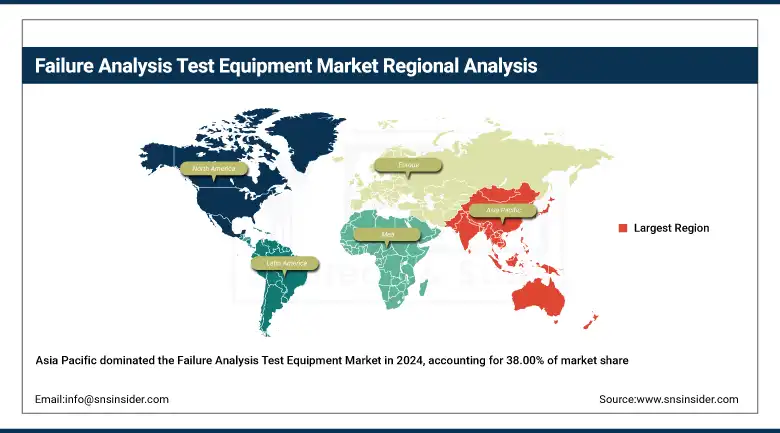
Failure Analysis Test Equipment Market Regional Analysis:
Asia-Pacific holds the largest share in the Failure Analysis Test Equipment Market, accounting for approximately 38.00% of the global market. The regional distribution of the global electronics and semiconductor manufacturing ecosystem explains its root cause, especially in China, Japan, South Korea, and Taiwan, where electronics and semiconductor manufacturing have flourished. This increase is driven by rapid industrialization, the automotive and aerospace sectors, along with increasing demand for quality control and product reliability. Moreover, high levels of continued investment in research and development and government policies promoting technology development will result in the region remaining the global leader in this market.
Get Customized Report as per Your Business Requirement - Enquiry Now
China is both the dominant and fastest-growing country in the Asia-Pacific Failure Analysis Test Equipment market. It mainly owes its stable growth to its strong electronic and semiconductor sectors that heavily depend on tools, such as scanning electron microscopes (SEM) and focused ion beam (FIB) systems. This growth is fuelled by factors such as strategic initiatives such as “Made in China 2025” and an emphasis on automation and quality.
North America is emerging as the fastest-growing region in the Failure Analysis Test Equipment Market. The technological advancements and increasing emphasis on innovation across industries are primarily driving the growth. Market expansion is being propelled by the rising demand for semiconductor failure analysis due to the growing electronics and microelectronics industry end-user segments. Moreover, the regional growth is aided by the rising use of failure analysis tools within the aerospace and defense industries, where accuracy and reliability are of utmost importance. Government backing for advanced manufacturing, coupled with the presence of vital market players, boosts North America as a high-growth region further.
Europe holds a significant share in the Failure Analysis Test Equipment Market, primarily owing to the established automotive, electronics market in the region. The presence of a number of leading manufacturers in the region investing significantly in advanced testing technologies used for measuring the reliability and safety of a product will drive market growth. Moreover, the demand for accurate failure analysis tools is propelled by strict regulatory standards and quality control regulations in various sectors, including aerospace, defense, and medical devices. Europe is further underpinned by continual innovation, married to government investment in R&D. These are some of the factors that keep the region growing and the market larger.
Key players in Failure Analysis Test Equipment Market are:
Thermo Fisher Scientific Inc., Stress Engineering Services, Inc., Hitachi High-Technologies Corporation, CARL Zeiss SMT GmbH, Leica Microsystems, HORIBA, Ltd., Oxford Instruments, Bruker, Tescan Orsay Holding, and A&D Company Ltd.
Recent Development
In July 2024: Oxford Instruments participated in the 31st International Symposium on the Physical and Failure Analysis of Integrated Circuits (IPFA 2024) held at Marina Bay Sands, Singapore. At Booth A4, the company showcased its Cypher AFM system, highlighting its capabilities in failure analysis and device characterization.
In May 2025: Thermo Fisher Scientific lowered its revenue and earnings forecasts by USD 500 million and USD 0.30 per share, respectively, citing growing uncertainty surrounding U.S. scientific research funding and recent policy changes at the National Institutes of Health (NIH).
In March 2025: Hitachi High-Tech Corporation announced the merger of its Hitachi High-Tech Analytical Science Ltd. and Hitachi High-Tech Science Corporation into a single entity, Hitachi High-Tech Analysis Corporation. This reorganization is designed to enhance its analytical business capabilities and better tackle the complexities involved in material development and inspection processes.
| Report Attributes | Details |
|---|---|
| Market Size in 2024 | USD 10.58 Billion |
| Market Size by 2032 | USD 17.84 Billion |
| CAGR | CAGR of 6.75% From 2025 to 2032 |
| Base Year | 2024 |
| Forecast Period | 2025-2032 |
| Historical Data | 2021-2023 |
| Report Scope & Coverage | Market Size, Segments Analysis, Competitive Landscape, Regional Analysis, DROC & SWOT Analysis, Forecast Outlook |
| Key Segments | • By Product (Scanning Electron Microscope (SEM), Transmission Electron Microscope (TEM), Focused Ion Beam System (FIB), Dual Beam System, Others) • By Technology (Energy Dispersive X-Ray Spectroscopy (EDX), Secondary Ion Mass Spectroscopy (SIMS), Focused Ion Beam (FIB), Broad Ion Milling (BIM), Relative Ion Etching (RIE), Scanning Probe Microscope (SPM), Others) • By Application (Electronics & Semiconductor, Oil and Gas, Defense, Manufacturing, Construction, Others) |
| Regional Analysis/Coverage | North America (US, Canada, Mexico), Europe (Germany, France, UK, Italy, Spain, Poland, Turkey, Rest of Europe), Asia Pacific (China, India, Japan, South Korea, Singapore, Australia, Rest of Asia Pacific), Middle East & Africa (UAE, Saudi Arabia, Qatar, South Africa, Rest of Middle East & Africa), Latin America (Brazil, Argentina, Rest of Latin America) |
| Company Profiles | Thermo Fisher Scientific Inc., Stress Engineering Services, Inc., Hitachi High-Technologies Corporation, CARL Zeiss SMT GmbH, Leica Microsystems, HORIBA, Ltd., Oxford Instruments, Bruker, Tescan Orsay Holding, A&D Company Ltd. |
Frequently Asked Questions
Ans: The Asia-Pacific region dominated the Failure Analysis Test Equipment market in 2024.
Ans: The “Scanning Electron Microscope (SEM)” segment dominated the Failure Analysis Test Equipment market.
Ans: Industries Drive Quality and Safety Focus with Advanced Failure Analysis Equipment to Enhance Product Reliability and Regulatory Compliance.
Ans: The Failure Analysis Test Equipment market was USD 10.58 billion in 2024 and is expected to reach USD 17.84 billion by 2032.
Ans: The Failure Analysis Test Equipment market is expected to grow at a CAGR of 6.75% from 2025-2032.
Get in Touch
