Fitness Apps Market Size & Trends:
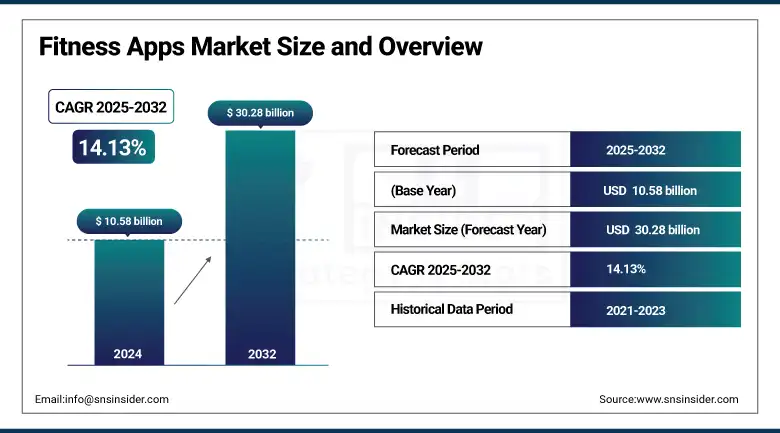
The Fitness Apps Market size was valued at USD 10.58 billion in 2024 and is expected to reach USD 30.28 billion by 2032, growing at a CAGR of 14.13% over the forecast period of 2025-2032.
Rapid growth in health awareness, rising smartphone penetration, and the global digital wellness trend are driving the global fitness apps market. Fitness apps are used by users for planning an exercise, tracking food, and monitoring exercise, and are largely used in conjunction with some sort of wearable technology. With expanded customized training, AI-powered training, and gamified user experiences, engagement is even higher. The post-pandemic boom in demand for home exercise equipment drove app installation in all age brackets and bolstered long-term fitness apps market growth.
To Get more information On Fitness Apps Market - Request Free Sample Report
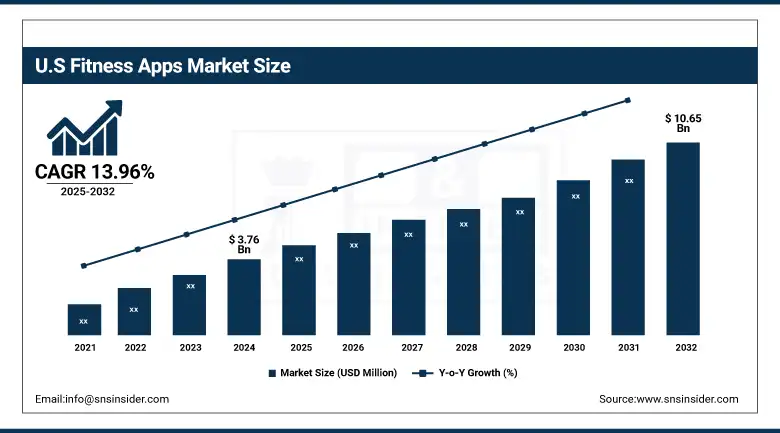
The U.S. fitness apps market size was valued at USD 3.76 billion in 2024 and is expected to reach USD 10.65 billion by 2032, growing at a CAGR of 13.96% over the forecast period of 2025-2032.
The U.S. is the leading North American country in the fitness apps market trend due to high adoption of smartphones and wearable devices, a strong online fitness culture, and availability of large app developers such as Fitbit, MyFitnessPal, Nike, and Peloton. India's focus on personalized health and wellness solutions drives the high uptake across a variety of user bases with innovation at its very core.
Fitness Apps Market Dynamics:
Drivers
-
Increasing Awareness of Health and Fitness is Fueling Market Growth
One of the major reasons driving the growth of the fitness apps market is the rising awareness of the public about a healthy life. As the public consciousness around conditions such as obesity, stress, and chronic illness rises, so too does emphasis on regular exercise, healthy meal choices, and mental health. For the consumer, fitness apps provide convenient tools to set health goals, track progress, and receive motivating workouts and nutrition guidance all from the palm of their hands.
The apps have benefited fitness app users, 66% of whom say they've helped the user's mental health, and fitness app users 79% of whom say they're more active since using them.
Research at Harvard University backs hot fad, albeit a well-established fad, and a sign of widening interest in no-cost, low-impact fitness.
-
Rise in Smartphone and Internet Penetration is Driving the Market Growth
The growth in fitness app usage has been primarily driven by the increasing penetration of affordable smartphones and the growth of the internet, especially in emerging economies. Possibly due to this widespread access to fitness apps, the vast majority of adults now own a smartphone. No matter if it be in the city or in the boonies, users can download and use apps for exercise tracking, food logging, or guided routines with no need for special equipment. Profound levels of devices cater to a massive and surging market for fitness service providers and app developers.
With over 200,000 fitness and health apps in existence globally, the ecosystem is enabled by smartphones.
Restraint
-
User Retention Challenges are Hampering the Market Growth
The long-term engagement of users is one important limitation of the fitness apps space. Most apps get a lot of one-time downloads, especially around New Year or during the latest post-pandemic health frenzy, but retention in the long run is often weak. They lose users due to insufficient continuous motivation in the long run, monotonous content, or a one-size-fits-all approach that stops progressing with the changing fitness needs of the user. Moreover, if the app UI is not appealing or fails to emulate users' devices and habits, lacks personalization, it also leads to churn. Owners struggle to retain subscription revenue and customers due to the high churn rate, making them continue to spend on updates, features, and engagement strategies just to stay alive.
Fitness Apps Market Segmentation Analysis:
By Type
The exercise & weight loss segment accounted for the largest fitness apps market share in 2024, with 59.2%, on account of it being the most preferred type among people who wanted to maintain their weight, gain strength, and remain physically active. These Apps offer professional exercise programs, personalized workout plans, and guided video sessions to make exercise convenient, efficient, and accessible. This growing focus on health and attractiveness, and the post-pandemic growth in home fitness routines, can be seen as a further stimulus for users. Additionally, the features of social elements and gamification in many of these apps help to keep users motivated and engaged, and help maintain their large market share.
The activity tracking segment is projected to grow at the fastest rate forecast years, driven by the rapid adoption of wearable technology and demand for real-time tracking of health. Users want apps that can integrate with smartwatches and fitness bands to track steps, calories burned, heart rate, and sleep. With people now more proactive than ever about ensuring their holistic health and preventive health care, activity tracking apps provide continuous feedback and awareness that remind them to remain on par. Since this information is real-time and has AI-based capabilities, this segment will grow at a high scale.
By Platform
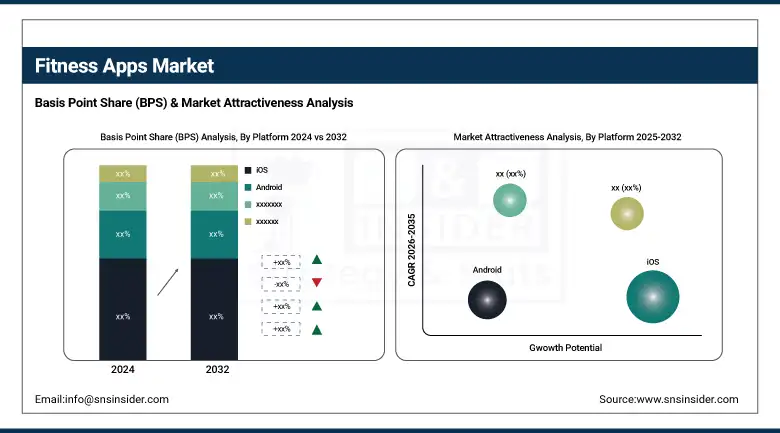
The iOS segment accounted for a market share of 71.25% in the fitness apps market in 2024, in large part due to the high spending power of Apple consumers and the high health-tech interest of Apple consumers. Developers gain more income, as iOS users have a tendency to pay for premium subscriptions and in-app purchases more readily. Also, the iOS fitness apps can easily integrate with Apple Health and Apple Watch, which enhances the experience, allowing the user to track workouts, heart rate, and daily activity in a single ecosystem. Moreover, the platform is known for its credibility and ease of use, which leads to high user retention in health and wellness apps.
Due to Android expanding its reach globally, especially in developing regions, the Android segment is projected to be the fastest-growing segment during the forecast period. With the wide range of affordable Android devices that support it, it makes fitness apps much more affordable to the general population. As Android has such a huge user base, developers are now optimizing applications for Android. With increased health awareness in emerging markets, Android-based fitness applications, most of them with freemium business models, are seeing a soaring number of downloads and use, putting Android on a path for steady growth.
By Device
The smartphones segment held the largest fitness apps market share in 2024 with 63.26%, as the smartphone is the most widely used device via which the digital health and fitness solutions are accessed. Their portability, computational capability, and connection to sensors such as GPS and accelerometers make them suitable for running fitness applications to track workouts, steps, and nutrition. The availability of health-related applications throughout app stores and the convenience of utilizing one device for multiple health-related purposes have also contributed to smartphones being a suitable choice for fitness application usage.
Real-time health monitoring and personalized fitness tracking have increased consumer attention toward wearable devices, which will witness the highest growth in the wearable segment during the forecast period. Smartwatches and fitness bands have become fully-fledged now with advanced sensors tracking heart rate, sleep, oxygen, body temperature, etc., making their connected fitness applications more functional. With a demand for on-demand health insight and a seamless interaction, wearables transition into being everyday wellness management devices. Improved affordable pricing, great battery life, and chic appearance have spurred wider adoption, in particular with the health-fitness-focused and technology-friendly buyer.
Fitness Apps Market Regional Insights:
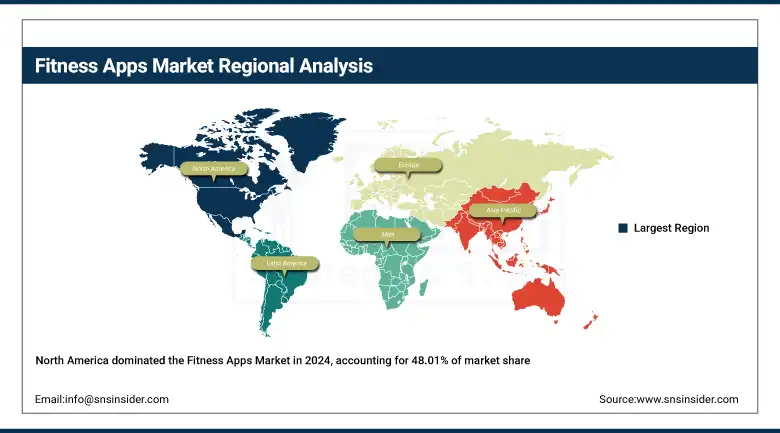
In 2024, North America is the largest fitness apps market at a 48.01% share, owing to a high penetration of smartphones and wearable devices, an advanced digital infrastructure, and more attention paid to preventive care. In North America, the presence of leading fitness app providers and an early mover advantage as far as adopting new technologies, including the likes of AI, real-time health monitoring, and tailored workout routines, is the primary factor keeping the region at the forefront of our fitness apps market. Moreover, an increasing focus on mental and physical wellness and the expansion of online health platforms will also support greater consumption amongst different user segments.
Get Customized Report as per Your Business Requirement - Enquiry Now
The Asia Pacific region is expected to be the fastest-growing in the fitness apps market analysis, with a CAGR of 15.14% during the forecast period, influenced by rapid urbanization, an increasing focus on health and wellness, and increasing smartphone penetration in developing countries such as India, China, and Southeast Asia. Market growth is driven by favorable government policies supporting digital health and an ever-increasing target population eager to adopt mobile-based wellness tools. Localized fitness content popularity, support for regional wearables, and rising need for a low-cost subscription model are among other key factors nurturing market expansion in this fast-paced and transforming region.
Europe has produced considerable growth in the fitness apps market, driven by rising health awareness, the penetration of smartphones, and robust digital infrastructure. Policymakers of governments and public health organizations encouraging preventive healthcare have inspired people to access mobility-related apps concerning fitness, diet, and wellness. Furthermore, the increased focus on mental wellbeing across the region, demand for personalized training, and lifestyle tracking has further kept it in vogue for app-driven fitness services. And at the cutting edge of this digital health revolution are the UK, Germany, and France.
Raising adoption of technology, penetration of smartphones, and increasing health consciousness are driving the market in Latin America gradually. This is due to a huge number of the urban populace in the nation are presently turning to home-based wellness applications for working out and weight reduction.
MEA anticipated moderate growth over the forecast period, driven by increased internet penetration, rising disposable incomes, and governmental initiatives in the areas of lifestyle and health. App adoption in the MEA region has a single upward trajectory. A moderate upward trend around the globe allows consumers in Saudi Arabia and the UAE to turn to fitness applications that provide workout, diet plans, and sync with a wearable.
Key Players in the Fitness Apps Market:
The fitness apps market companies include Adidas, Nike, Fitbit (Google), MyFitnessPal, Strava, Peloton, Noom, Azumio, Freeletics, ClassPass, and other players.
Recent Developments in the Fitness Apps Market:
-
July 2024 – MyFitnessPal, the global leader in nutrition and food tracking, released its 2024 Summer Release, which brings a series of new features to promote long-term behavior change. The release is built to help users meet their weight loss and wellness objectives more effectively and naturally.
-
August 2023 – Fitbit released a significant update to its app, with a new look and feel and a three-tabbed UI. This redesign is all about presenting a more detailed, personalized view of users' health by bringing major metrics to the forefront to enable them to more easily see trends and track progress.
| Report Attributes | Details |
|---|---|
| Market Size in 2024 | USD 10.58 Billion |
| Market Size by 2032 | USD 30.28 Billion |
| CAGR | CAGR of 14.13% From 2025 to 2032 |
| Base Year | 2024 |
| Forecast Period | 2025-2032 |
| Historical Data | 2021-2023 |
| Report Scope & Coverage | Market Size, Segments Analysis, Competitive Landscape, Regional Analysis, DROC & SWOT Analysis, Forecast Outlook |
| Key Segments | • By Type (Exercise & Weight Loss, Diet & Nutrition, Activity Tracking) • By Platform (Android, iOS, Others) • By Device (Smartphones, Tablets, Wearable Devices) |
| Regional Analysis/Coverage | North America (US, Canada, Mexico), Europe (Germany, France, UK, Italy, Spain, Poland, Turkey, Rest of Europe), Asia Pacific (China, India, Japan, South Korea, Singapore, Australia, Rest of Asia Pacific), Middle East & Africa (UAE, Saudi Arabia, Qatar, South Africa, Rest of Middle East & Africa), Latin America (Brazil, Argentina, Rest of Latin America) |
| Company Profiles | Adidas, Nike, Fitbit (Google), MyFitnessPal, Strava, Peloton, Noom, Azumio, Freeletics, ClassPass, and other players. |
Frequently Asked Questions
Ans: North America dominated the Fitness Apps Market in 2024.
Ans: The “iOS” segment dominated the Fitness Apps Market.
Ans: Rise in smartphone and internet penetration is driving the market growth.
Ans: The Fitness Apps Market was USD 10.58 billion in 2024 and is expected to reach USD 30.28 billion by 2032.
Ans: The Fitness Apps Market is expected to grow at a CAGR of 14.13% from 2025 to 2032.
Get in Touch
