Flocculant & Coagulant Market Report Scope & Overview:
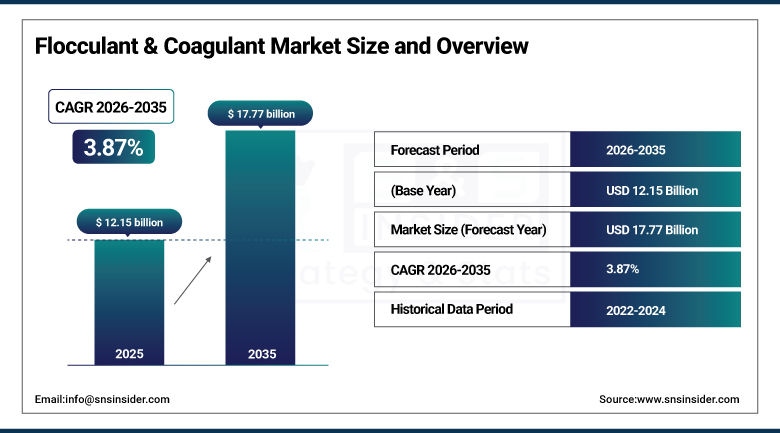
The Flocculant and Coagulant Market was valued at USD 12.15 billion in 2025 and is expected to reach USD 17.77 billion by 2035, growing at a CAGR of 3.87% from 2026–2035.
The global flocculant and coagulant market occupies an indispensable position in humanity's management of water resources providing the chemical agents that make municipal drinking water safe, industrial wastewater compliant, and industrial process water recyclable. Coagulants, principally aluminium sulphate, polyaluminium chloride (PAC), ferric chloride, and organic polyamines, neutralise the electrical charges on colloidal particles suspended in water, causing them to aggregate into larger primary particles. Flocculants, principally polyacrylamide-based polymers in anionic, cationic, and non-ionic forms, gently agitate these primary particles into large, rapidly settling flocs that can be removed by sedimentation or filtration. This two-stage coagulation-flocculation chemistry serves municipal water utilities, industrial plants, mining operations, and paper mills across every inhabited continent. The market is driven by the convergence of worsening global water scarcity, affecting approximately 2 billion people, increasingly stringent wastewater discharge regulations, accelerating urbanisation driving municipal water infrastructure investment, and industrial expansion creating growing volumes of process wastewater requiring treatment.
The Flocculant and Coagulant Market's 3.87% CAGR from 2026 to 2035 reflects the stable, essential, and non-discretionary nature of water treatment chemical demand — as clean water access and industrial wastewater compliance are fundamental requirements of modern society and industry that cannot be deferred, optimised away, or substituted — creating a market characterised by predictable long-duration demand growth anchored in demographic expansion, industrial production growth, and the tightening global regulatory framework for water quality management through the entire forecast horizon.
Flocculant and Coagulant Market Size and Forecast
• Market Size in 2025: USD 12.15 Billion
• Market Size by 2035: USD 17.77 Billion
• CAGR: 3.87% from 2026 to 2035
• Base Year: 2025
• Forecast Period: 2026–2035
• Historical Data: 2022–2024
To Get more information on Flocculant and Coagulant Market - Request Free Sample Report
Flocculant and Coagulant Market Trends
• Accelerating development and adoption of bio-based and biodegradable flocculant formulations — including chitosan, moringa oleifera-derived coagulants, and biopolymer flocculants — driven by regulatory pressure on acrylamide monomer residues in polyacrylamide flocculants and growing utility sustainability mandates for green chemistry water treatment solutions.
• The increase in production of pre-polymerised inorganic coagulant agents such as high basicity PAC and polymeric ferric sulphate that provide greater coagulant performance in wider ranges of pH and water temperature compared to ordinary alum, making it possible to improve treatment performance in situations of variable raw water conditions.
• Growth in the use of flocculants in the mining sector for various uses including thickening of tailings, recovering water using the paste tailings process, as well as water reuse techniques to reduce water use in mining operations in regions with limited water sources.
• The rising use of flocculants and coagulants for zero liquid discharge (ZLD) applications in industries aimed at maximizing water recovery and eliminating industrial wastewater discharges, due to stringent water discharge laws and shortage of industrial water resources in Asia and the Middle East.
• Growing application of flocculants and coagulants in industrial zero-liquid-discharge (ZLD) systems that maximise water recovery and eliminate industrial effluent discharge, driven by tightening water discharge regulations and industrial water scarcity across Asia and the Middle East.
• Increasing adoption of combination coagulant-flocculant products that simplify water treatment chemical programmes, reduce dosing equipment requirements, and improve operational efficiency for smaller municipal water utilities and industrial facilities.
• Expansion of the flocculant and coagulant market in desalination pre-treatment applications — as global desalination capacity continues growing in water-scarce Middle Eastern, North African, and coastal regions — where coagulation-flocculation is the primary pre-treatment step for seawater reverse osmosis membranes.
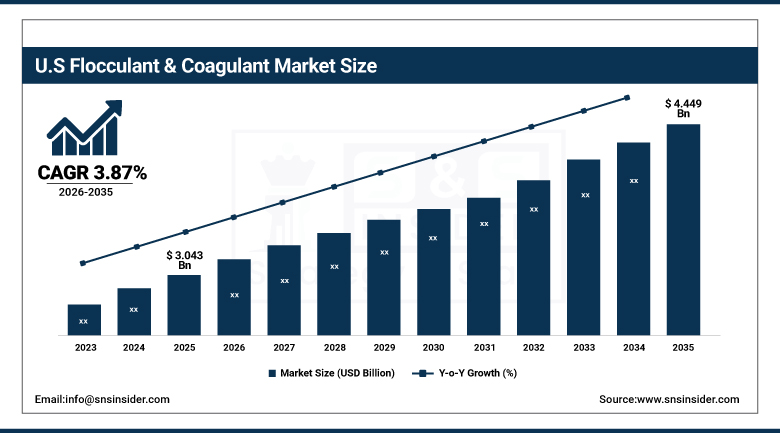
U.S. Flocculant and Coagulant Market was valued at USD 3.043 billion in 2025 and is expected to reach USD 4.449 billion by 2035, registering a CAGR of 3.87% during 2026–2035.
The United States represents one of the world's largest national flocculant and coagulant markets, driven by a vast municipal water treatment infrastructure serving over 330 million Americans across tens of thousands of water treatment facilities, stringent EPA drinking water standards, including the landmark 2024 PFAS maximum contaminant level regulations that are nudging utilities toward advanced treatment trains incorporating chemical coagulation, and a large industrial sector spanning oil & gas, mining, paper & pulp, and manufacturing that generates substantial industrial wastewater treatment demand. The U.S. market is characterised by high adoption of advanced coagulant formulations — including high-basicity PAC and specialised organic coagulants — that meet the performance demands of utilities treating challenging raw water sources. AI-powered digital dosing control systems are gaining rapid traction among U.S. utilities seeking to optimise chemical consumption costs while maintaining compliance with tightening EPA water quality standards.
The 2024 U.S. EPA's establishment of maximum contaminant levels for PFAS compounds in drinking water — requiring utilities to implement advanced treatment capable of removing these persistent chemicals — is creating a significant new treatment infrastructure investment cycle that, while primarily deploying granular activated carbon and ion exchange, is simultaneously driving hybrid treatment train configurations that incorporate enhanced coagulation-flocculation as a pre-treatment step for improved PFAS removal performance, sustaining structural demand growth for premium coagulant formulations in the U.S. municipal water treatment sector through the 2026–2035 forecast period.
Flocculant and Coagulant Market Segment Analysis
- Based on Type, Coagulants accounted for the largest market share (~62%) in 2025; Flocculants expected to be the faster-growing type
- Based on Application, Municipal Water Treatment commanded the largest market share (~40%) in 2025; Industrial Wastewater Treatment expected to be the fastest-growing application
- Based on Form, Liquid accounted for the largest market share in 2025, Dry gaining in smaller operations and emerging markets.
Flocculant and Coagulant Market Segment Analysis
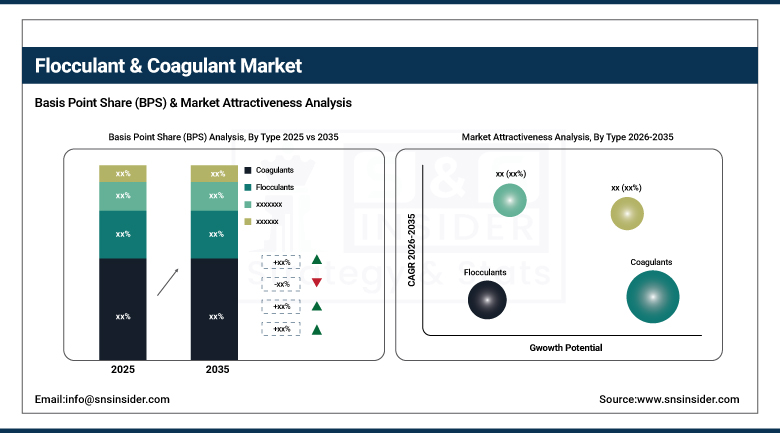
By Type: Coagulants dominates, Flocculants grow faster
Coagulants retained the dominant market position with approximately 62% of the Flocculant and Coagulant Market in 2025, reflecting their role as the primary chemical intervention in water treatment. It provides the essential charge neutralisation function that enables particle aggregation without which effective sedimentation and filtration cannot proceed. Inorganic coagulants dominates by aluminium sulphate (alum) and polyaluminium chloride (PAC). These comprise the largest share of revenues earned by coagulants due to their affordability, efficiency in different water qualities, and suitability for existing water treatment plant infrastructure. Organic coagulants like polyamines, poly-DADMAC, and chitosan-based products are gaining more acceptance in applications where smaller sludge volumes, pH-neutral processes, and compliance with specific regulations on inorganic residuals in treated water are required.
The flocculants category is estimated to witness faster growth at a CAGR of about 4.56% over the period from 2022 to 2035, based on the superior settling properties of high-molecular-weight polyacrylamides. This allows treatment plants to operate at higher flow rates, requires smaller sedimentation basins, and enhances dewatering efficiency. This makes these solutions particularly attractive for expansion of water utility capacity without substantial investment in civil infrastructure. The mining industry’s increasing use of polymer flocculants in tailings thickening and water recovery is opening up a valuable segment of flocculant demand.
By Application: Municipal Water Treatment dominates, Industrial Wastewater grows fastest
Municipal water treatment retained the largest application segment share at approximately 40% of the Flocculant and Coagulant Market in 2025. It reflects the fundamental and universal requirement for coagulation-flocculation in drinking water production. The world's approximately 6,000 municipal water treatment plants in the U.S. alone, combined with the hundreds of thousands of treatment facilities across Europe, Asia, Latin America, and Africa, create a massive installed base of treatment capacity that creates recurring annual demand for coagulant and flocculant chemicals. India's Jal Jeevan Mission, targeting potable water connections to 192 million rural households, exemplifies the scale of emerging market municipal water infrastructure investment that is sustaining strong municipal treatment chemical demand growth.
Industrial wastewater treatment is projected to record the fastest application CAGR of approximately 5.08% from 2026 to 2035. It is driven by the expansion of manufacturing, mining, oil & gas, and food processing industries globally generating growing volumes of complex industrial effluents requiring chemical treatment for discharge compliance. The tightening of industrial wastewater discharge standards across Asia Pacific, Latin America, and the Middle East is creating new compliance-driven demand for chemical treatment solutions in markets where industrial water treatment has been underdeveloped relative to the scale of industrial activity.
Flocculant and Coagulant Market Regional Analysis
|
Region |
Major Country |
Share within Region (%) |
|---|---|---|
|
North America |
United States |
39% |
|
Europe |
Germany |
32% |
|
Asia Pacific |
China |
48% |
|
Middle East & Africa |
Saudi Arabia |
31% |
|
Latin America |
Brazil |
44% |
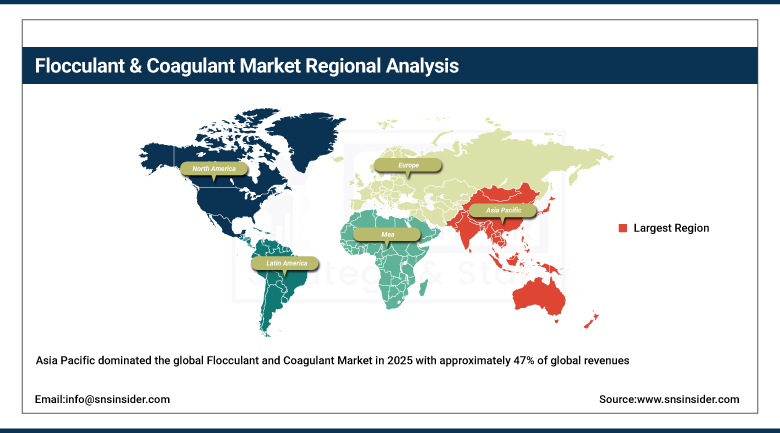
Asia Pacific Flocculant and Coagulant Market Insights
Asia Pacific dominated the global Flocculant and Coagulant Market in 2025 with approximately 47% of global revenues, driven by the region's extraordinary scale of water treatment needs — encompassing China's massive municipal water infrastructure investment of approximately USD 169 billion in water conservation projects in 2023 alone, India's Jal Jeevan Mission targeting 192 million household water connections, and the rapid industrialisation across Southeast Asia creating growing industrial wastewater volumes. China leads regional demand through both the world's largest municipal water treatment system and one of the world's largest industrial water treatment chemical consumption bases, while India's Jal Jeevan Mission represents one of the world's most significant near-term water treatment infrastructure investment programmes.
Get Customized Report as per Your Business Requirement - Enquiry Now
North America Flocculant and Coagulant Market Insights
North America maintains a significant flocculant and coagulant market position, anchored by the United States' extensive municipal water treatment infrastructure, stringent EPA water quality standards driving continuous treatment performance improvement, and a large industrial base in oil & gas, mining, and manufacturing generating substantial industrial water treatment chemical demand. The U.S. EPA's 2024 PFAS drinking water standards are creating new treatment investment cycles that sustain coagulant demand growth. Kemira's January 2025 launch of bio-flocculants targeted at North American utilities underscores the growing premium market for sustainable water treatment chemistry.
Europe Flocculant and Coagulant Market Insights
Europe represents a mature, technically sophisticated flocculant and coagulant market, shaped by the EU Water Framework Directive, Urban Wastewater Treatment Directive, and evolving drinking water quality standards that maintain high technical performance requirements for water treatment chemicals. Kemira's capacity expansion in Fredrikstad, Norway — with new coagulant capacity expected operational by end of 2025 to address growing Nordic market demand — exemplifies the ongoing capacity investment by leading European suppliers to meet sustained regional demand growth. Germany, France, and the UK are the leading European markets.
Middle East & Africa and Latin America Flocculant and Coagulant Market Insights
MEA is a growing flocculant and coagulant market anchored by the Middle East's extensive desalination industry — where coagulation-flocculation is the primary pre-treatment step for seawater reverse osmosis — and Sub-Saharan Africa's growing municipal water infrastructure investment. Saudi Arabia and UAE lead MEA demand through their world-leading desalination programmes. Latin America is anchored by Brazil — approximately 43% of regional revenues — driven by its large municipal water treatment sector and expanding industrial water treatment market in mining, food processing, and petroleum refining.
Flocculant and Coagulant Market Growth Drivers:
Global water scarcity, tightening wastewater regulations, and municipal infrastructure investment
The primary structural growth drivers for the Flocculant and Coagulant Market are the worsening global water crisis — affecting approximately 2 billion people globally and compelling governments worldwide to invest in water treatment and conservation infrastructure — combined with the tightening regulatory frameworks for both drinking water quality and industrial wastewater discharge that mandate effective coagulation-flocculation chemistry across an expanding range of applications. The demographic tailwind of rapid urbanisation — with the UN projecting 68% of the world's population in cities by 2050 — creates sustained long-duration demand for expanded municipal water treatment capacity, ensuring that flocculant and coagulant demand grows in durable alignment with global population and urbanisation trajectories through 2035.
China's record USD 169 billion investment in water conservation projects in 2023 — encompassing 27,900 new water conservation projects to extend national water supply networks — combined with India's Jal Jeevan Mission targeting drinking water connections to 192 million rural households collectively represent the most significant concentration of water treatment infrastructure investment in human history, creating an extraordinary near-term demand catalyst for flocculant and coagulant products across the world's two most populous countries and sustaining Asian market leadership in global water treatment chemical consumption through the 2026–2035 forecast period.
Flocculant and Coagulant Market Restraints
Environmental concerns over polyacrylamide residues, competition from alternative technologies, and raw material price volatility
A significant restraint on the Flocculant and Coagulant Market is growing regulatory and environmental scrutiny of acrylamide monomer residues in polyacrylamide flocculants — a neurotoxic compound classified as a probable human carcinogen — that is driving development of alternative polymer flocculant chemistries and creating compliance uncertainty for conventional polyacrylamide-based products, particularly in drinking water applications. Competition from electrocoagulation systems — which use electrical current to generate coagulant species in situ without chemical procurement and storage — is gaining ground in smaller industrial applications where capital cost is declining and operational simplicity is valued. Raw material cost volatility for aluminium sulphate and polyacrylamide precursors creates margin pressure during commodity price escalation events, limiting manufacturers' ability to fully pass through input cost increases in competitive tender environments.
Flocculant and Coagulant Market Opportunities
Bio-based flocculants, AI-driven smart dosing, and desalination pre-treatment expansion
The development of bio-based and biodegradable flocculant alternatives — derived from natural polysaccharides, proteins, and plant-based sources — represents the most important product innovation opportunity in the market, addressing both the regulatory pressure on synthetic polymer flocculants and the growing utility sector preference for sustainable treatment chemistry that reduces chemical residuals and sludge volumes. AI-powered smart dosing technology — combining real-time influent quality sensors with machine learning dosing optimisation algorithms — creates a compelling value-added service opportunity for flocculant and coagulant suppliers able to bundle chemical supply with digital performance optimisation services that reduce utility operating costs. The continued global expansion of desalination capacity — projected to double in installed capacity by 2040 — creates a growing, premium-value application for high-performance coagulant pre-treatment products that protect reverse osmosis membranes from particulate fouling and extend membrane life.
Recent Developments:
• 2026: Kemira Oyj expanded production capacity for water treatment polymers in Europe to strengthen supply of sustainable coagulants and flocculants for municipal and industrial wastewater treatment applications.
• 2026: SNF Group introduced advanced high-performance flocculant formulations designed to improve sludge dewatering efficiency and reduce chemical consumption across mining and wastewater treatment operations.
• 2026: Veolia Water Technologies launched upgraded water treatment solutions integrating smart monitoring and optimized coagulant dosing technologies to enhance industrial water recycling and operational efficiency.
Flocculant and Coagulant Market Key Players
Some of the Flocculant and Coagulant Market Companies are:
• Kemira Oyj
• SNF Group
• BASF SE
• Ecolab Inc.
• Solenis LLC
• Chemtrade Logistics Inc.
• Suez Water Technologies & Solutions
• Veolia Water Technologies
• Solvay S.A.
• Evoqua Water Technologies
• Feralco AB
• GEO Specialty Chemicals
• Nouryon
• Corteva Agriscience
• Hychem Inc.
• PQ Group Holdings Inc.
• Kurita Water Industries Ltd.
• Accepta Ltd.
• Tidal Vision
• Aries Chemical Inc.
| Report Attributes | Details |
|---|---|
| Market Size in 2025 | USD 12.15 Billion |
| Market Size by 2035 | USD 17.77 Billion |
| CAGR | CAGR of 3.87% From 2026 to 2035 |
| Base Year | 2025 |
| Forecast Period | 2026-2035 |
| Historical Data | 2022-2024 |
| Report Scope & Coverage | Market Size, Segments Analysis, Competitive Landscape, Regional Analysis, DROC & SWOT Analysis, Forecast Outlook |
| Key Segments | • By Type (Coagulants — Inorganic, Organic; Flocculants — Anionic, Cationic, Non-Ionic) • By Application (Municipal Water Treatment, Industrial Wastewater Treatment, Paper & Pulp, Mining & Minerals Processing, Oil & Gas, Textiles, Others) • By Form (Dry, Liquid) |
| Regional Analysis/Coverage | North America (US, Canada), Europe (Germany, UK, France, Italy, Spain, Russia, Poland, Rest of Europe), Asia Pacific (China, India, Japan, South Korea, Australia, ASEAN Countries, Rest of Asia Pacific), Middle East & Africa (UAE, Saudi Arabia, Qatar, South Africa, Rest of Middle East & Africa), Latin America (Brazil, Argentina, Mexico, Colombia, Rest of Latin America). |
| Company Profiles | Kemira Oyj, SNF Group, BASF SE, Ecolab Inc., Solenis LLC, Chemtrade Logistics Inc., Suez Water Technologies & Solutions, Veolia Water Technologies, Solvay S.A., Evoqua Water Technologies, Feralco AB, GEO Specialty Chemicals, Nouryon, Corteva Agriscience, Hychem Inc., PQ Group Holdings Inc., Kurita Water Industries Ltd., Accepta Ltd., Tidal Vision, Aries Chemical Inc. |
Frequently Asked Questions
Asia Pacific dominated the Flocculant and Coagulant Market in 2025 with approximately 47% of global revenues, anchored by China's record water infrastructure investment of USD 169 billion in 2023, India's Jal Jeevan Mission targeting 192 million household water connections.
Municipal Water Treatment dominated the market in 2025 with approximately 40% of global revenues, driven by the universal requirement for coagulation-flocculation chemistry in drinking water production.
Worsening global water scarcity affecting approximately 2 billion people compelling government investment in water treatment infrastructure, tightening wastewater discharge regulations across emerging and developed economies, and rapid urbanisation driving expanded municipal water treatment capacity requirements are the primary structural growth drivers through 2035.
The Flocculant and Coagulant Market was valued at USD 12.15 billion in 2025.
The Flocculant and Coagulant Market is expected to grow at a CAGR of 3.87% from 2026 to 2035.
Get in Touch
