Flywheel Energy Storage Market Report Scope & Overview:
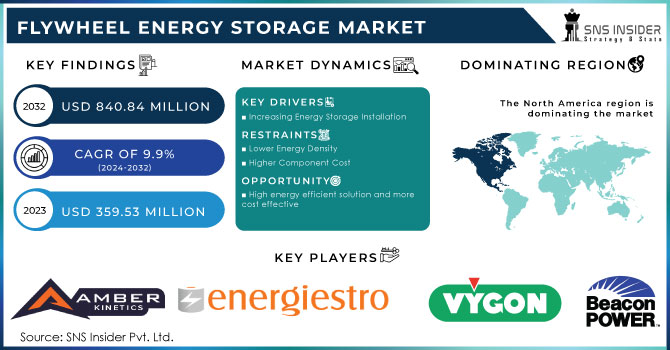
The Flywheel Energy Storage Market size was valued at USD 359.53 million in 2023 and is expected to reach USD 840.84 million by 2032 with a growing CAGR of 9.9% over the forecast period of 2024-2032.
A microgrid powered by renewable energy can receive instant active power support from a flywheel energy storage unit (FESU). It has been employed in uninterruptible power supply in recent years when the short-duration power shifts shorten battery life. Flywheels are utilised in the sphere of transportation and in space applications for energy transmission and, in particular, to stabilise or drive satellites (gyroscopic effect) in the context of autonomous energy generation. The extended lifespan of flywheel energy storage is its distinguishing feature. In Stephentown, New York, Beacon Power is developing the biggest flywheel energy storage device in the world.
Since comparable devices have only been used for testing and small-scale operations, the 20-megawatt system represents a significant advancement in flywheel energy storage technology. 200 carbon fiber flywheels are used in the system, which is levitated in a vacuum chamber. The flywheels can continuously discharge 1 megawatt of power for 15 minutes while absorbing grid energy. The system replaces supplementary natural gas power units that were previously utilised to balance supply and demand in grid activity by increasing energy production during times of peak demand and decreasing production during times of high supply.
Get more information on Flywheel Energy Storage Market - Request Sample Report
MARKET DYNAMICS
KEY DRIVERS:
-
Increasing Energy Storage Installation
By utilizing stored energy during periods of high demand, high generating costs, or when no alternative generation is available, Energy Storage Systems (ESS) may balance the supply and demand of electrical energy. Energy costs have risen as a result of the rising energy demand in several emerging nations, including Brazil, Russia, India, China, and South Africa. In order to combine conventional power plants to fulfil rising demand and complement intermittent RES for their integration into the electrical grid, ESS is a crucial requirement.
RESTRAIN:
-
Lower Energy Density
-
Higher Component Cost
OPPORTUNITY:
-
High energy efficient solution and more cost effective
-
Increasing energy generation in renewable energy sources.
Flywheel storage is used in combination with renewable wind and solar power in remote locations, eliminating the inconsistent nature of renewable energy while delivering a constant power supply and the grid or other facilities.
CHALLENGES:
-
Rising Transition Towards Renewable Energy
IMPACT OF COVID-19
The COVID-19 pandemic's impact on electrical energy storage technology was examined in this study investigated. According to energy and particularly electrical energy storage sectors, the outcomes of the crises and opportunities brought on by this unforeseen pandemic in the future processes were assessed. Homeowners' requirements for electrical energy considerably rose as a result of the house quarantines implemented to stop the epidemic's spread. Due to the risk of infection in enclosed spaces like public buses or metros, the COVID-19 pandemic has also caused significant changes in people's public transportation habits. It has been observed that 20% of people may prefer electric micro mobility devices powered by lithium batteries. Despite the fact that the COVID-19 epidemic has greatly reduced the demand for primary energy sources
KEY MARKET SEGMENTATION
By Application
-
UPS
-
Data Centre
-
Transport
-
Others
REGIONAL ANALYSIS
North America dominated the flywheel energy storage market in 2022, and this trend will continue in the years to come. This can be linked to the rising number of flywheel initiatives being implemented around the area to preserve energy. In order to make up for the intermittent nature of renewable energy, flywheels are also being coupled to renewable energy sources. A considerable growth rate in the Asia-Pacific (APAC) flywheel energy storage market is anticipated during the forecast period as a result of rising need for a reliable power supply.

Get Customized Report as per your Business Requirement - Request For Customized Report
REGIONAL COVERAGE:
North America
-
US
-
Canada
-
Mexico
Europe
-
Eastern Europe
-
Poland
-
Romania
-
Hungary
-
Turkey
-
Rest of Eastern Europe
-
-
Western Europe
-
Germany
-
France
-
UK
-
Italy
-
Spain
-
Netherlands
-
Switzerland
-
Austria
-
Rest of Western Europe
-
Asia Pacific
-
China
-
India
-
Japan
-
South Korea
-
Vietnam
-
Singapore
-
Australia
-
Rest of Asia Pacific
Middle East & Africa
-
Middle East
-
UAE
-
Egypt
-
Saudi Arabia
-
Qatar
-
Rest of Middle East
-
-
Africa
-
Nigeria
-
South Africa
-
Rest of Africa
-
Latin America
-
Brazil
-
Argentina
-
Colombia
-
Rest of Latin America
RECENT DEVELOPMENTS
-
In July 2022, Active Power and Central Power teamed together to deliver standby generators from Central Power and live demonstrations of POWERHOUSE power outages. The company's flagship CLEANSOURCE PLUS MMS 1.33MW UPS with automated transfer is installed in the POWERHOUSE.
-
In June 2022, Adaptive Balancing Power installed a new charging infrastructure with flywheel storage, enabling the area to transition to electric buses even without having to increase its power grids. The high-performance flywheel mass storage pantograph charging station is anticipated to start up in September. In ordinary driving operations, a test period of 18 months is planned. The infrastructure concept will also be used to other locations following a successful test.
-
May 2022 - Sartorius, a major corporation in the life sciences industry, revealed that its offices now have UPS systems from Piller with flywheel power backup.
KEY PLAYERS
The major Players are Langley Holdings pic, Amber Kinetics, Inc., Stornetic GmbH, POWERTHRU, Energiestro, VYCON, Inc., Be New Energy (Tianjin) Co., Ltd. (BNE), Beacon Power, LLC, PUNCH Flybrid, Kinetic Traction Systems, Inc. and other players are listed in a final report.
| Report Attributes | Details |
| Market Size in 2023 | US$ 359.53 Mn |
| Market Size by 2032 | US$ 840.84 Mn |
| CAGR | CAGR of 9.9 % From 2024 to 2032 |
| Base Year | 2023 |
| Forecast Period | 2024-2032 |
| Historical Data | 2020-2022 |
| Report Scope & Coverage | Market Size, Segments Analysis, Competitive Landscape, Regional Analysis, DROC & SWOT Analysis, Forecast Outlook |
| Key Segments | • By Application, (UPS, Data Centre, Distributed Energy Generation, Transport, Others) |
| Regional Analysis/Coverage | North America (US, Canada, Mexico), Europe (Eastern Europe [Poland, Romania, Hungary, Turkey, Rest of Eastern Europe] Western Europe] Germany, France, UK, Italy, Spain, Netherlands, Switzerland, Austria, Rest of Western Europe]). Asia Pacific (China, India, Japan, South Korea, Vietnam, Singapore, Australia, Rest of Asia Pacific), Middle East & Africa (Middle East [UAE, Egypt, Saudi Arabia, Qatar, Rest of Middle East], Africa [Nigeria, South Africa, Rest of Africa], Latin America (Brazil, Argentina, Colombia Rest of Latin America) |
| Company Profiles | Langley Holdings pic, Amber Kinetics, Inc., Stornetic GmbH, POWERTHRU, Energiestro, VYCON, Inc., Be New Energy (Tianjin) Co., Ltd. (BNE), Beacon Power, LLC, PUNCH Flybrid, Kinetic Traction Systems, Inc. |
| Key Drivers | • Increasing Energy Storage Installation |
| Market Restraints | • Lower Energy Density • Higher Component Cost |
Get in Touch
