FRP Rebar Market Report Scope & Overview:
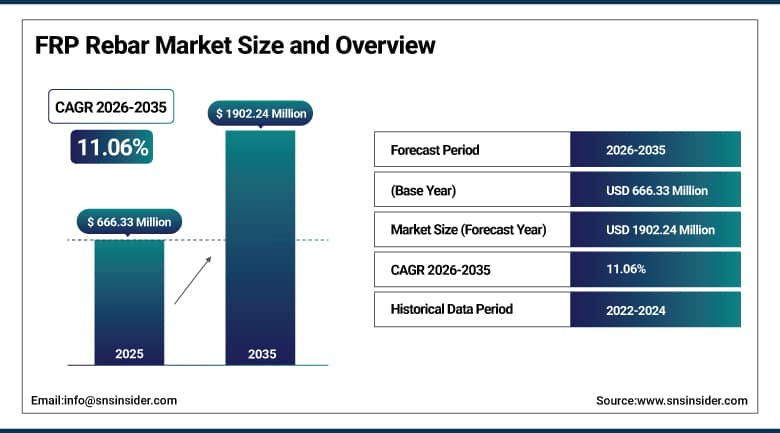
The FRP Rebar Market was valued at USD 666.33 million in 2025 and is expected to reach USD 1902.24 million by 2035, growing at a CAGR of 11.06% from 2026-2035.
The FRP rebar market is expanding because of the increasing demand for corrosion-resistant and light-weight reinforcing bars. The increased investment in bridges, highway infrastructure, tunnels, marine structures, and waste water treatment plants is helping the uptake of the products. Some of the benefits of FRP rebars include greater tensile strength, longer life, and less maintenance than regular steel reinforcement. Increased emphasis on the use of sustainable building materials and structures is fueling the growth of the market. Technical developments in the manufacture of composites and awareness about cost-effectiveness during the lifecycle are other factors boosting the demand for FRP rebar.
For instance, in March 2025, Dextra Group, in association with its Saudi Arabian GFRP manufacturing partner Industrial Control Solutions Company (ICSC), joined as a Bronze Supporting Member of NEx, an ACI Center of Excellence for Nonmetallic Building Materials, underscoring a growing institutional push to standardize and accelerate FRP rebar adoption across global construction markets.
Market Size and Forecast
-
Market Size 2026E: USD 740.03 Million
-
Market Size 2035: USD 1902.24 Million
-
CAGR (2026-2035): 11.06%
-
Fastest Growing Market: Asia Pacific
-
Largest Market: North America
To Get More Information On FRP Rebar Market - Request Free Sample Report
FRP Rebar Market Trends
-
Rising demand for corrosion-resistant and lightweight construction materials is driving the FRP rebar market.
-
Growing adoption across infrastructure, marine, transportation, and industrial construction projects is boosting market growth.
-
Expansion of bridge rehabilitation, coastal infrastructure, and concrete reinforcement applications is fueling deployment.
-
Increasing focus on durability, reduced maintenance costs, and extended structural lifespan is shaping adoption trends.
-
Advancements in composite manufacturing technologies and resin formulations are enhancing strength and performance.
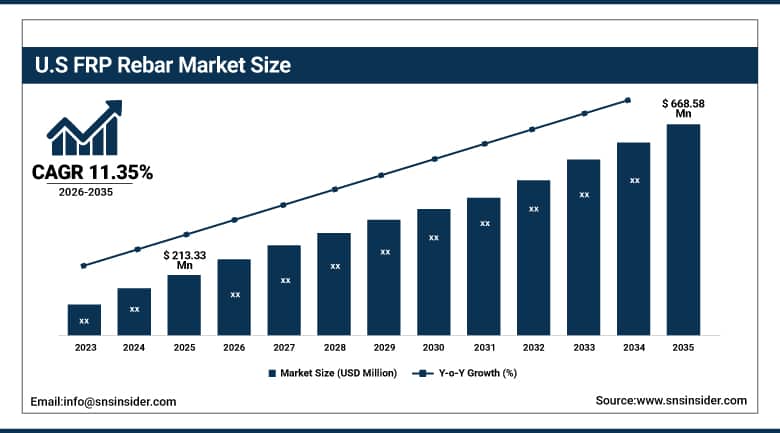
U.S. FRP Rebar Market Size Outlook
The U.S. FRP Rebar Market was valued at USD 213.33 million in 2025 and is expected to reach USD 668.58 million by 2035, growing at a CAGR of 11.35% from 2026-2035.
The U.S. FRP rebar market is witnessing growth owing to a higher number of infrastructure upgradation and modernization projects taking place. An increase in investments in bridges, roads, marine applications, and water treatment plants is contributing to the uptake of the products. FRP rebars are characterized by high durability, light weight, and low maintenance costs as compared to their steel equivalents.
According to the American Society of Civil Engineers, more than 42% of U.S. bridges are over 50 years old, creating substantial demand for durable reinforcement materials with lower maintenance requirements in bridge rehabilitation and reconstruction projects.
FRP Rebar Market Segment Analysis
-
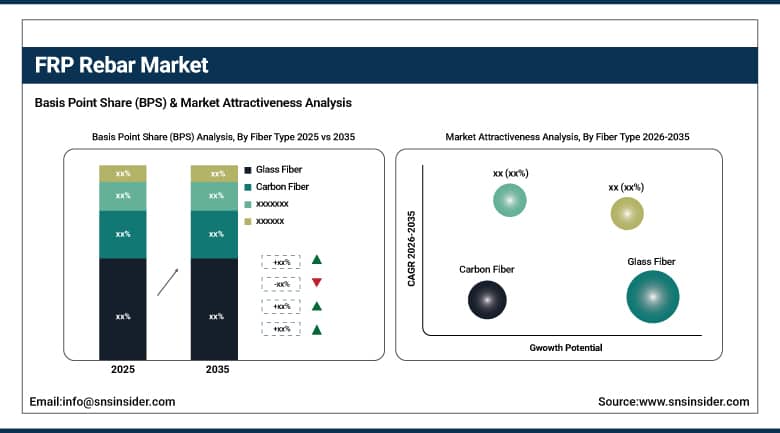
By Fiber Type, Glass Fiber segment dominated the FRP Rebar Market in 2025 with 62.45% share; Carbon Fiber segment is the fastest growing.
-
By Diameter, 10–20 MM segment dominated the FRP Rebar Market in 2025 with 54.37% share; <10 MM segment is the fastest growing.
-
By Resin Type, Vinyl Ester segment dominated the FRP Rebar Market in 2025 with 55.62% share; Epoxy segment is the fastest growing.
-
By Application, Highways, Bridges and Buildings segment dominated the FRP Rebar Market in 2025 with 58.24% share; Marine Infrastructures segment is the fastest growing.
By Fiber Type, glass fiber dominates the FRP rebar market, carbon fiber is the fastest growing
Glass Fiber dominates the FRP Rebar Market due to its economic production cost, effective corrosion resistance, and high tensile strength. This material is used extensively across various industries, including infrastructure, highways, bridges, and commercial buildings, due to its light weight and durability. Demand from industries seeking non-corrosive reinforcement materials in durable structures is helping boost the demand for these products. Ease of availability of raw materials and reduced costs of manufacturing have helped in increasing market dominance in 2025.
Carbon Fiber is the fastest growing segment in the FRP Rebar Market owing to its higher strength-to-weight ratio, stiffness, and durability. Adoption in the construction of durable and robust infrastructure is expected to increase rapidly in the coming period, which will drive market growth in the coming future. High fatigue resistance properties of carbon fiber rebars make them popular among consumers. Increasing investment in smart infrastructure and high-performance buildings is contributing toward rapid market growth in recent times.
By Diameter, 10–20 MM segment dominates the FRP rebar market, <10 MM segment is the fastest growing
The 10–20 MM segment dominates the FRP Rebar Market on account of their wide application in constructions that require medium level reinforcement strength in both residential, commercial, and infrastructural projects. This segment has proven to be highly effective because they have a good balance of strength, flexibility, and ease in installation. The fact that they are suitable for use in highway, bridge, foundation, and concrete slab reinforcements makes their use more prevalent. Increasing construction activities and rising demand for corrosion resistance rebars in big projects has led to dominance in the 10-20 MM segment.
<10 MM segment is the fastest growing segment in the FRP Rebar Market on account of increasing demand for lighter reinforcement products for use in various projects. This segment is very flexible to handle and provides excellent corrosion resistance. Their wide adoption in renovations and decorative concrete structures has resulted in high growth rates for the segment. Increasing adoption in earthquake-resistant structures and other special applications has contributed greatly towards fast growth in the market in recent times.
By Resin Type, vinyl ester dominates the FRP rebar market, epoxy is the fastest growing
Vinyl Ester dominates the FRP Rebar Market because of its outstanding corrosion resistance capabilities, high mechanical strength, and excellent durability under highly aggressive environmental conditions. The material is commonly chosen by engineers in constructions that are prone to exposure to water, chemicals, and saltwater conditions, including in bridges, tunnels, and industrial infrastructure. Moreover, its high bonding strength and excellent thermal stability increase the efficiency and reliability of structures. High demands for efficient reinforcement products with low maintenance needs are driving the growth of this type of materials worldwide in 2025.
Epoxy is the fastest growing segment in the FRP Rebar Market due to its remarkable adhesion properties, high mechanical strength, and better resistance to environmental factors. Rising demand for high-tech reinforcement materials in highly-advanced infrastructures and industrial constructions is positively contributing to the adoption of the product. Epoxy FRP rebars have higher crack resistance compared to other options available on the market. Investments in sustainable and technologically advanced composite materials have significantly boosted sales of epoxy resins recently.
By Application, highways, bridges, and buildings dominate the FRP rebar market, marine infrastructures are the fastest growing
Highways, bridges, and buildings dominate the FRP Rebar Market as a result of increased infrastructure development and an increase in the requirement for corrosion-resistant reinforcement materials. The use of FRP rebars ensures increased durability, reduced maintenance requirements, and extended lifespan under harsh conditions. The increasing usage of advanced reinforcement by both governmental organizations as well as private developers in the development of transport and commercial infrastructure further adds to the dominance of this market segment in the global market in 2025.
Marine infrastructures are the fastest growing segment in the FRP Rebar Market due to the rising need for corrosion-resistant reinforcement materials in ports, docks, seawalls, offshore energy projects, and marine structures. These materials have superior properties in comparison to other reinforcement options as they ensure increased resistance to saltwater and moisture. Increased investment in the development of marine infrastructure and offshore energy projects as well as higher awareness about increased durability is contributing to growth in the market.
Regional Analysis
|
Region |
Major Country |
Share within Region (%) |
|---|---|---|
|
North America |
United States |
89.4% |
|
Europe |
United Kingdom |
21.6% |
|
Asia Pacific |
China |
59.2% |
|
Middle East & Africa |
UAE |
16.3% |
|
Latin America |
Brazil |
48.1% |
North America FRP Rebar Market Insights
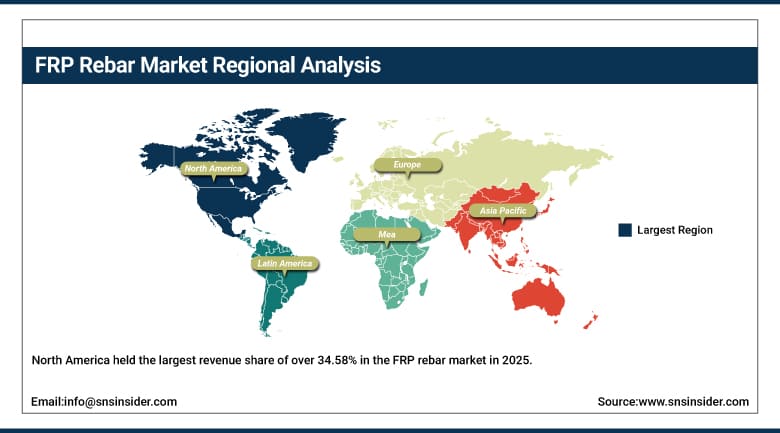
North America held the largest revenue share of over 34.58% in the FRP rebar market in 2025 owing to considerable investment in the development of infrastructure and adoption of anti-corrosion construction materials. The region is known for its developed construction sector and increased need for durable reinforcements in bridges, highways, marine, and water treatment applications. The growing trend of reducing the cost of maintenance and enhancing the lifetime of structures is likely to fuel the adoption of FRP rebar. Governments' spending in transportation infrastructure and increasing awareness about composite materials is expected to drive the market.
Get Customized Report as Per Your Business Requirement - Enquiry Now
Europe FRP Rebar Market Insights
Europe holds a significant position in the FRP rebar market due to rising preference for eco-friendly construction materials along with infrastructure longevity. Increasing expenditures on bridge rehabilitation, tunnel construction, marine infrastructure, and water treatment plants are driving the growth of the market owing to the demand for corrosion resistant reinforcing materials. The stringent laws concerning the safety of infrastructure and its structural performance are making advanced composites increasingly popular across all construction projects. Increasing concerns about minimizing maintenance costs and maximizing infrastructure lifespan are other factors that will drive the market growth.
Asia Pacific FRP Rebar Market Insights
Asia Pacific is the fastest-growing region in the FRP rebar market with a CAGR of 13.14% driven by rapid urbanization and construction development, as well as investment in transportation and industry construction. An increase in demand for durable and corrosion-resistant reinforcing material in marine structures has positively impacted the growth of the market in the Asia Pacific region. The government is making considerable investments in highway, bridge, tunnel, and smart city constructions, boosting the demand for FRP rebar products. Industrialization and reduced maintenance costs are also contributing factors in growing demand for these products.
Middle East & Africa and Latin America FRP Rebar Market Insights
Middle East & Africa and Latin America regions are witnessing steady growth in the FRP rebar market owing to growth in infrastructure construction and growing investments in commercial and transportation infrastructure construction. Increasing demand for corrosion-resistant materials for use in difficult environmental and coastal infrastructure conditions has aided the adoption of FRP rebar products. Modernization of bridges, highways, and water purification facilities by governments has created favorable opportunities for the adoption of advanced reinforcement solutions such as FRP rebar. Growth in urbanization and industrialization is driving construction activity, thereby boosting adoption of FRP rebar.
Market Dynamics
Growth Drivers: Increasing infrastructure development and rising demand for corrosion-resistant materials driving global FRP rebar adoption growth
The growth in infrastructure development projects, such as roadways, bridges, tunnels, and commercial buildings, has substantially led to an increase in the demand for reinforced materials like FRP rebars. Steel reinforcement suffers greatly from rust and is particularly susceptible in environments with challenging surroundings, thus driving the need for corrosion-resistant options. Some benefits of FRP rebar include lightweight, high tensile strength, and increased longevity, among others, thus making it suitable for current infrastructure needs. Many governments from different areas are spending huge amounts on infrastructure developments in order to upgrade their current infrastructures. There is growing concern about minimizing maintenance costs and improving structural stability in the long run, which is contributing to the growth of FRP rebars' usage.
Restraints: High installation costs and limited awareness restricting widespread adoption of FRP rebar in construction projects
The higher initial expenses required to install FRP rebar relative to the steel-based rebar used by most constructors hinder its extensive adoption. The cost-effectiveness and general availability of steel materials make them more appealing to contractors in terms of both cost savings and familiarity. Lack of awareness of the benefits of FRP rebar in terms of durability, resistance to corrosion, and cost savings on future maintenance also hinders its widespread acceptance. Some areas where such materials are not popular still lack the necessary technical expertise in installing them, making implementation difficult in practice. The lack of standards in FRP regulations and lack of specialized workforce is another factor affecting product acceptance.
Opportunities: Expanding marine infrastructure and water treatment projects creating opportunities for corrosion-resistant FRP rebar manufacturers
The fast expansion of the marine infrastructure development industry and water treatment plant constructions is creating promising opportunities for FRP rebar producers around the world. The adverse weather conditions in coastal, offshore and wastewater handling industries pose serious threats of corrosion for traditional steel reinforced structures. FRP rebar demonstrates better corrosion resistance to water, chemical agents and salts, which makes it very efficient material for use in these industries. There is an increasing trend towards construction of more reliable and maintenance-free reinforcement structures in order to minimize costs associated with repairs. The development of desalination plants, ports, tunnels and wastewater treatment facilities has accelerated this demand even further.
Recent Developments:
-
2026: Dextra Group completed large-scale operational testing of its Durabar GFRP reinforcement system inside a heavy-duty manufacturing environment in Thailand, validating durability, lower maintenance requirements, and improved lifecycle cost performance for industrial flooring applications.
-
2026: Pultrall announced expansion of its Thetford Mines, Québec facility with a new 10,000-square-foot V-ROD production unit scheduled for operation in 2026. The project strengthens North American supply capacity for composite reinforcement used in highways, bridges, and marine infrastructure.
-
2026: Pultrall Inc. opened a new 127,000-square-foot production facility in Edon, Ohio dedicated to manufacturing V-ROD fiberglass rebar. The expansion doubled U.S. production capacity and ensured compliance with Build America Buy America (BABA) infrastructure requirements.
-
2025: Dextra Group launched an internal pilot deployment of its patented Durabar GFRP carpet system at its Thailand manufacturing plant. The project tested installation efficiency, durability, and lifecycle performance of corrosion-resistant composite reinforcement under heavy industrial operating conditions
-
2024: Neuvokas Corporation increased commercial deployment of GatorBar fiberglass rebar across transportation and seawall projects in North America. The company promoted its corrosion-resistant reinforcement as a lower-maintenance alternative to traditional steel rebar in harsh environments.
-
2023: Dextra Group partnered with Arkema to develop next-generation FRP rebar using Elium thermoplastic resin. The collaboration showcased recyclable composite reinforcement solutions at JEC World 2024, targeting stronger, corrosion-resistant, and more sustainable concrete infrastructure materials.
FRP Rebar Market Key Players are:
-
Dextra Group
-
Pultron Composites
-
Pultrall Inc.
-
Schöck Bauteile GmbH
-
Sireg Geotech S.r.l.
-
Hughes Brothers, Inc.
-
Neuvokas Corporation
-
Kodiak Fiberglass Rebar LLC
-
Marshall Composite Technologies LLC
-
Armastek
-
TUF-Bar Inc.
-
Owens Corning
-
ARC Insulations & Insulator Ltd.
-
Jindal Advanced Materials
-
FiReP Group
-
Fibrolux GmbH
-
BP Composites Ltd.
-
Röchling Group
-
Hebei Yulong Composite Material Co., Ltd.
-
SKD Composites
FRP Rebar Market Report Scope:
| Report Attributes | Details |
|---|---|
| Market Size in 2025 | USD 666.33 Million |
| Market Size by 2035 | USD 1902.24 Billion |
| CAGR | CAGR of 11.06% From 2026 to 2035 |
| Base Year | 2025 |
| Forecast Period | 2026-2035 |
| Historical Data | 2022-2024 |
| Report Scope & Coverage | Market Size, Segments Analysis, Competitive Landscape, Regional Analysis, DROC & SWOT Analysis, Forecast Outlook |
| Key Segments | •By Fiber Type (Glass Fiber, Aramid Fiber, Basalt Fiber, Carbon Fiber, Others) •By Diameter (<10 MM, 10–20 MM, >20 MM) •By Resin Type (Vinyl Ester, Epoxy, Others) •By Application (Highways, Bridges and Buildings, Marine Infrastructures, Water Treatment Facilities, Others) |
| Regional Analysis/Coverage | North America (US, Canada), Europe (Germany, UK, France, Italy, Spain, Russia, Poland, Rest of Europe), Asia Pacific (China, India, Japan, South Korea, Australia, ASEAN Countries, Rest of Asia Pacific), Middle East & Africa (UAE, Saudi Arabia, Qatar, South Africa, Rest of Middle East & Africa), Latin America (Brazil, Argentina, Mexico, Colombia, Rest of Latin America). |
| Company Profiles | Dextra Group, Pultron Composites, Pultrall Inc., Schöck Bauteile GmbH, Sireg Geotech S.r.l., Hughes Brothers, Inc., Neuvokas Corporation, Kodiak Fiberglass Rebar LLC, Marshall Composite Technologies LLC, Armastek, TUF-Bar Inc., Owens Corning, ARC Insulations & Insulator Ltd., Jindal Advanced Materials, FiReP Group, Fibrolux GmbH, BP Composites Ltd., Röchling Group, Hebei Yulong Composite Material Co., Ltd., SKD Composites, and Others. |
Frequently Asked Questions
North America dominated the FRP Rebar Market in 2025.
The Glass Fiber segment dominated the FRP Rebar Market in 2025.
Increasing infrastructure development activities and growing demand for corrosion-resistant construction materials driving adoption of advanced FRP rebar solutions globally.
The FRP Rebar Market was valued at USD 666.33 million in 2025.
The FRP Rebar Market is expected to grow at a CAGR of 11.06% from 2026 to 2035.
Get in Touch
